
Australia collection
Australian investor presentation examples
Investor presentations from ASX 200 companies, as lodged with the ASX: quarterly updates from gold, lithium and iron ore miners, results decks, roadshow presentations and investor days. Every slide is readable on the page before you download anything.
- Decks
- 19
- Slides
- 612
- Last added
- 2026-10-30
Quarterly and results presentations
11 decksQuarterly activity updates and half-year or full-year results: production, costs, cash and progress against guidance.
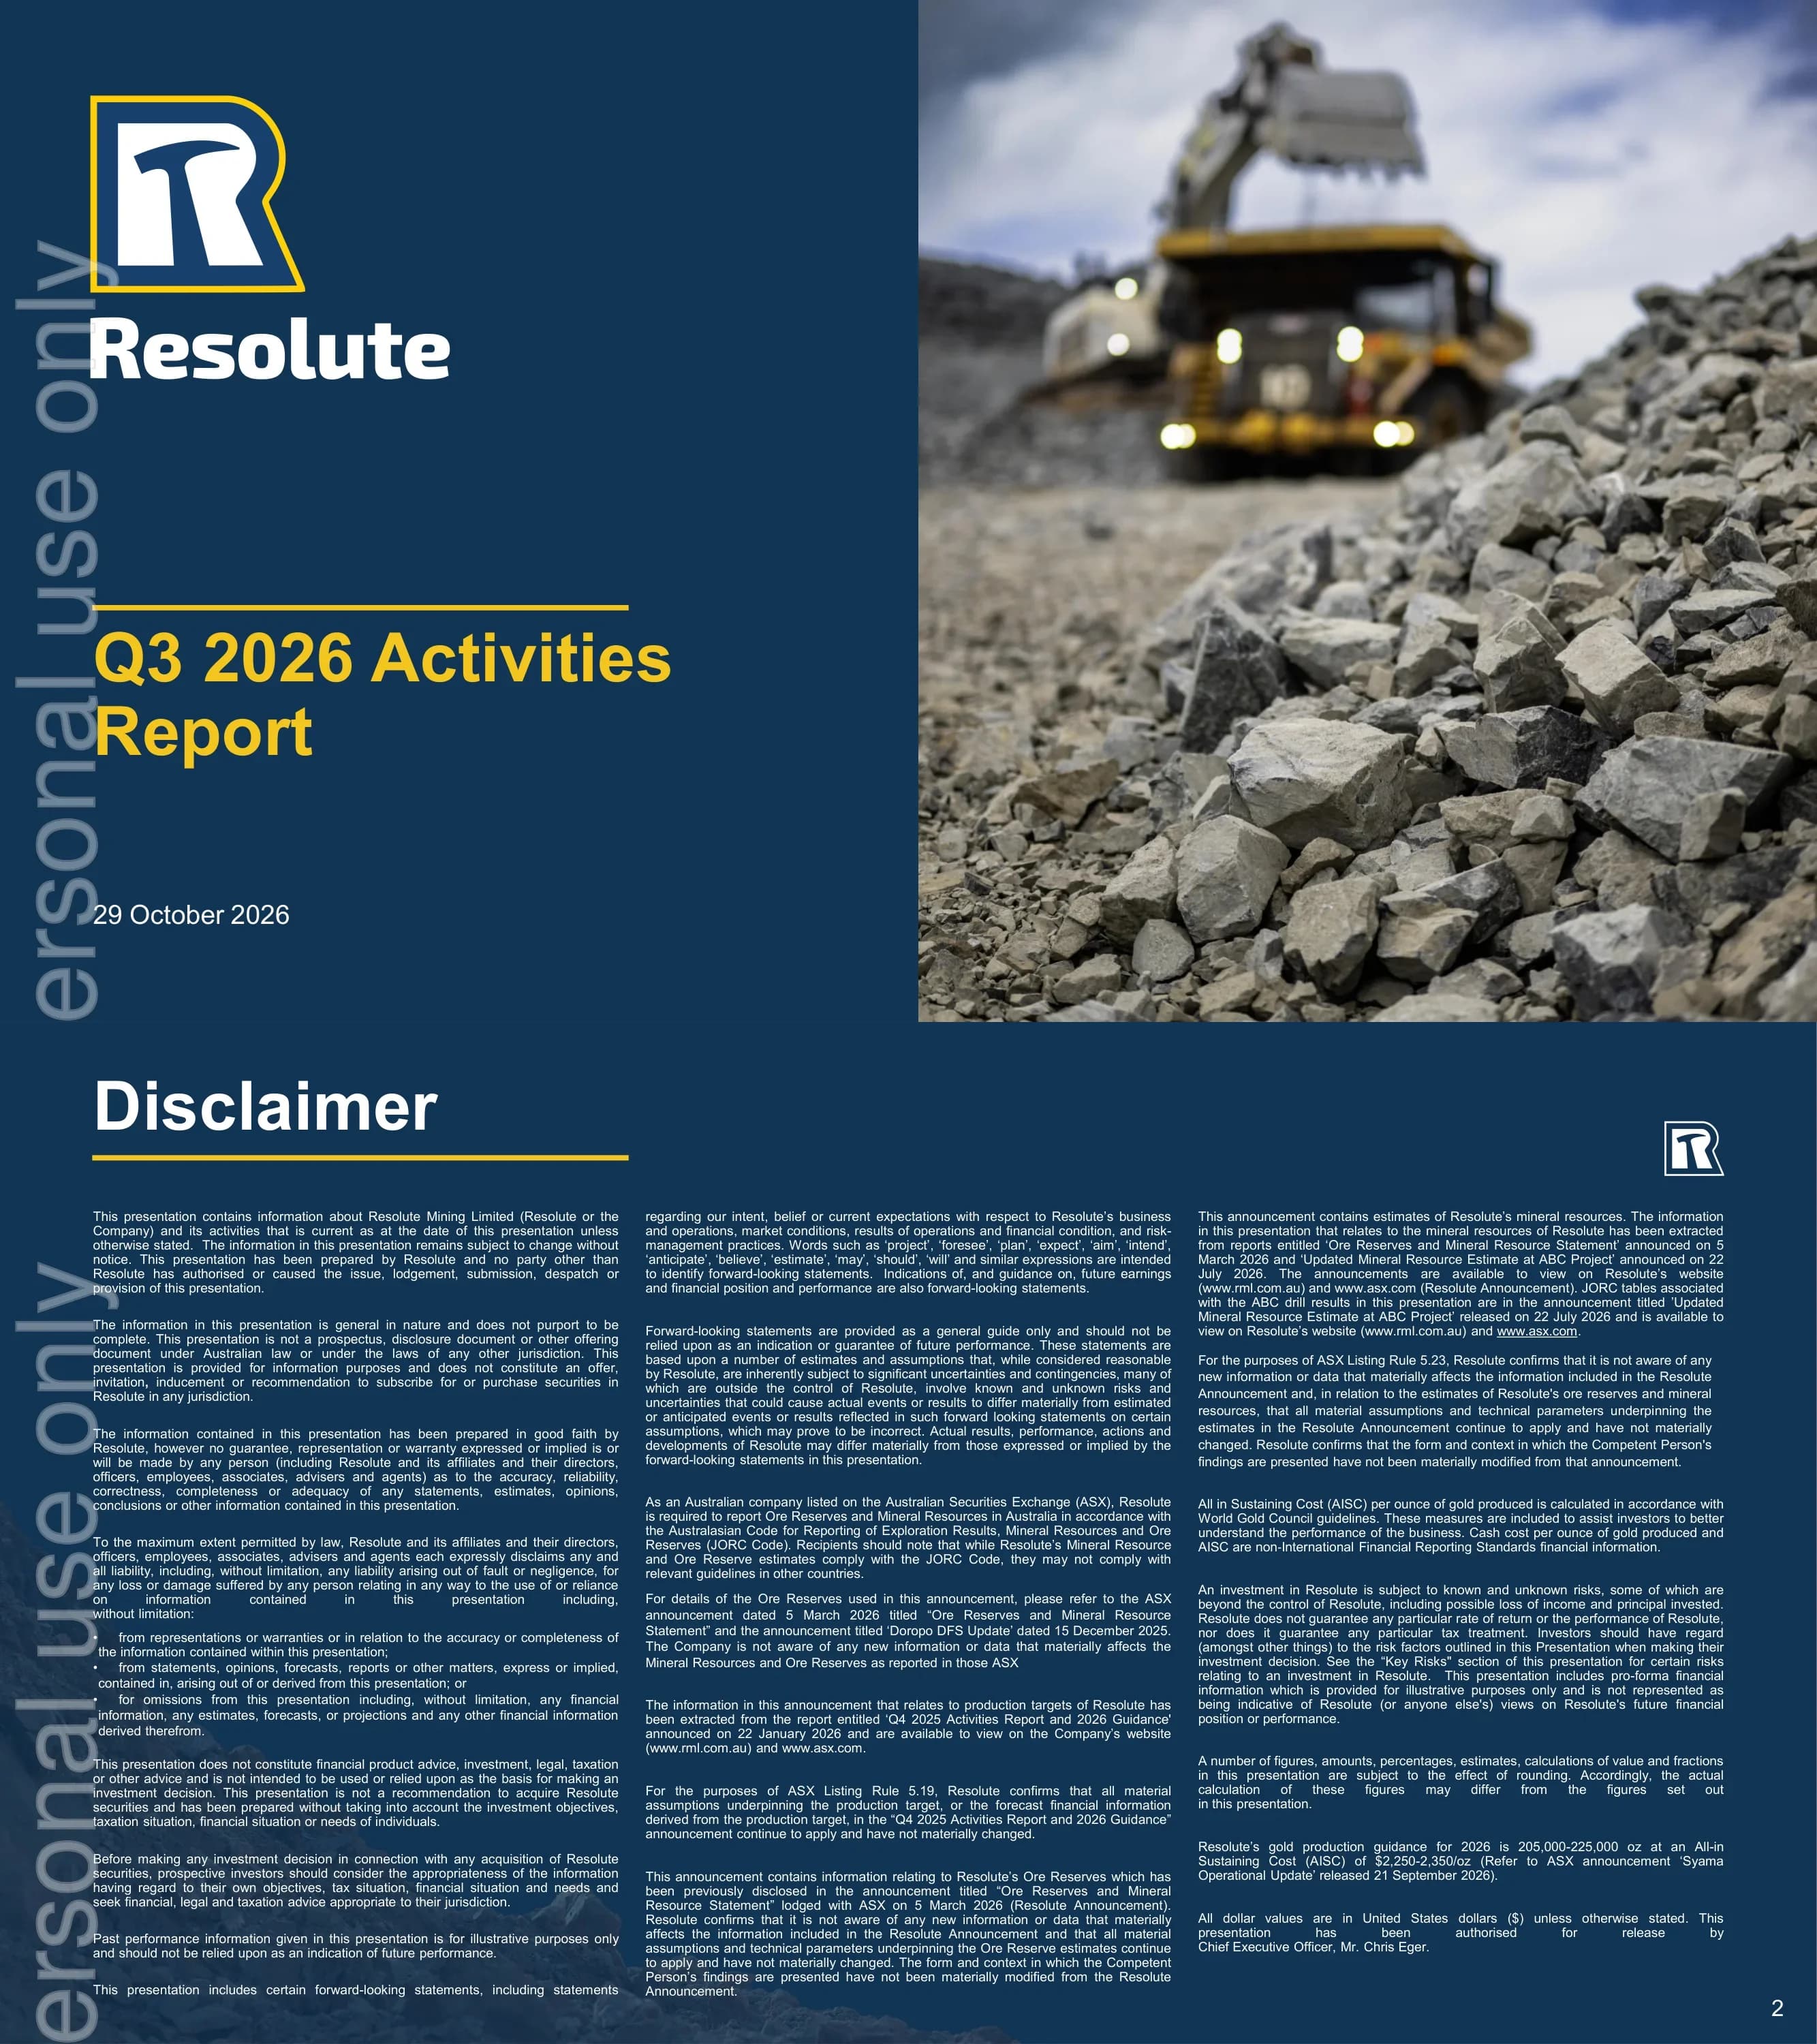
Resolute Mining Q3 2026 Activities Presentation
25 slides
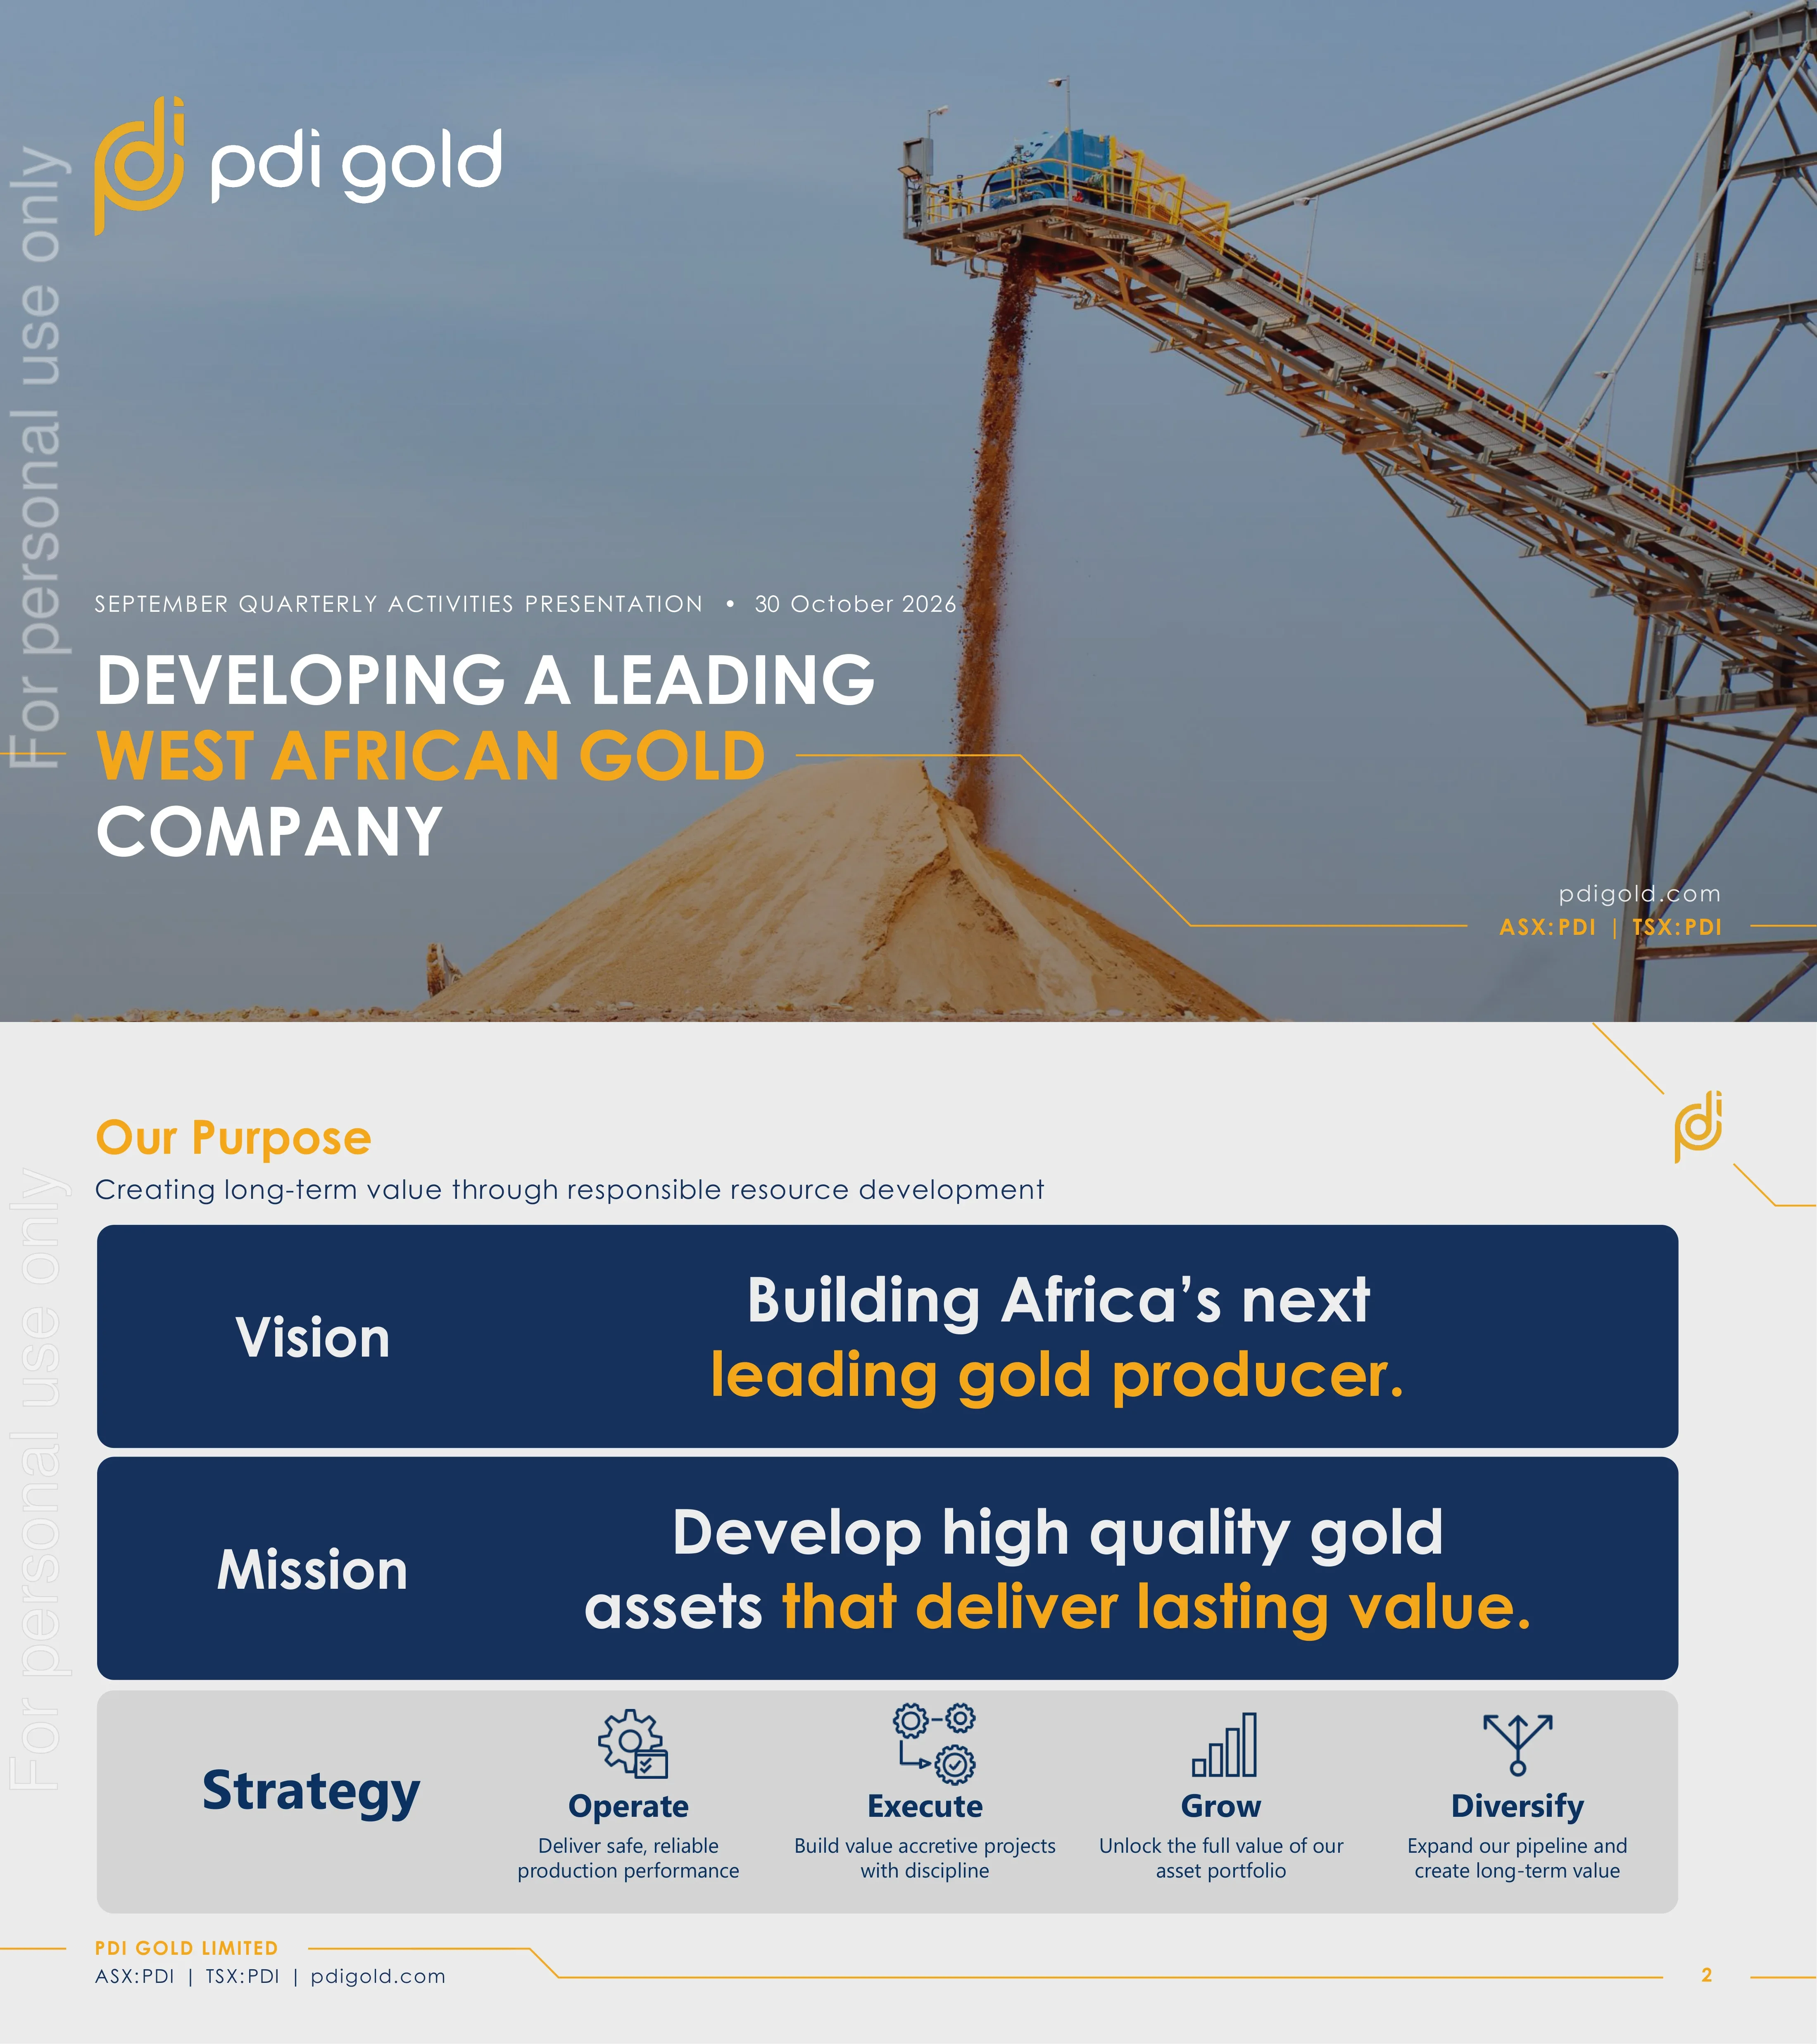
Predictive Discovery September 2026 Quarterly Activities Presentation
16 slides
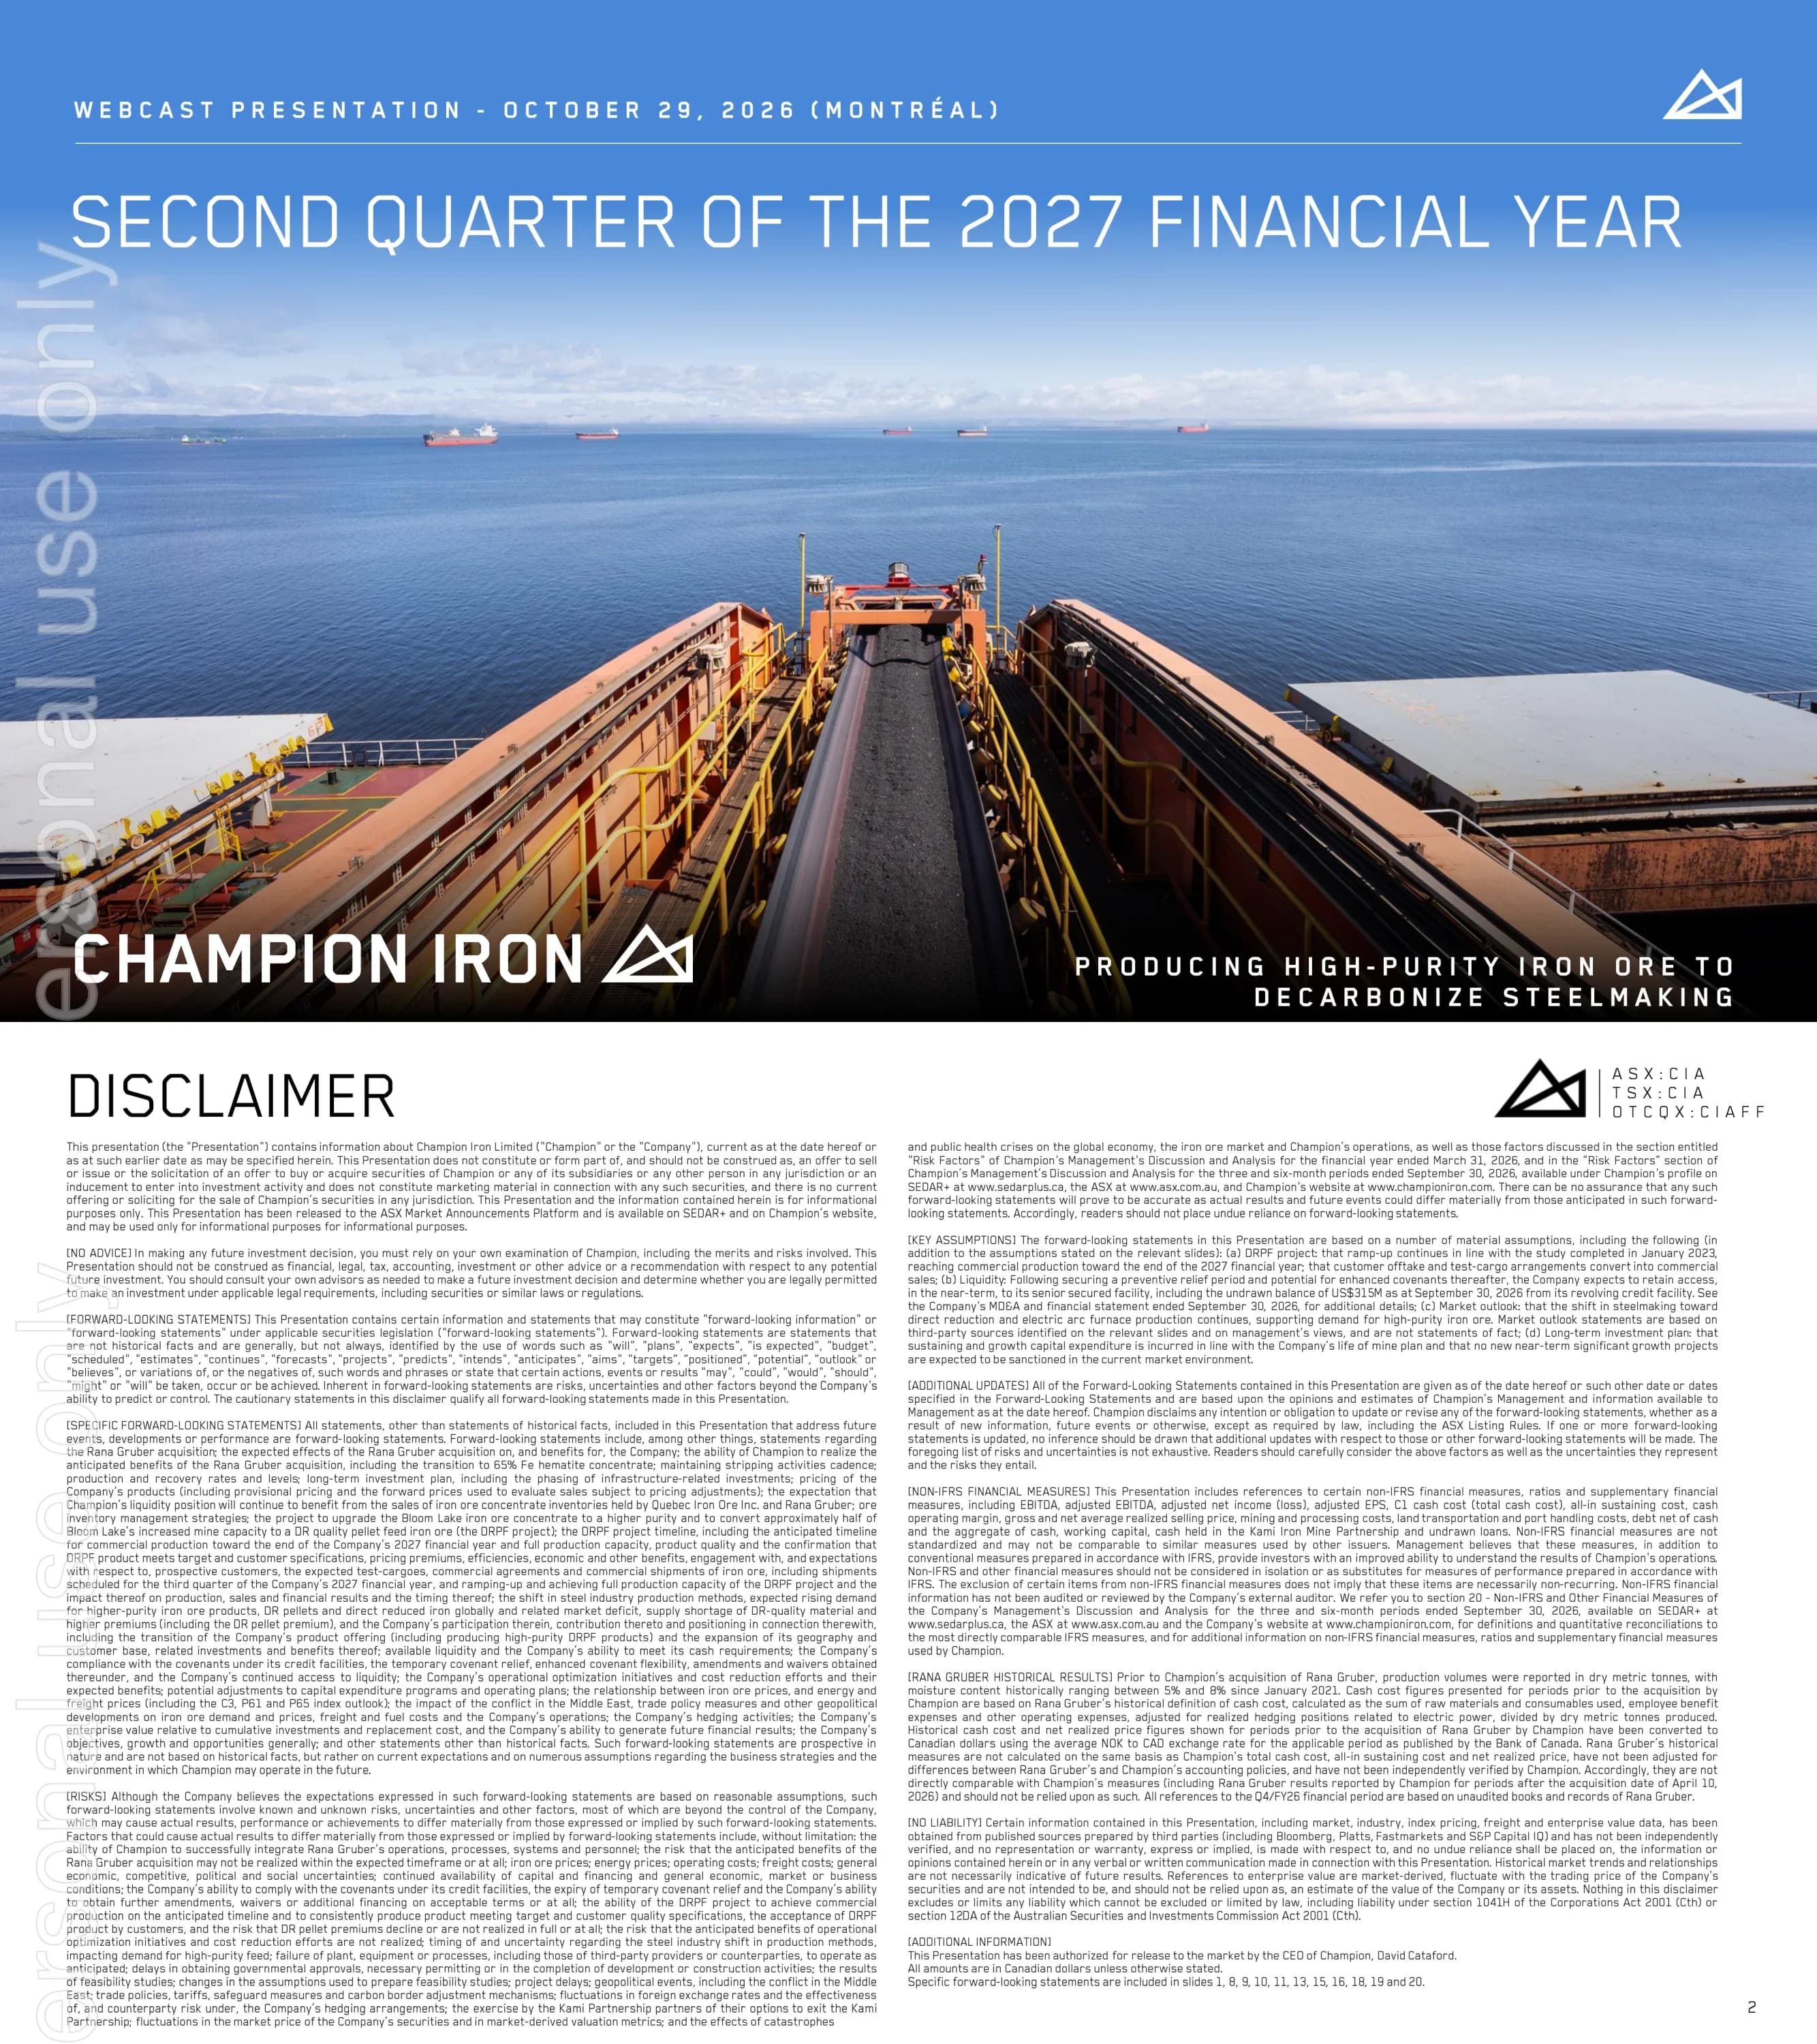
Champion Iron Q2 FY2027 Results Presentation
22 slides
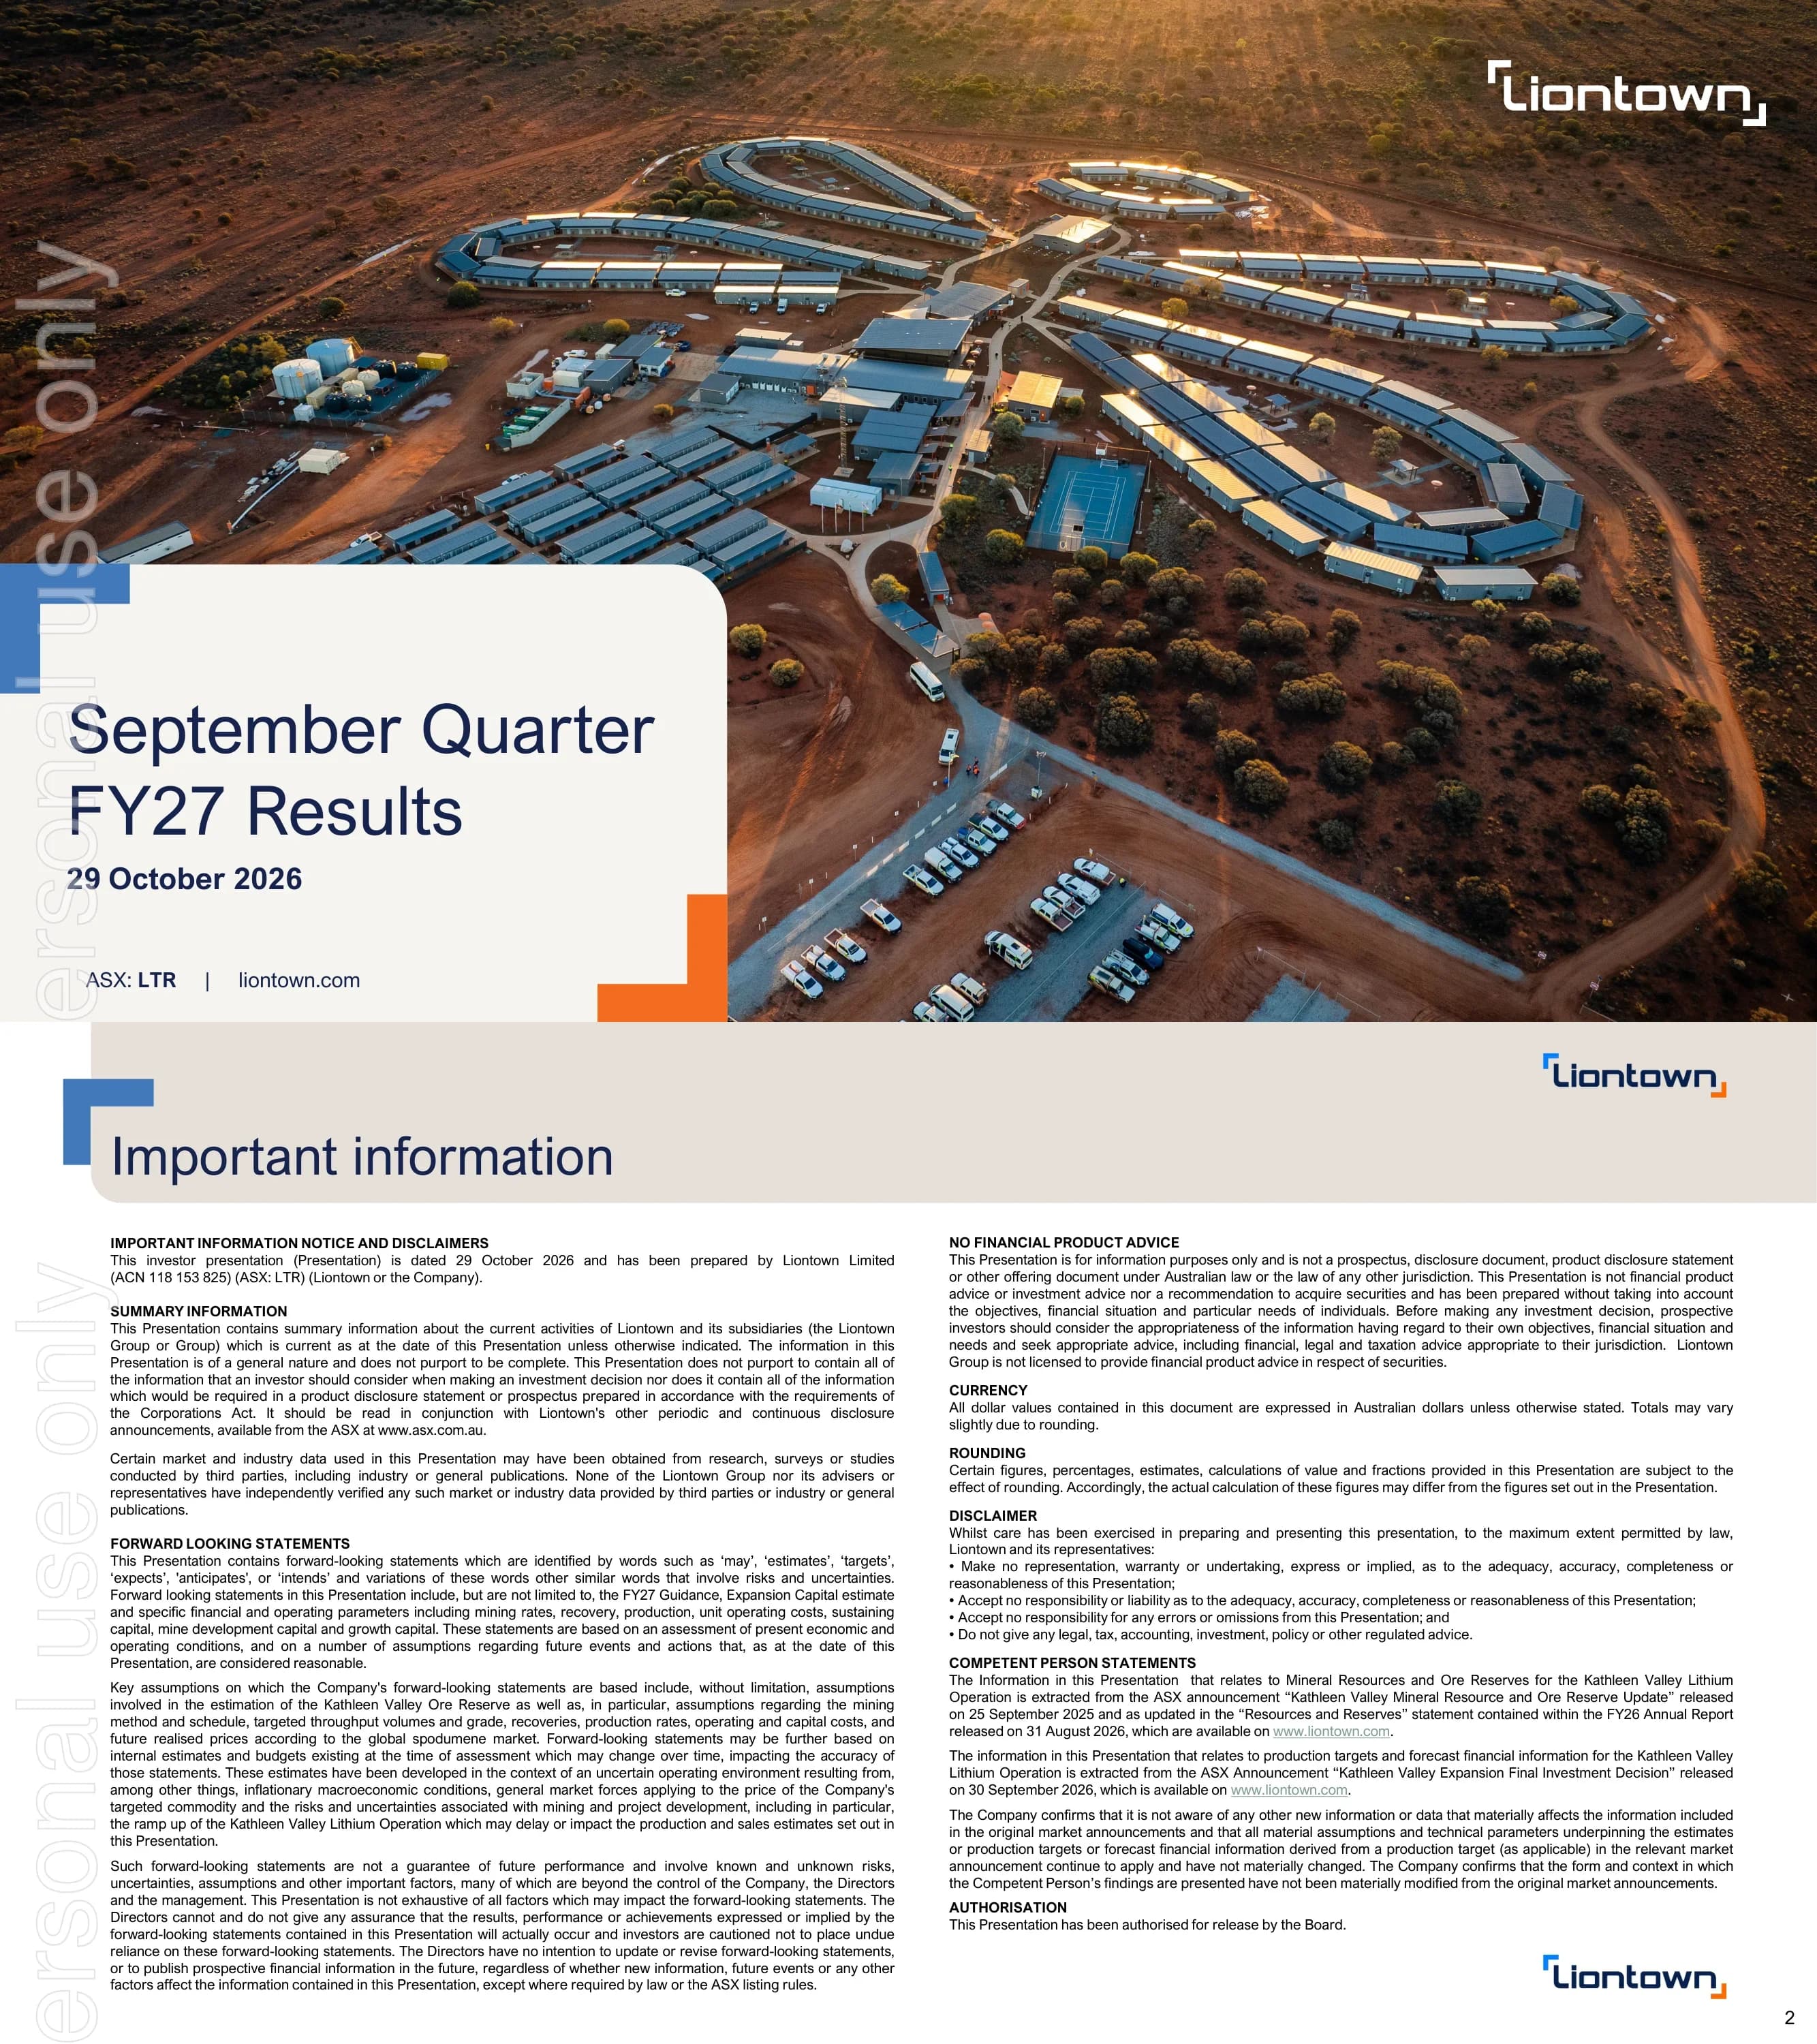
Liontown Resources Q1 FY2027 Results Presentation
27 slides
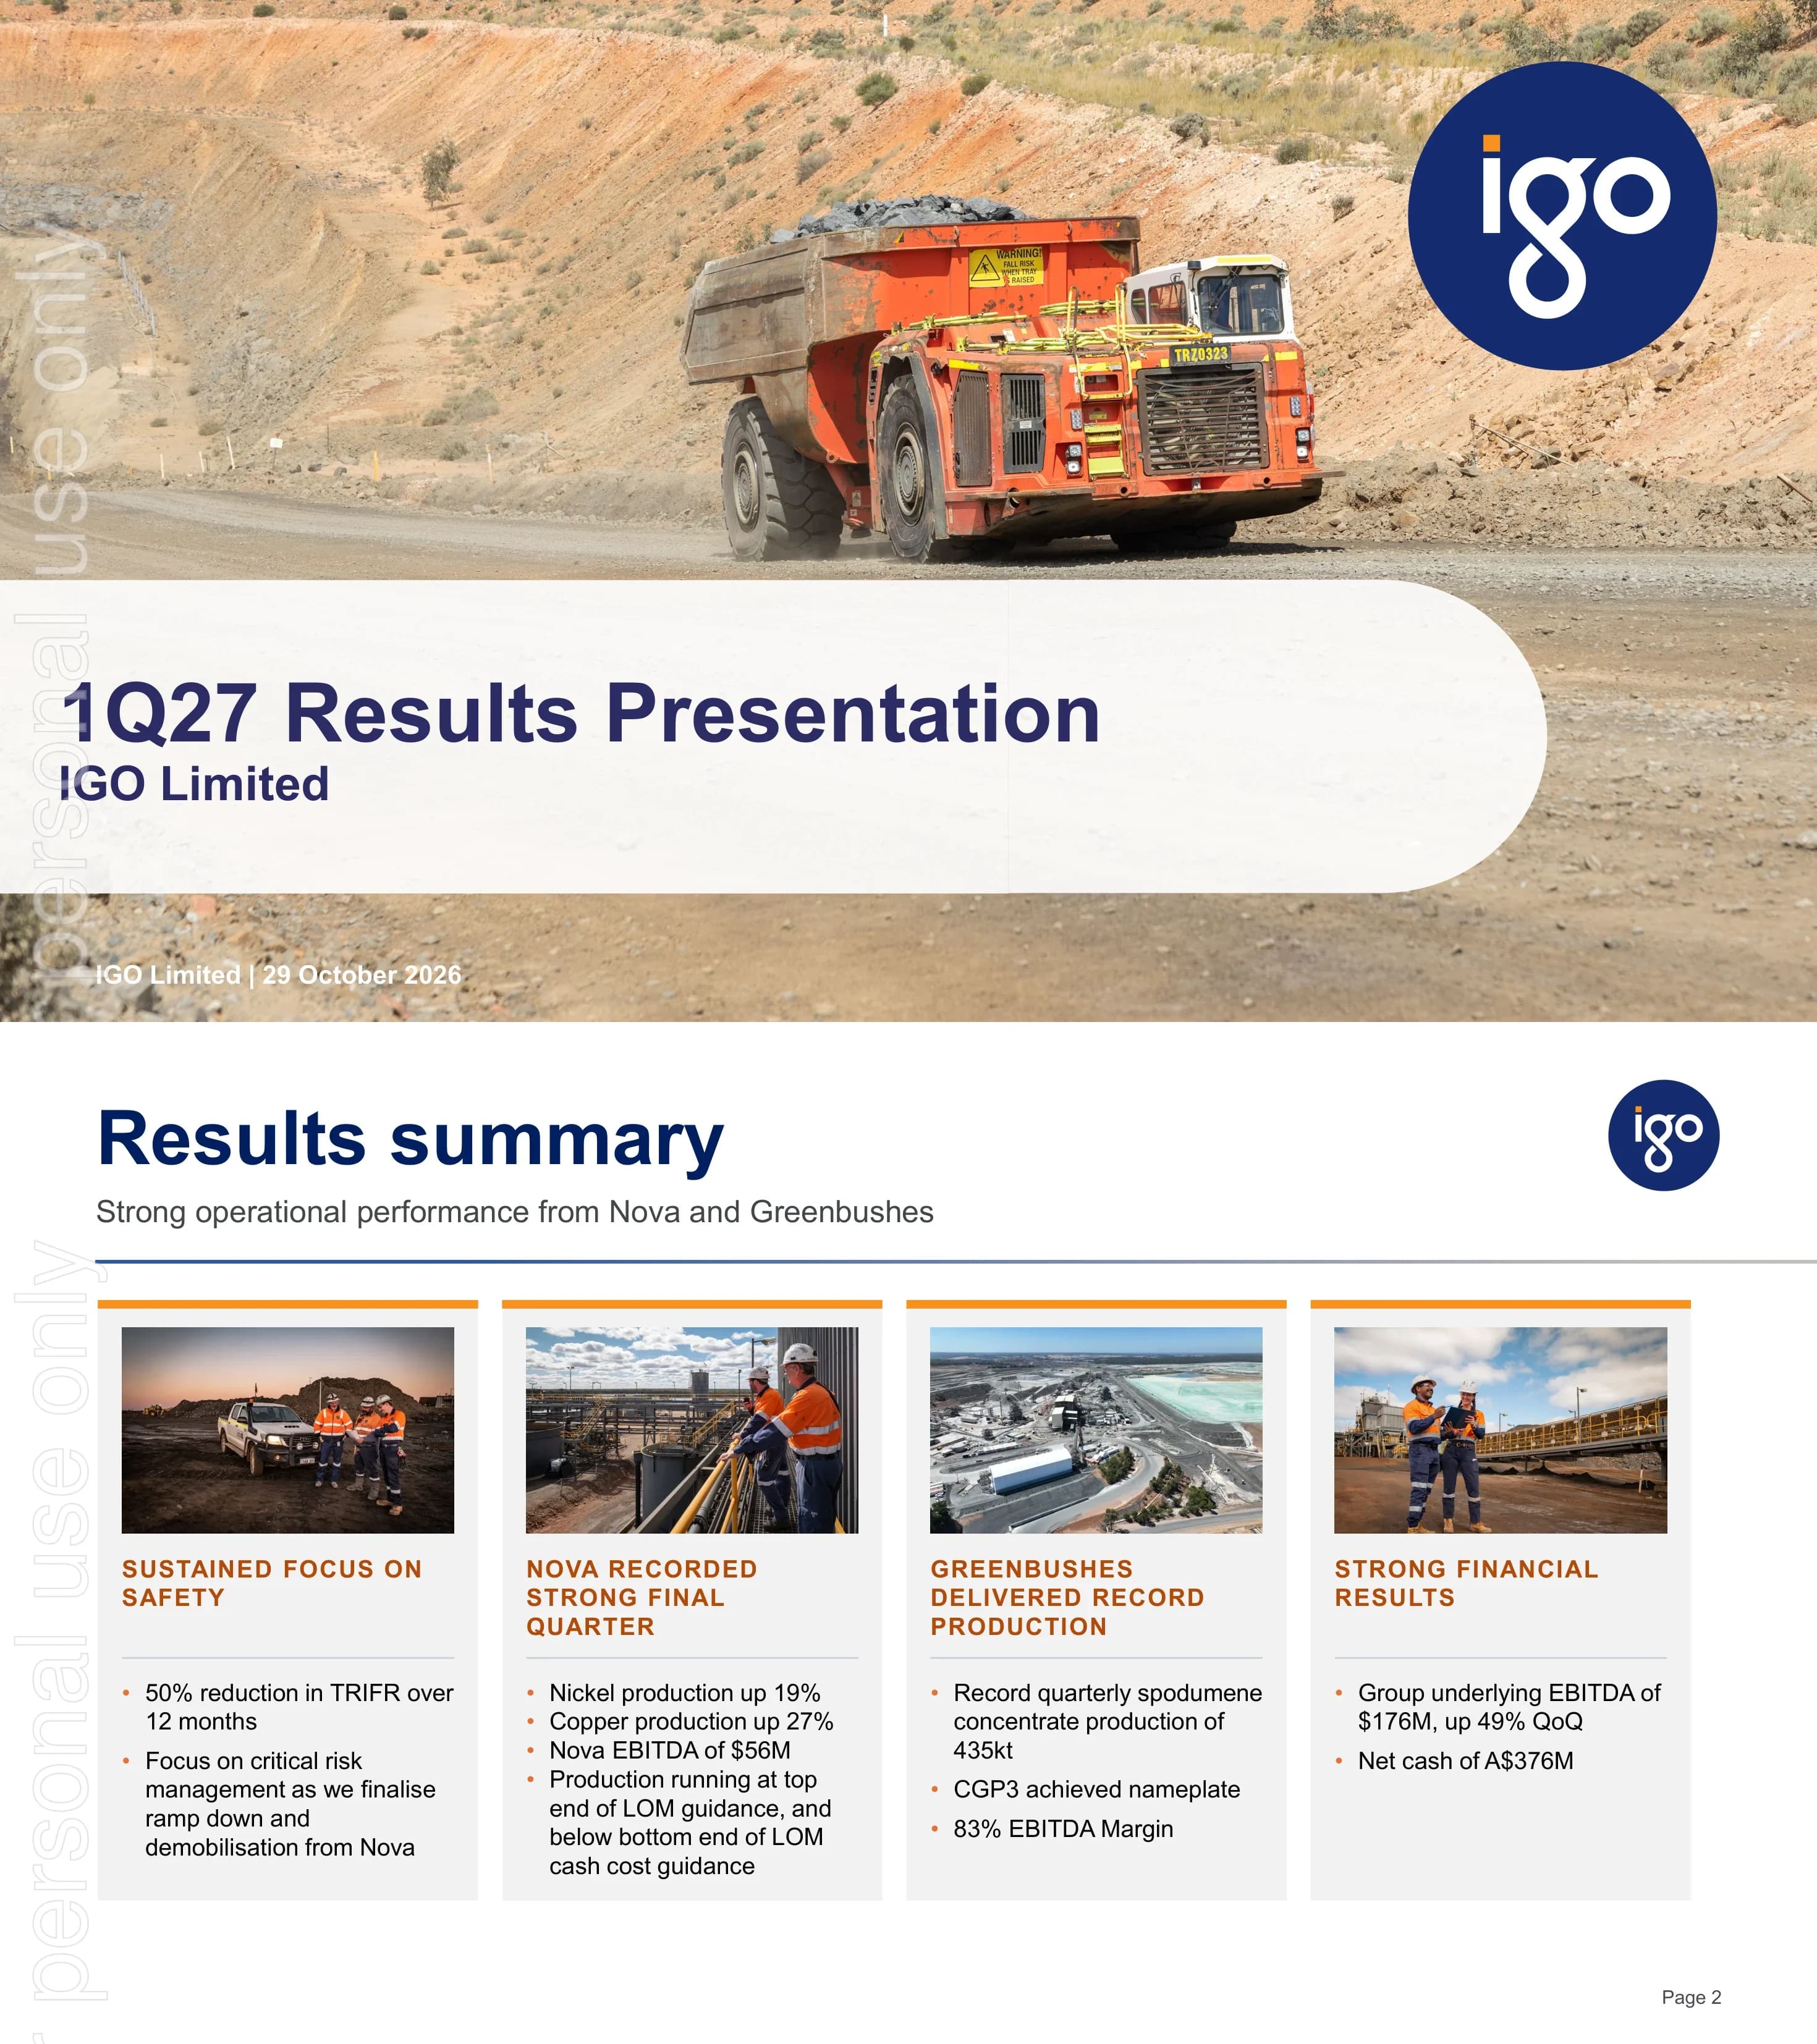
IGO Q1 FY2027 Results Presentation
15 slides
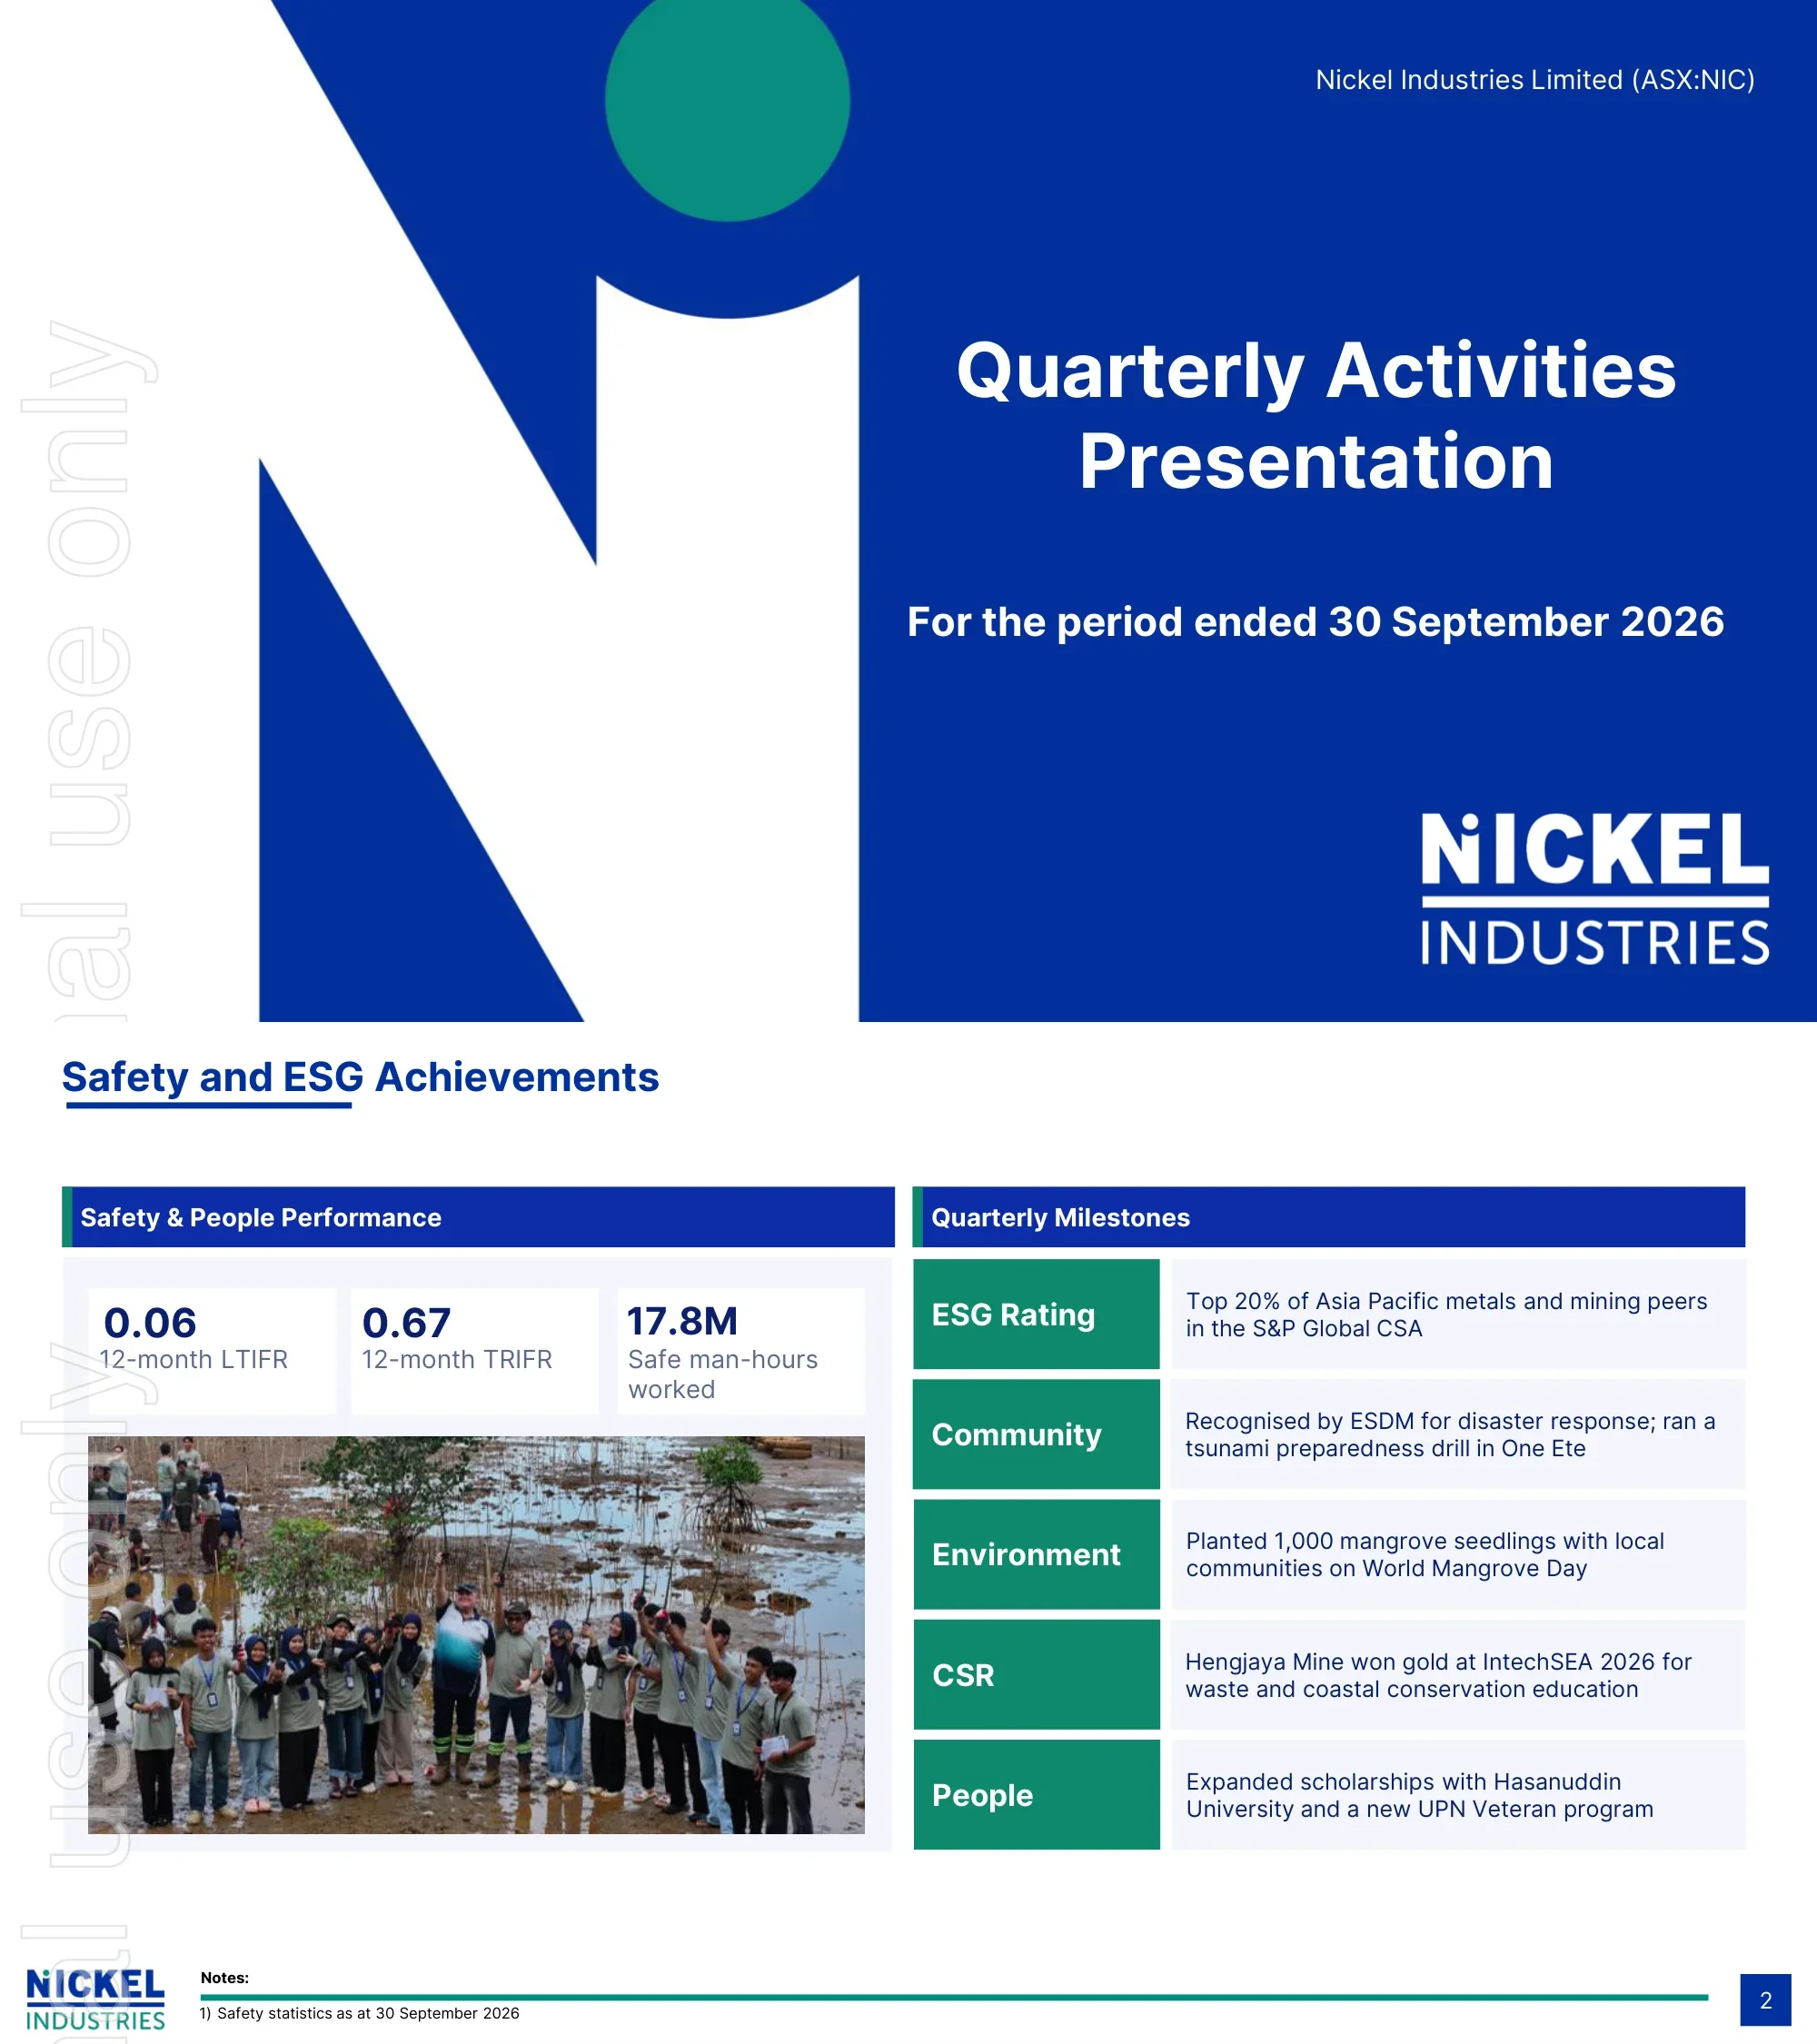
Nickel Industries September 2026 Quarterly Activities Presentation
11 slides
Alkane Resources Q1 FY2027 Earnings Presentation
25 slides
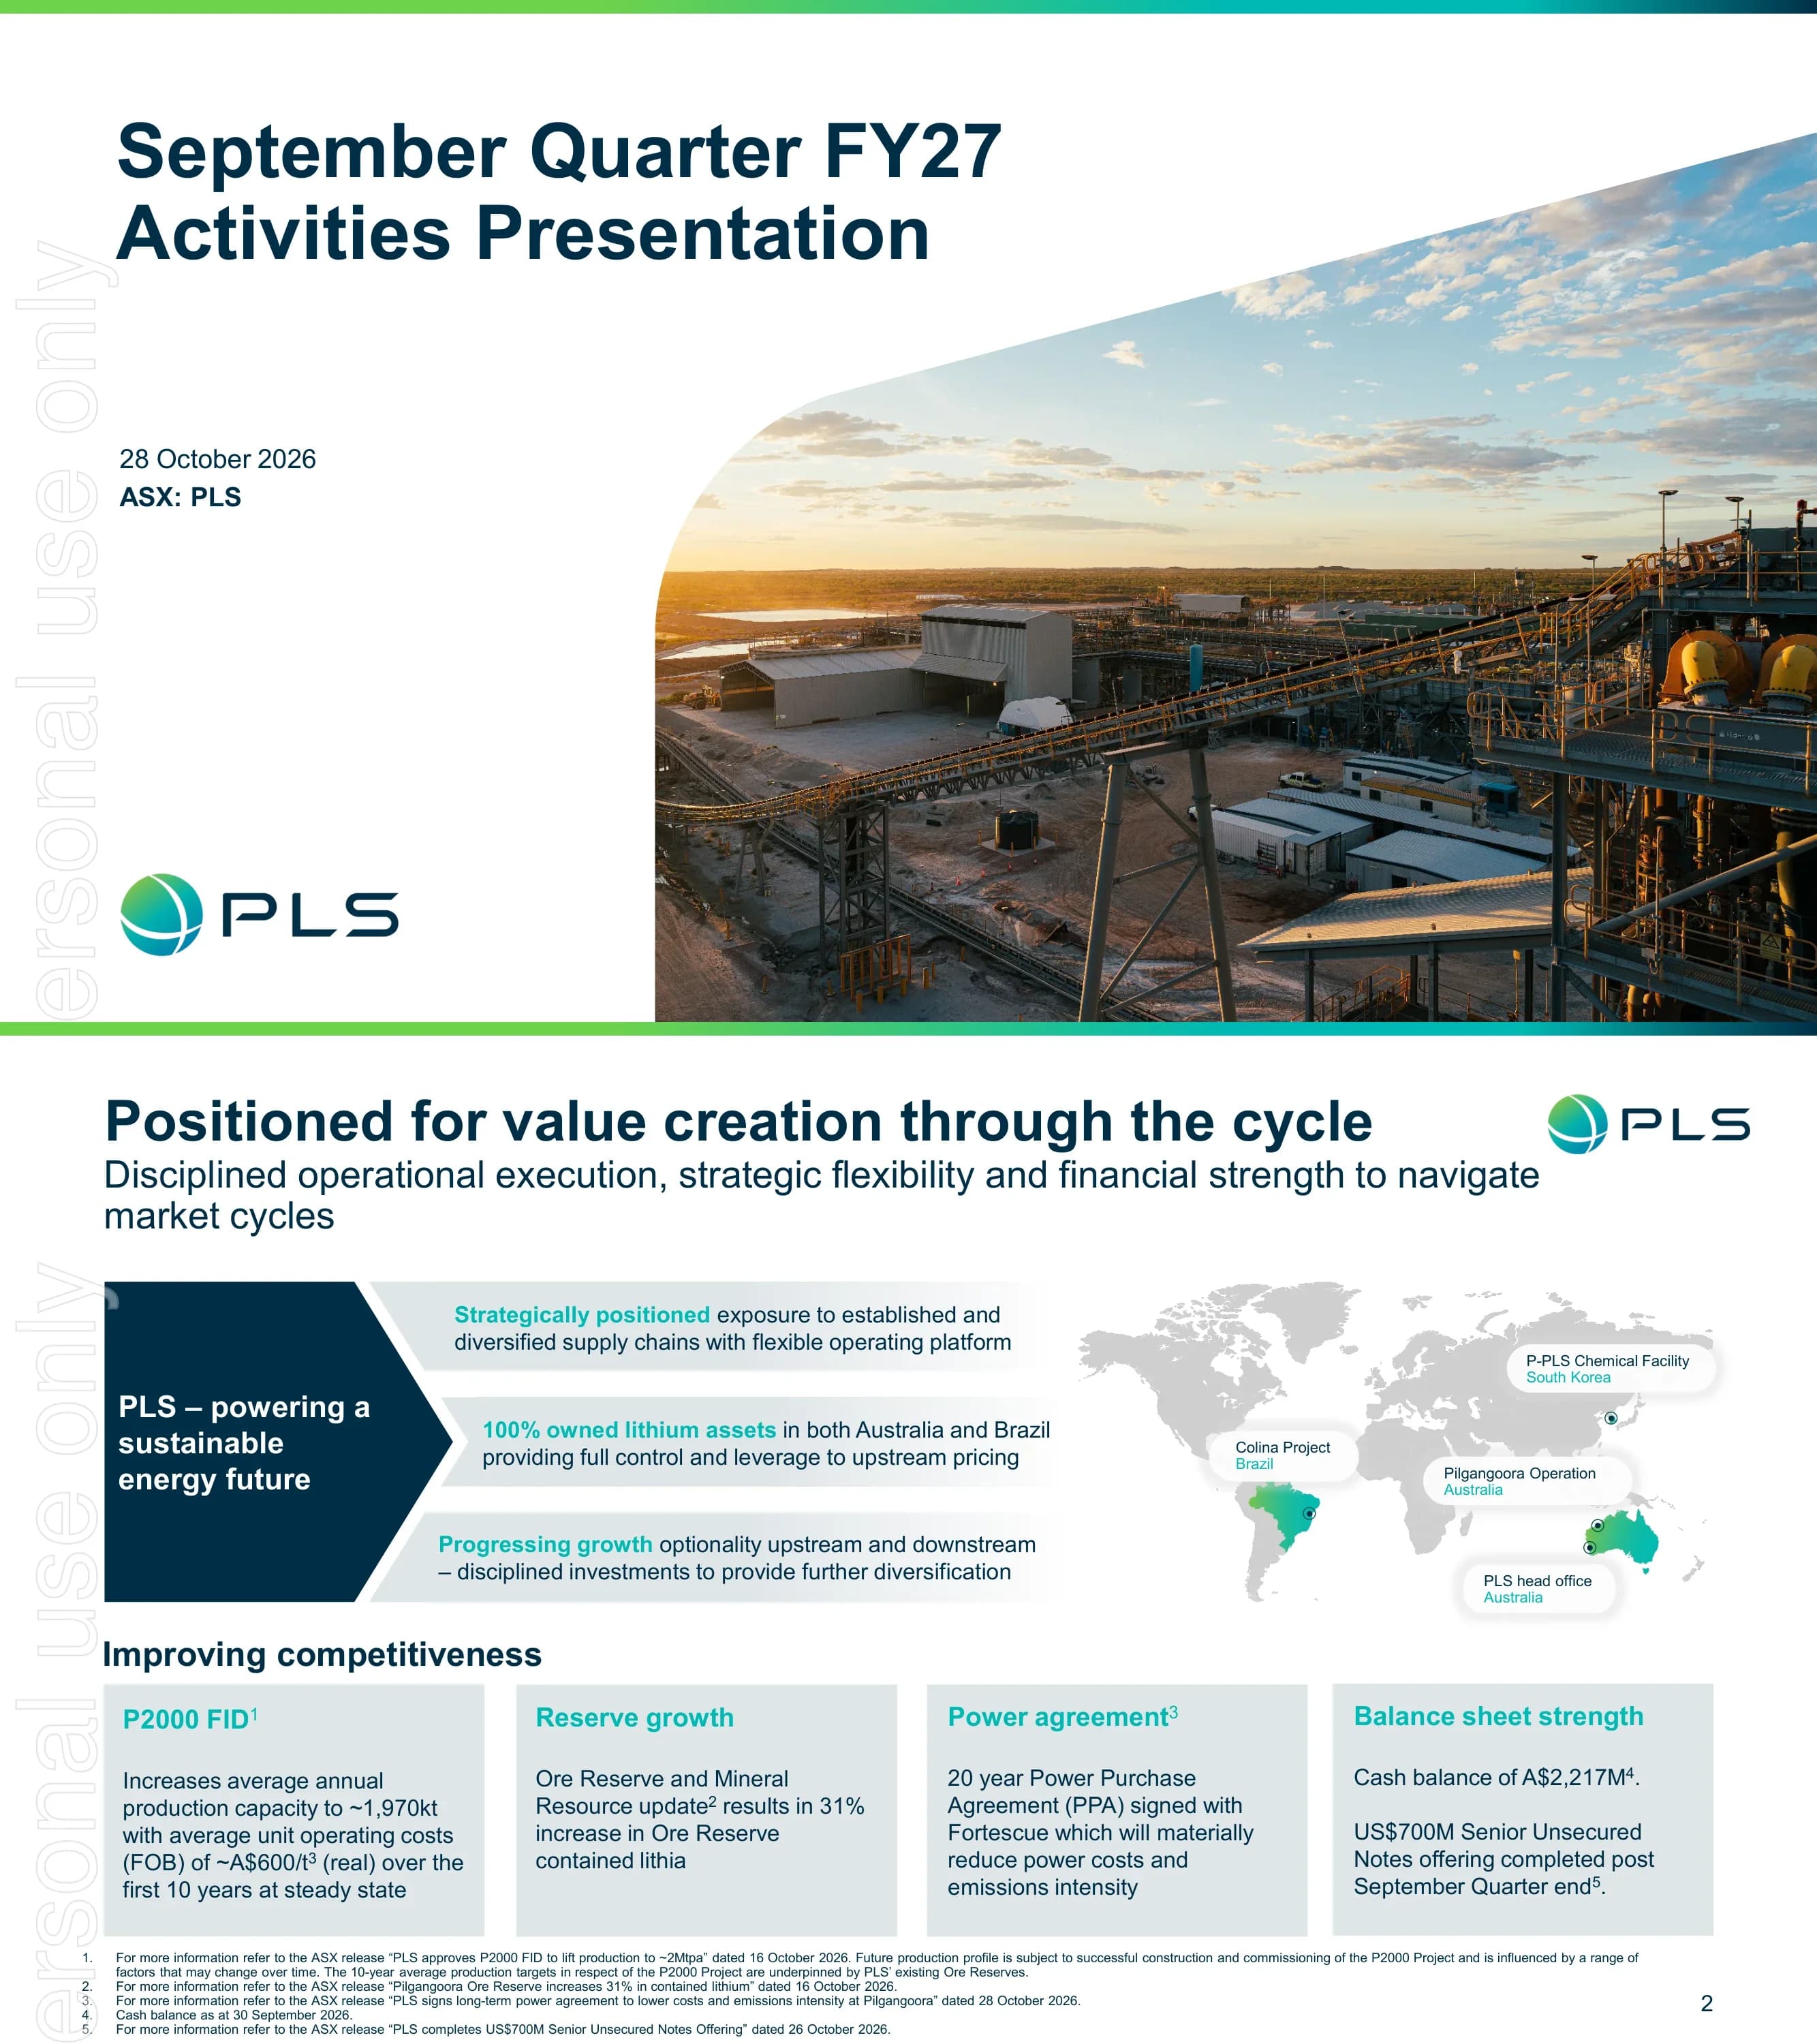
PLS Group September 2026 Quarterly Activities Presentation
29 slides
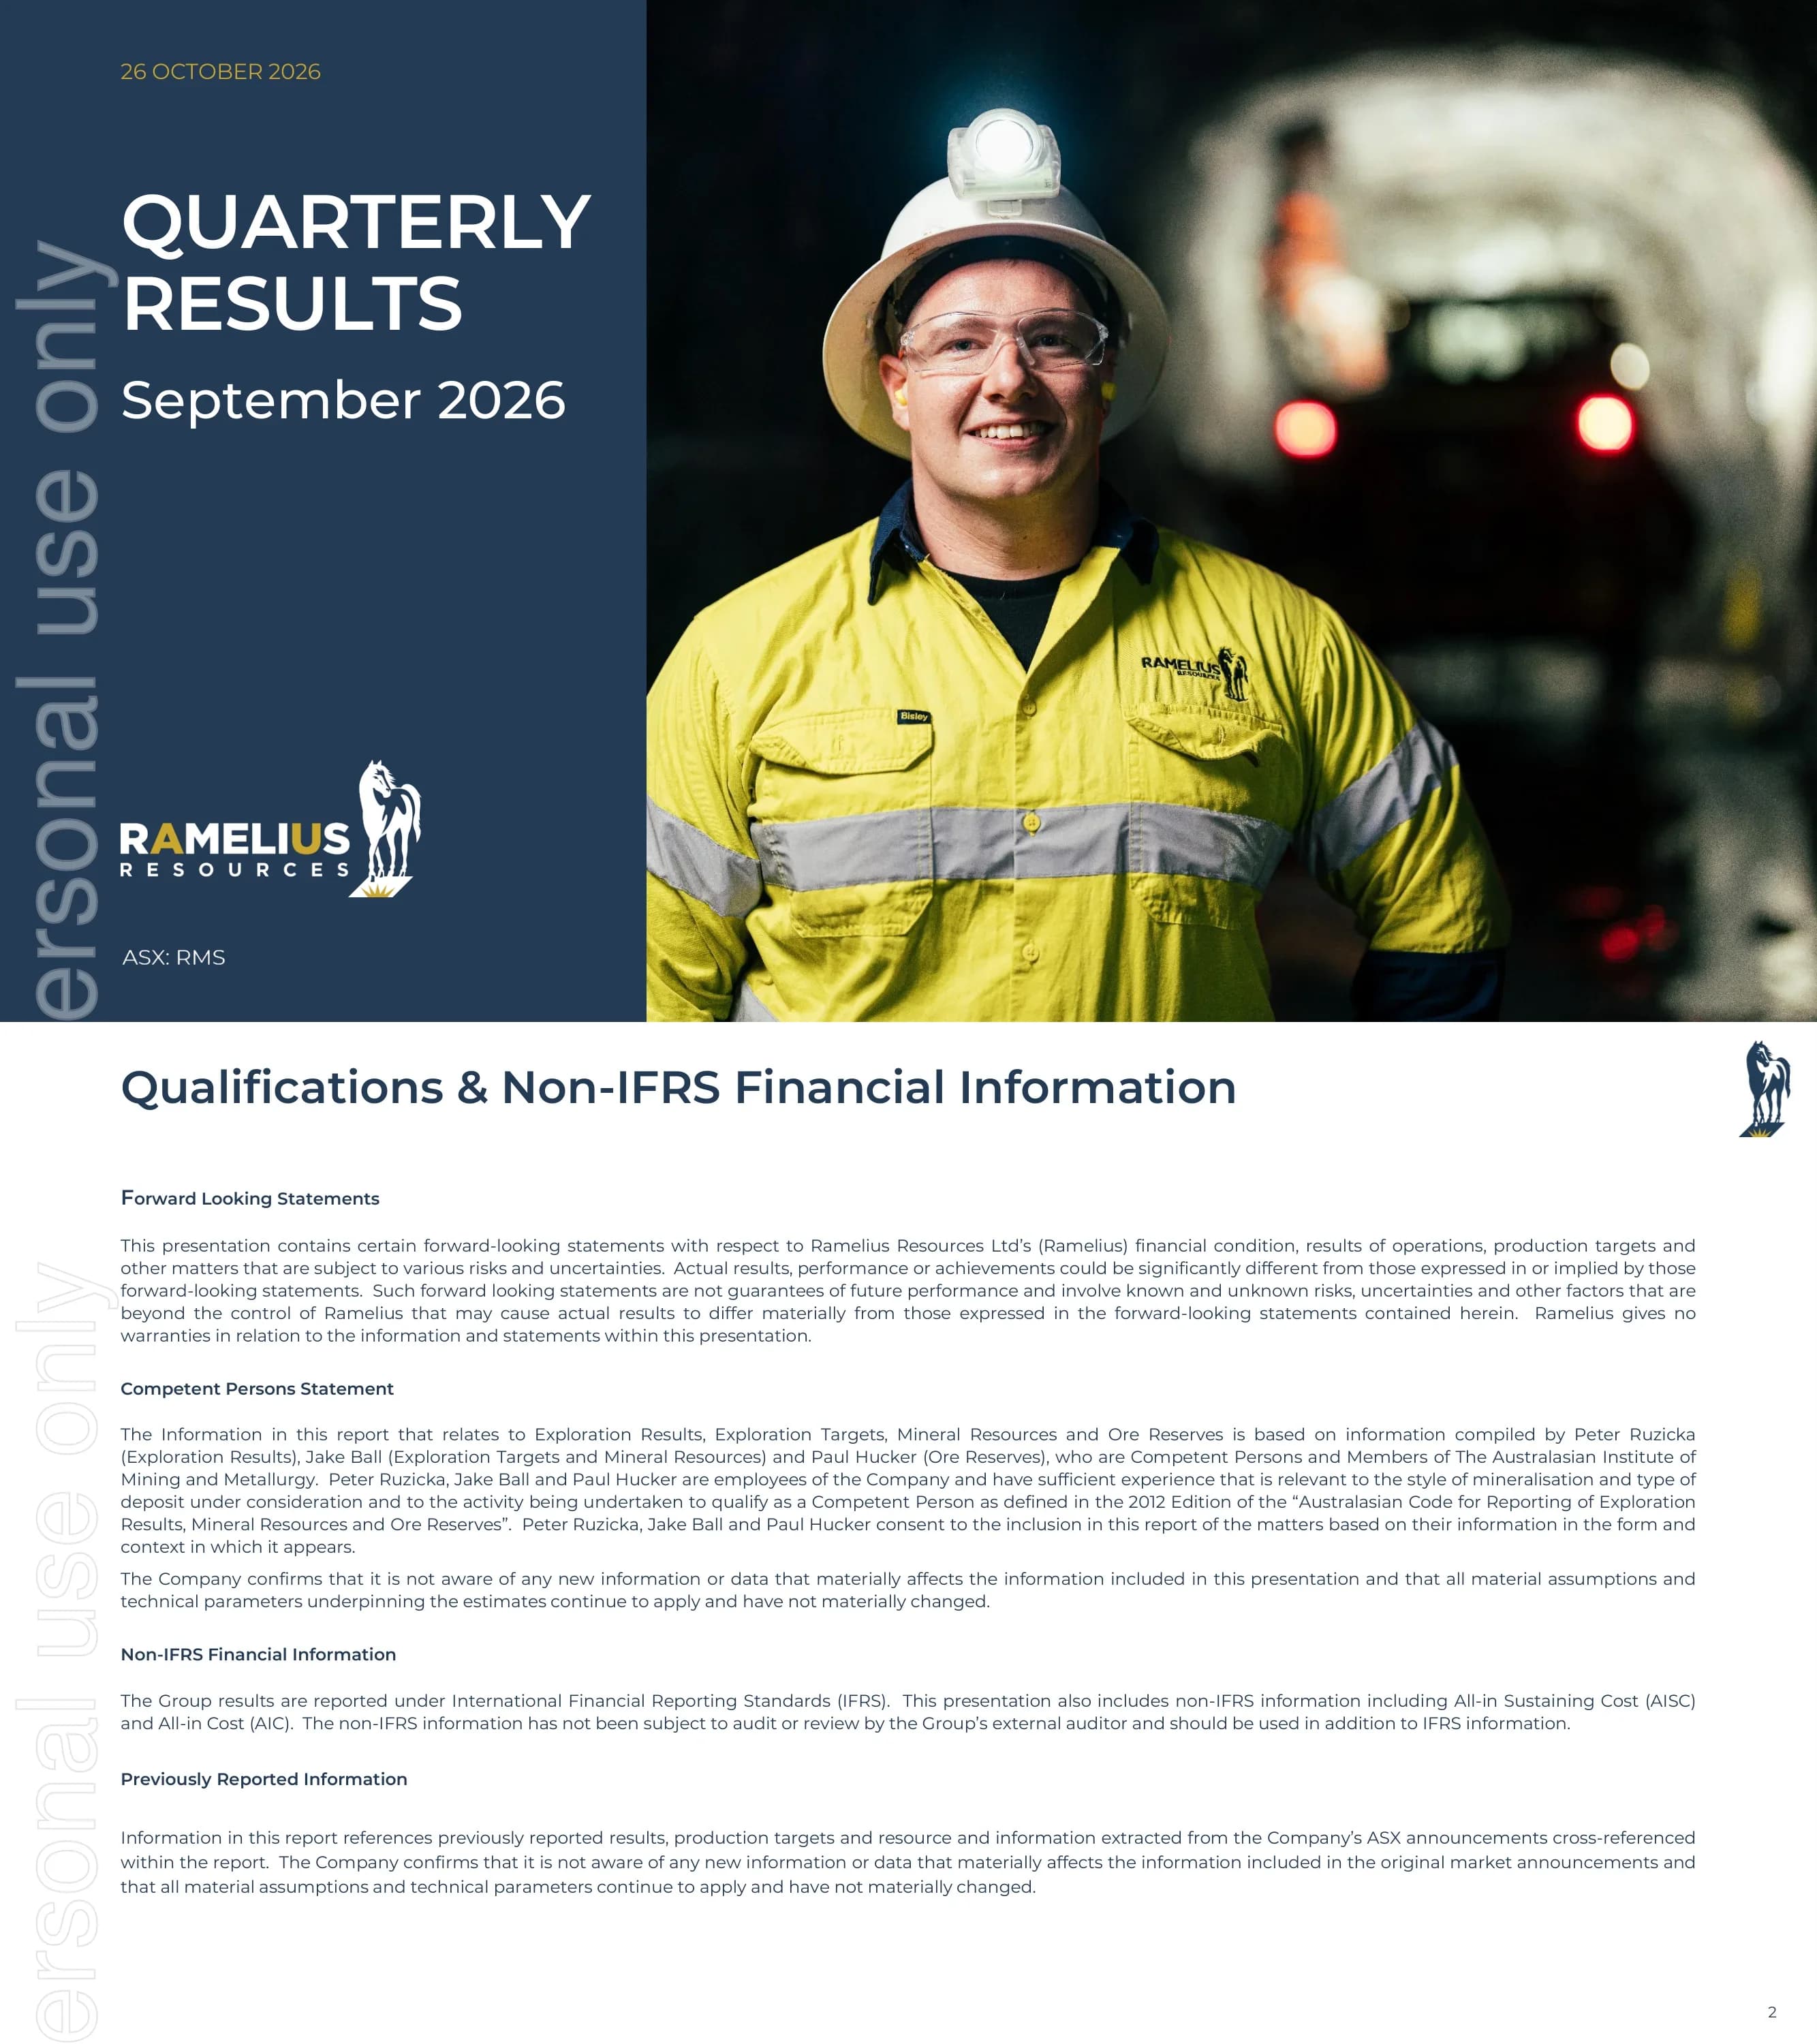
Ramelius Resources September 2026 Quarterly Presentation
14 slides
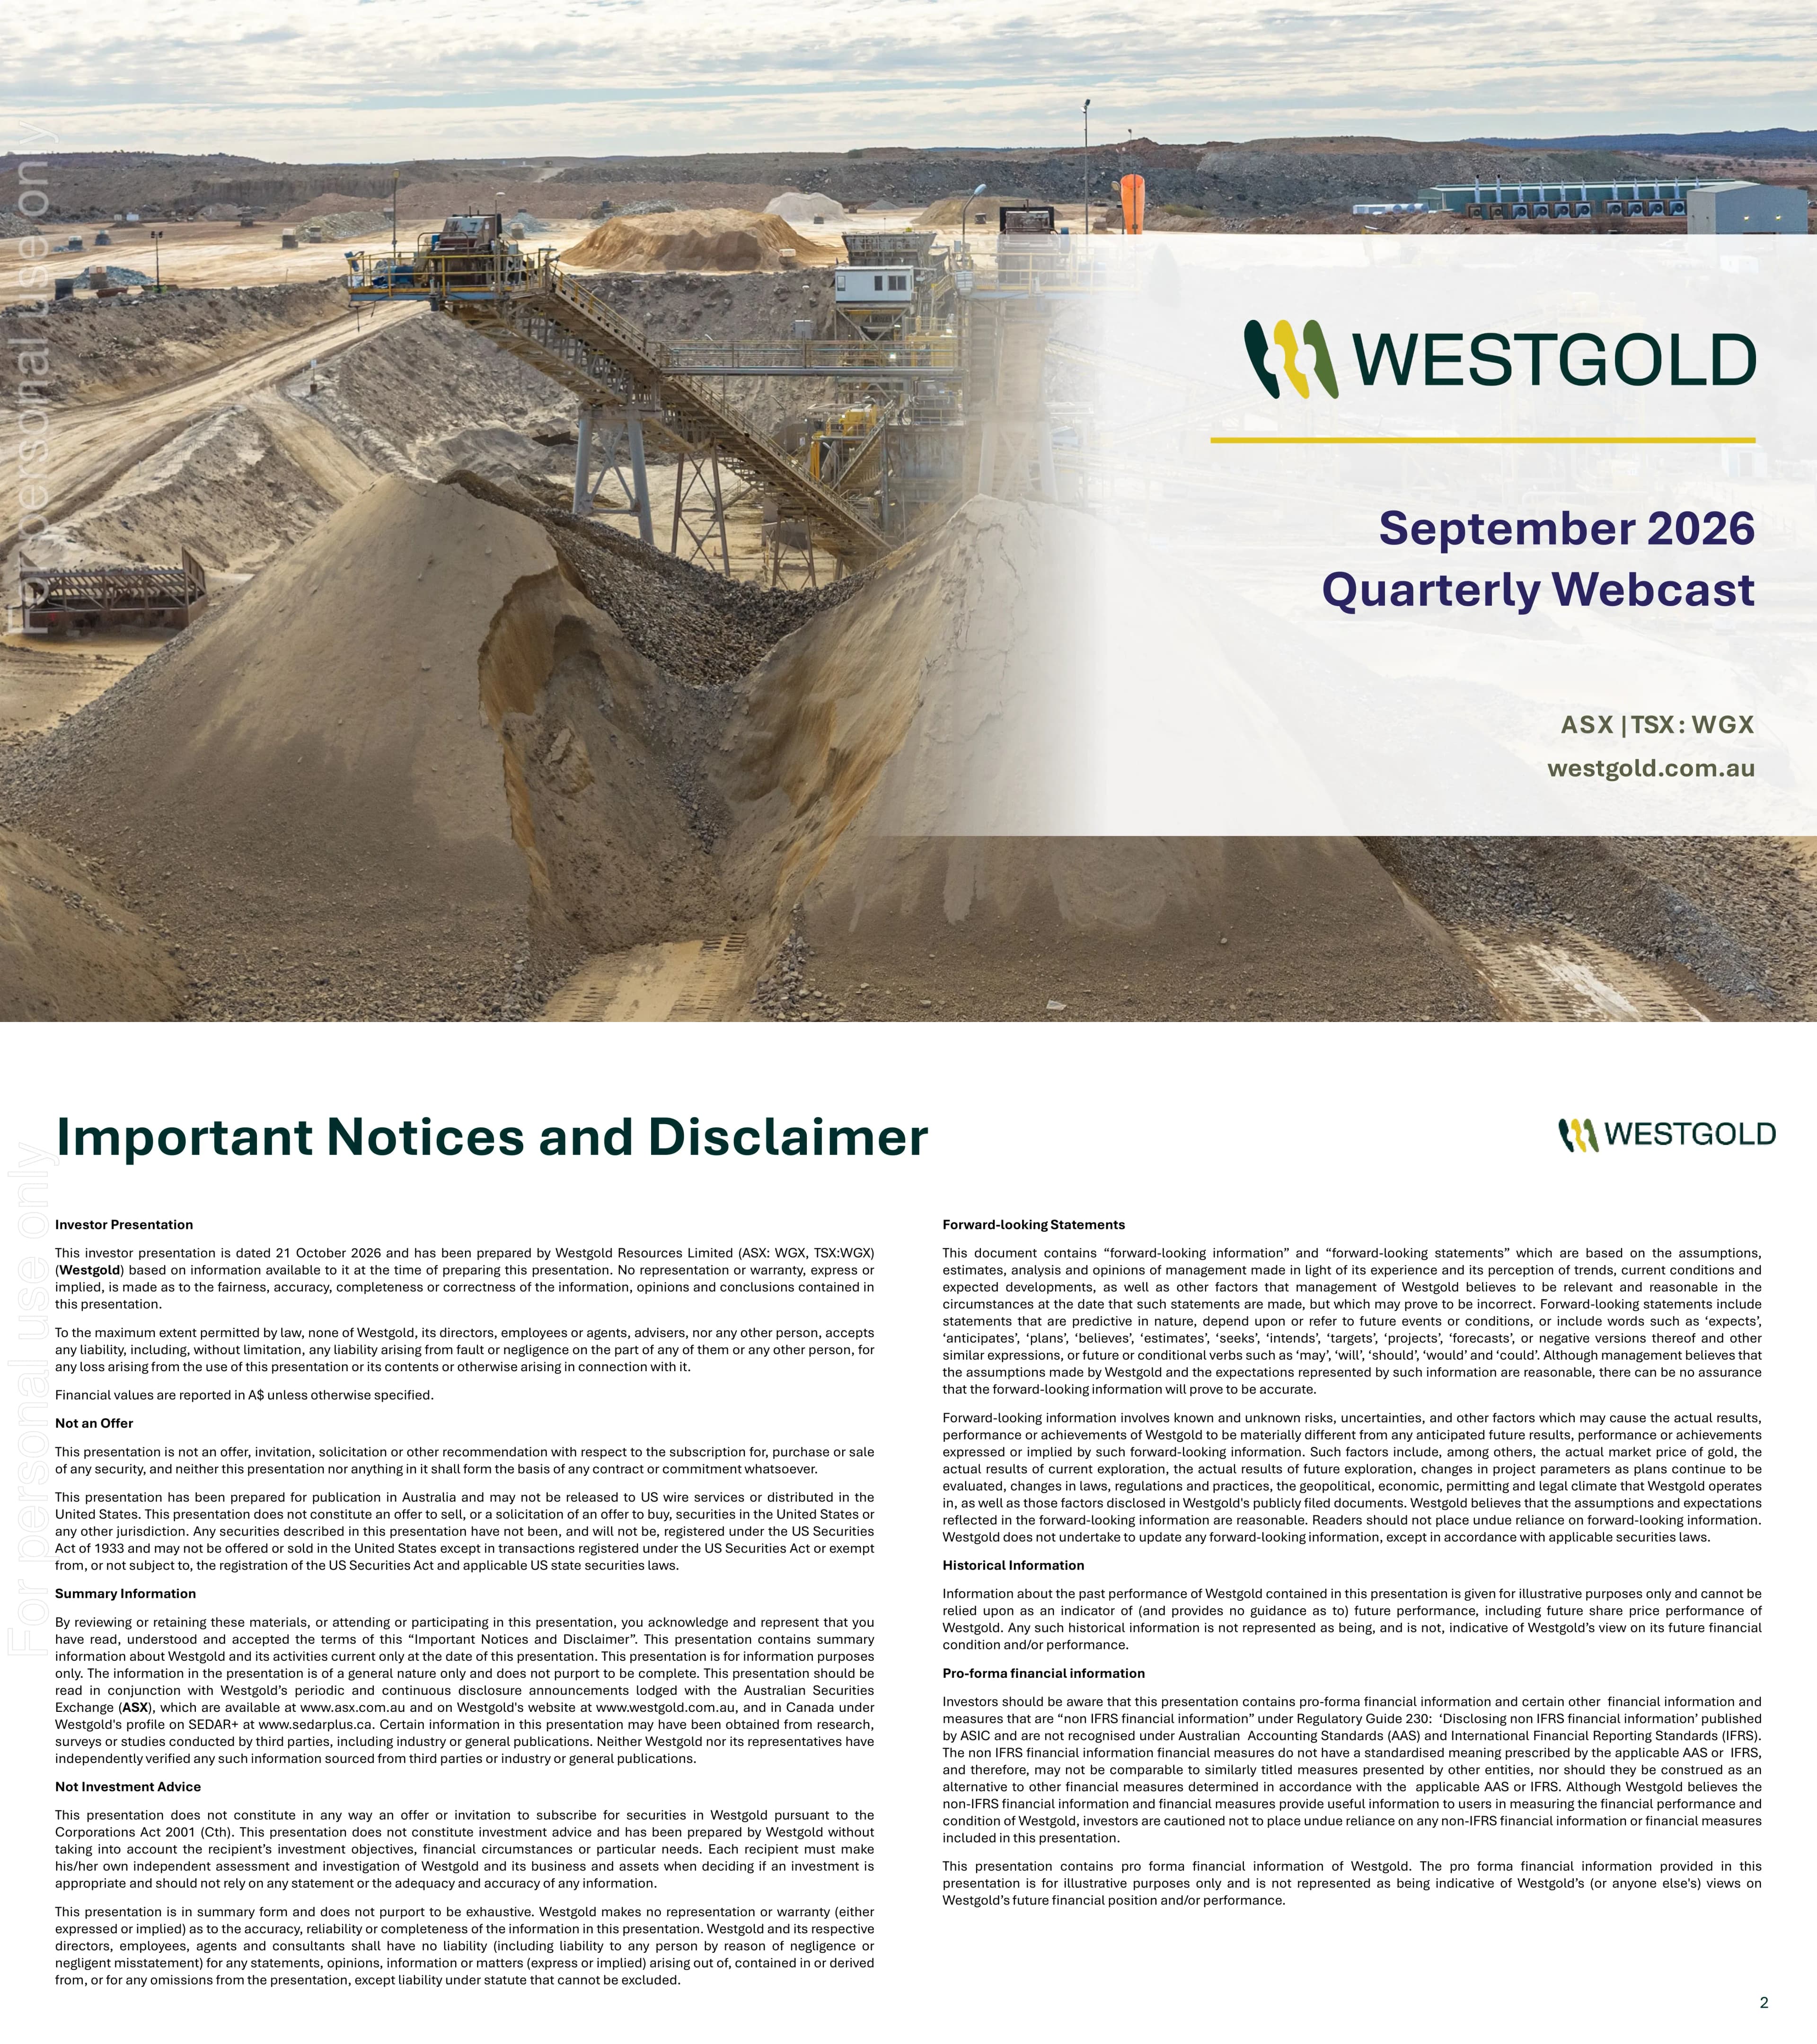
Westgold Resources September 2026 Quarterly Presentation
27 slides
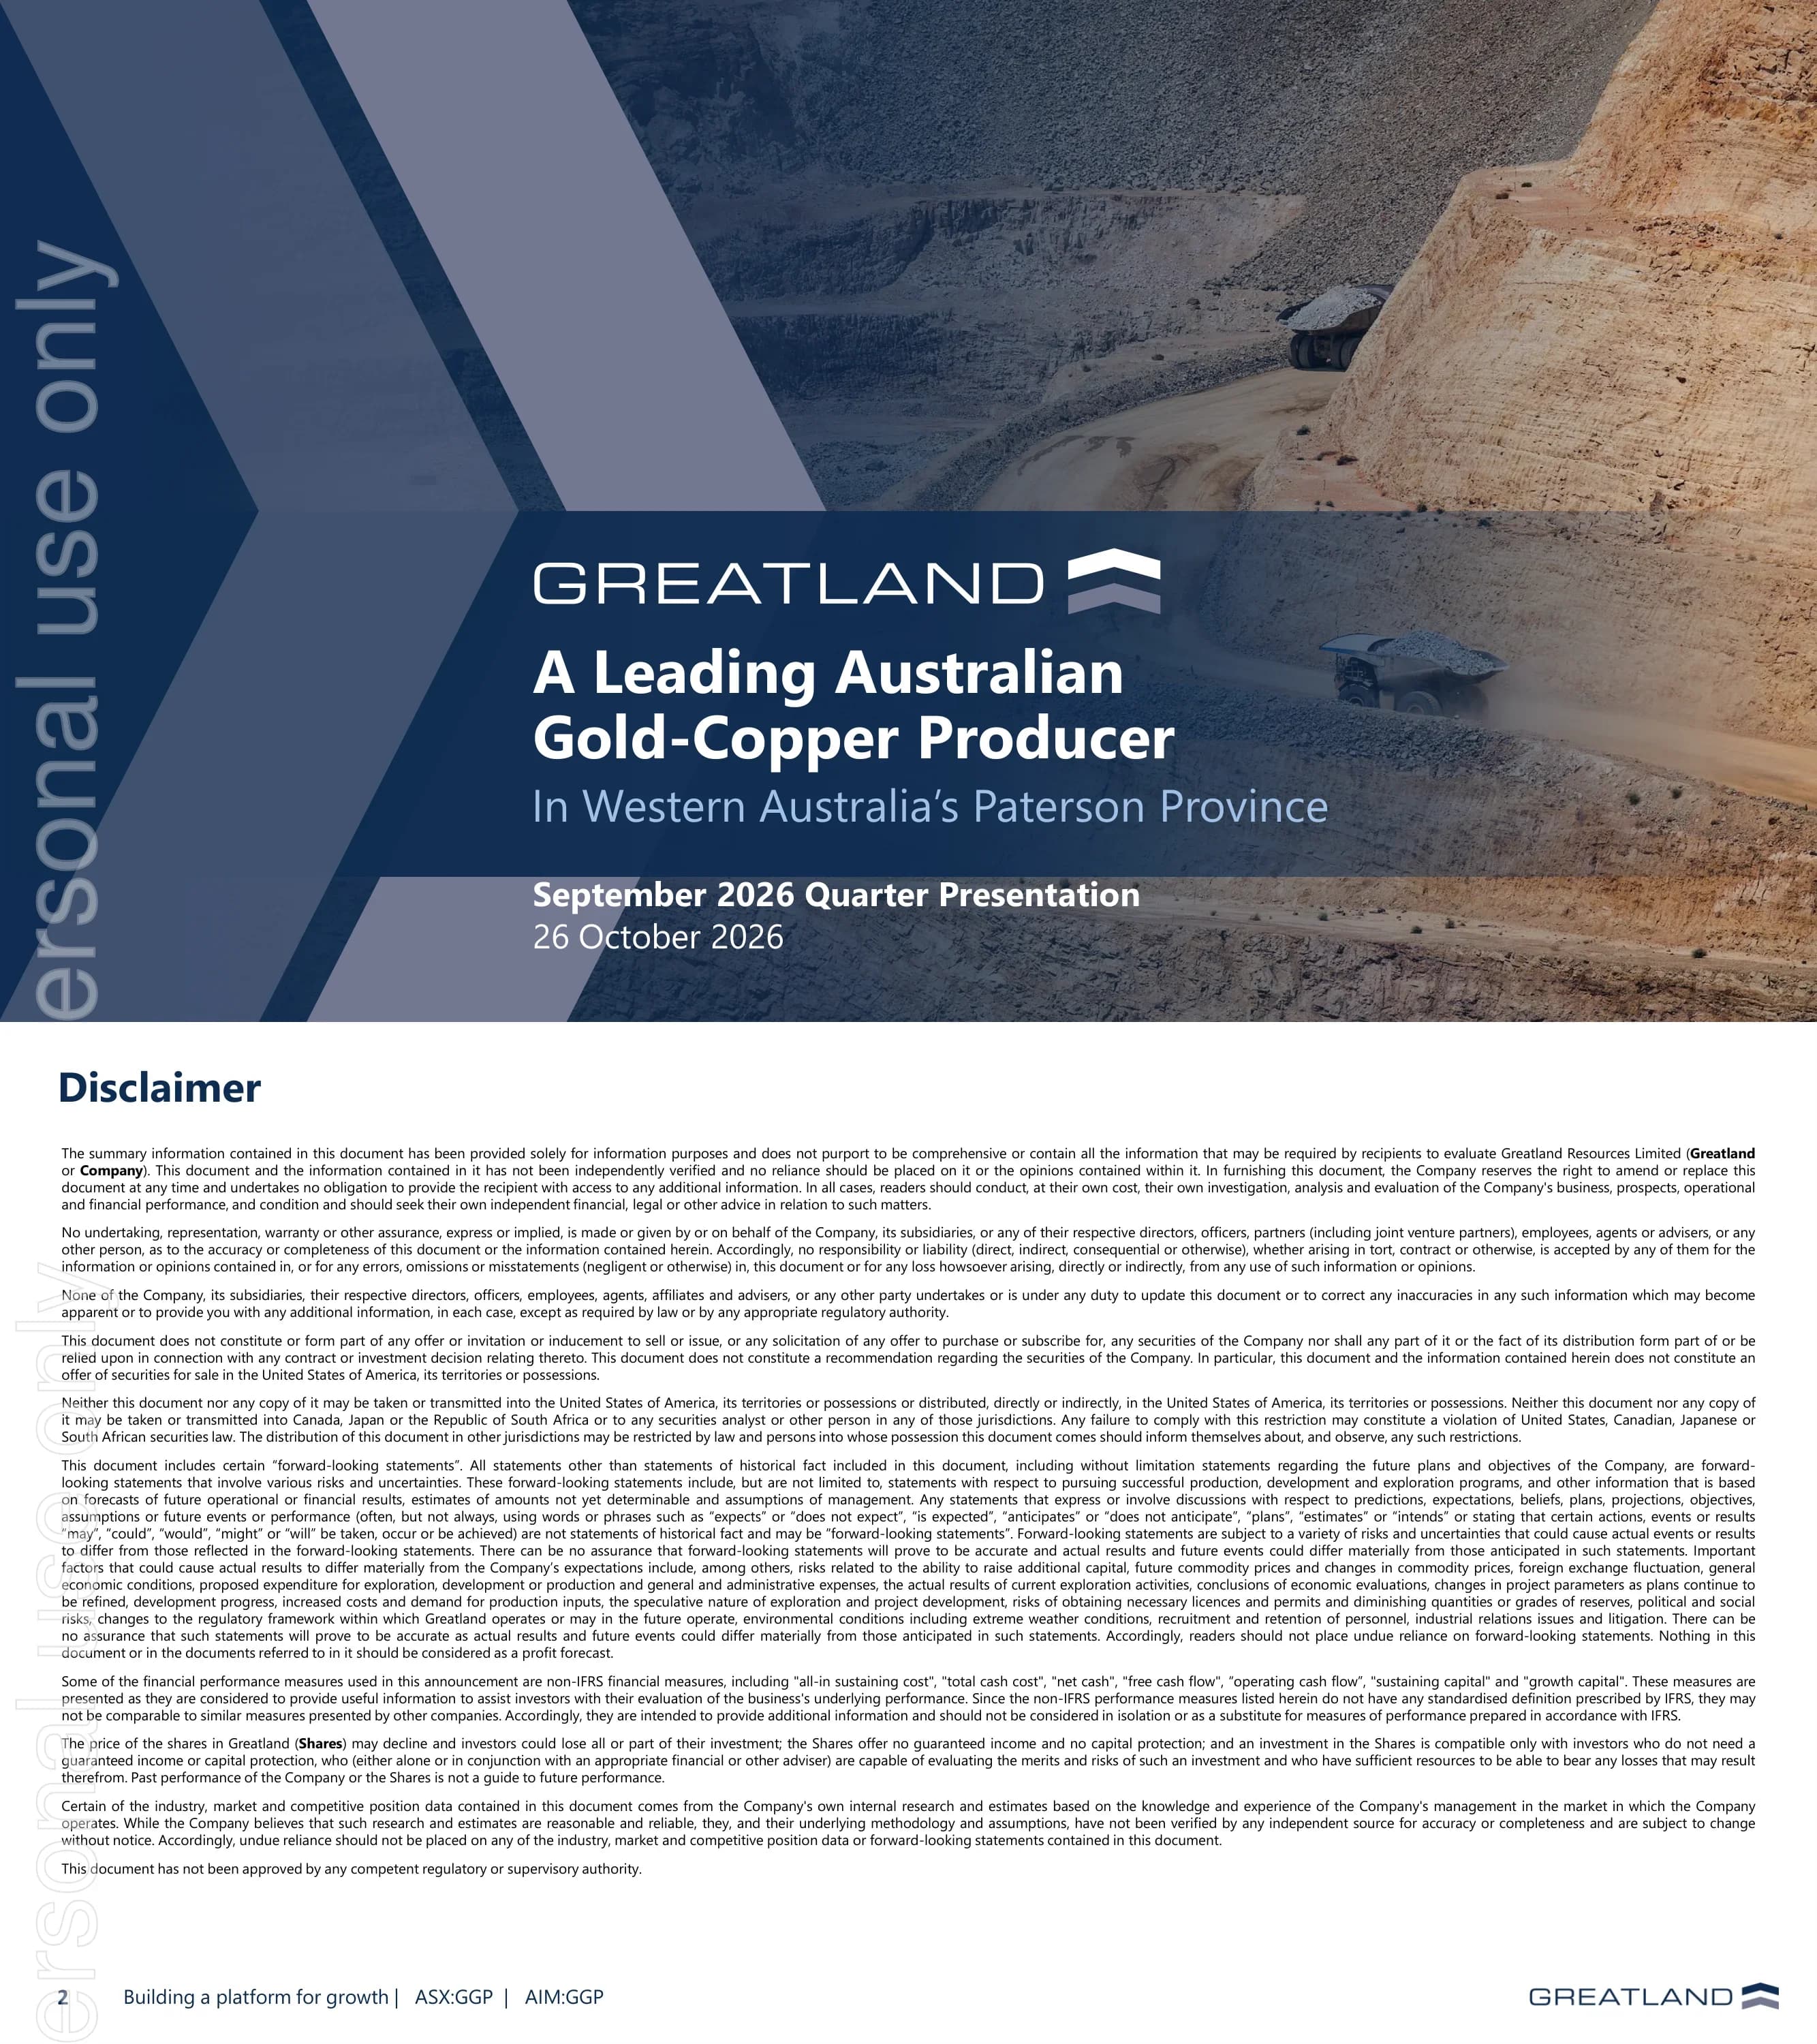
Greatland September 2026 Quarter Presentation
20 slides
Investor and roadshow presentations
6 decksDecks companies take to investor meetings and conferences to introduce the business, its assets and its plans.
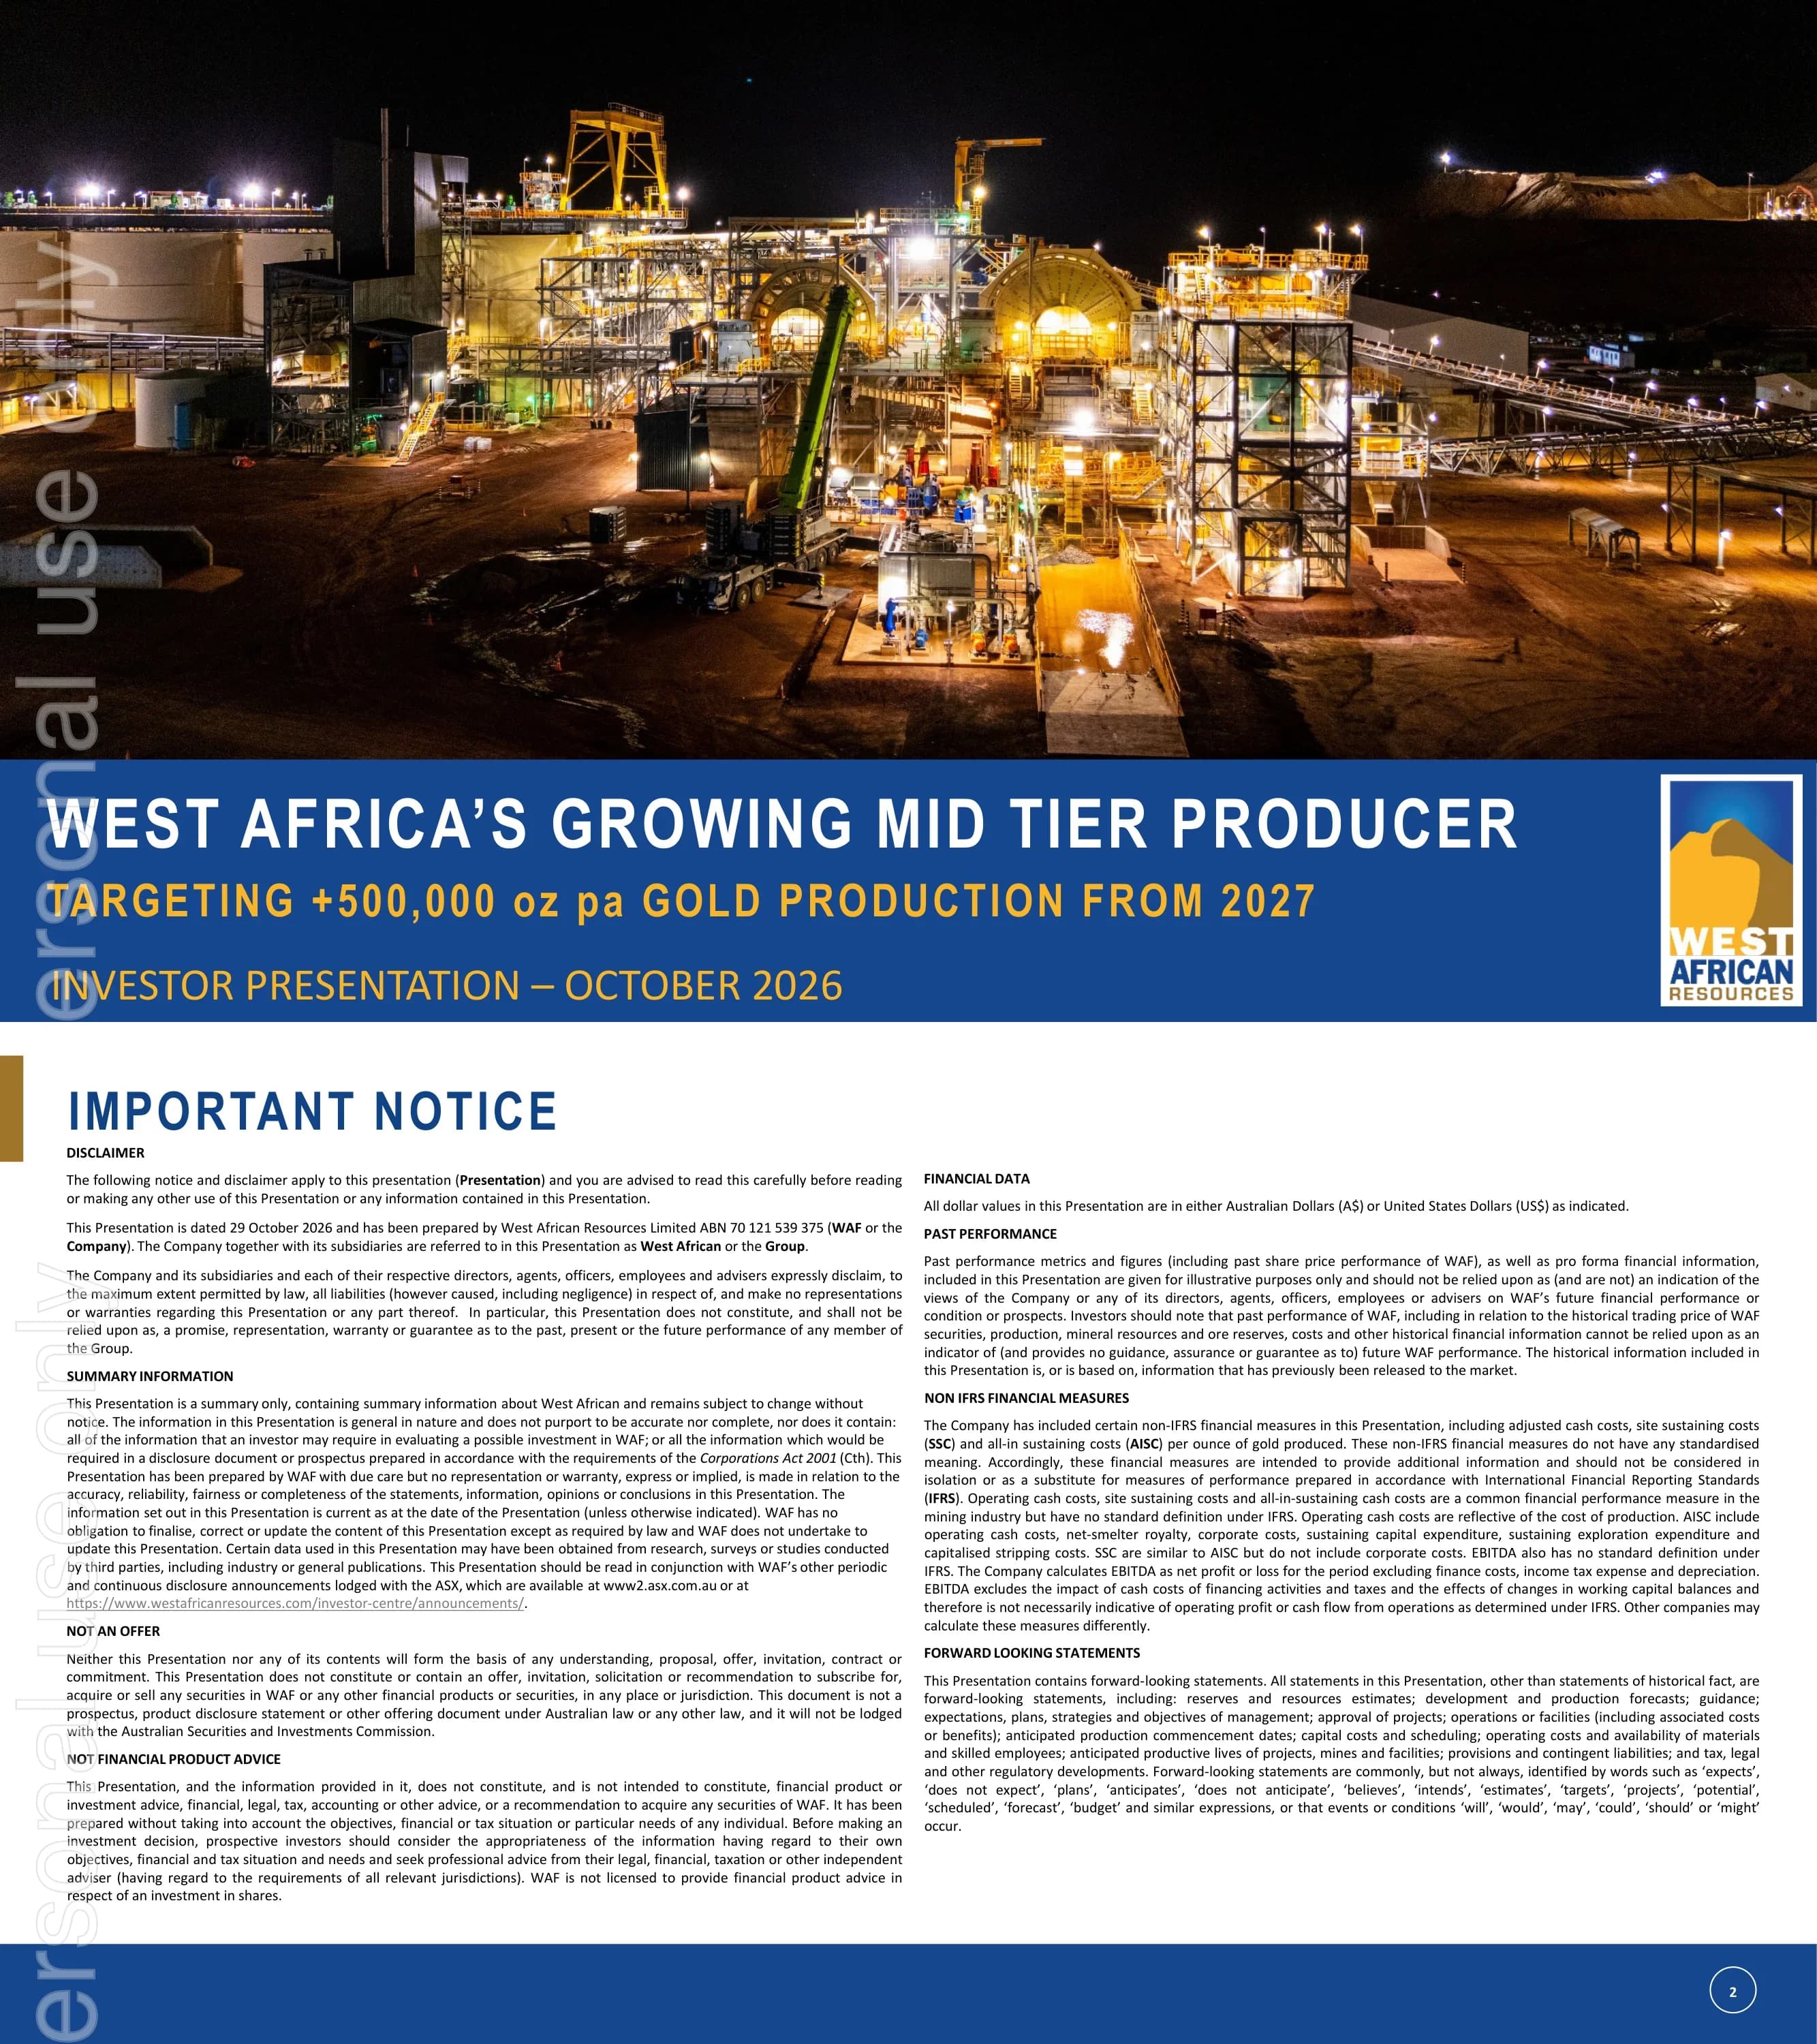
West African Resources Investor Presentation October 2026
24 slides
Regis Resources Investor Presentation October 2026
34 slides
Ora Banda Mining Investor Presentation October 2026
34 slides
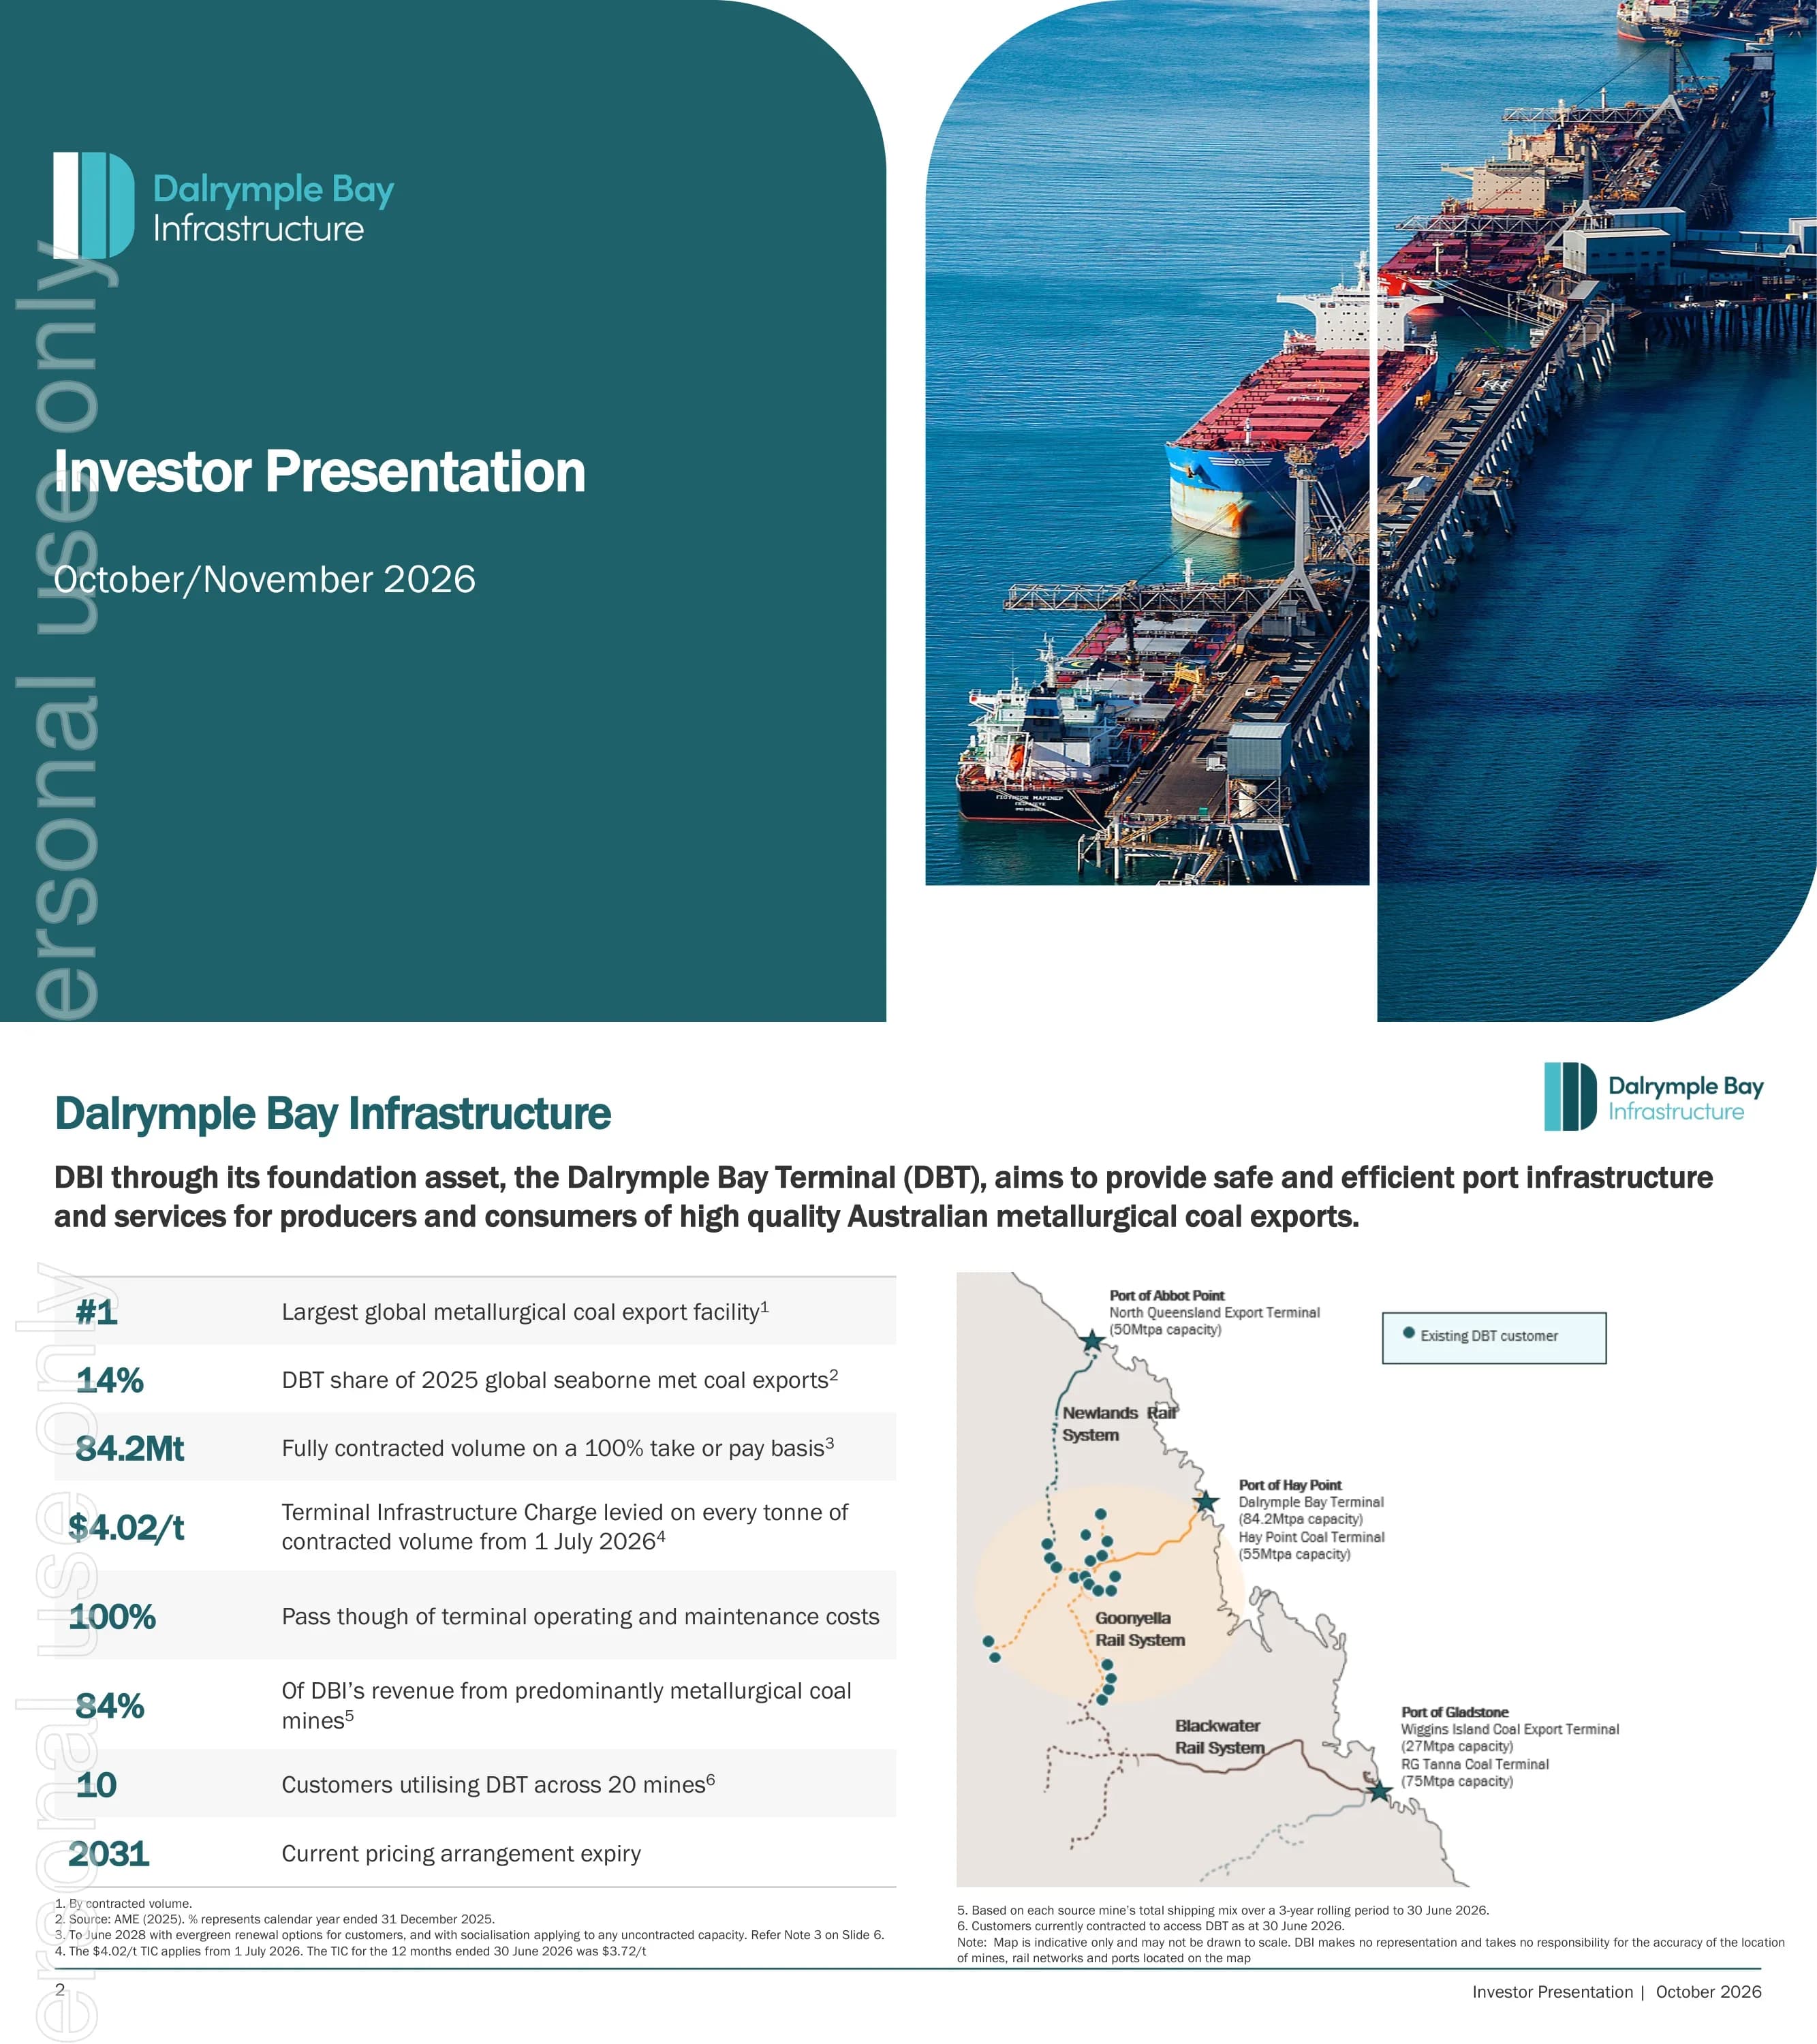
Dalrymple Bay Infrastructure Investor Presentation October 2026
22 slides
Contact Energy Investor Roadshow Presentation October 2026
24 slides
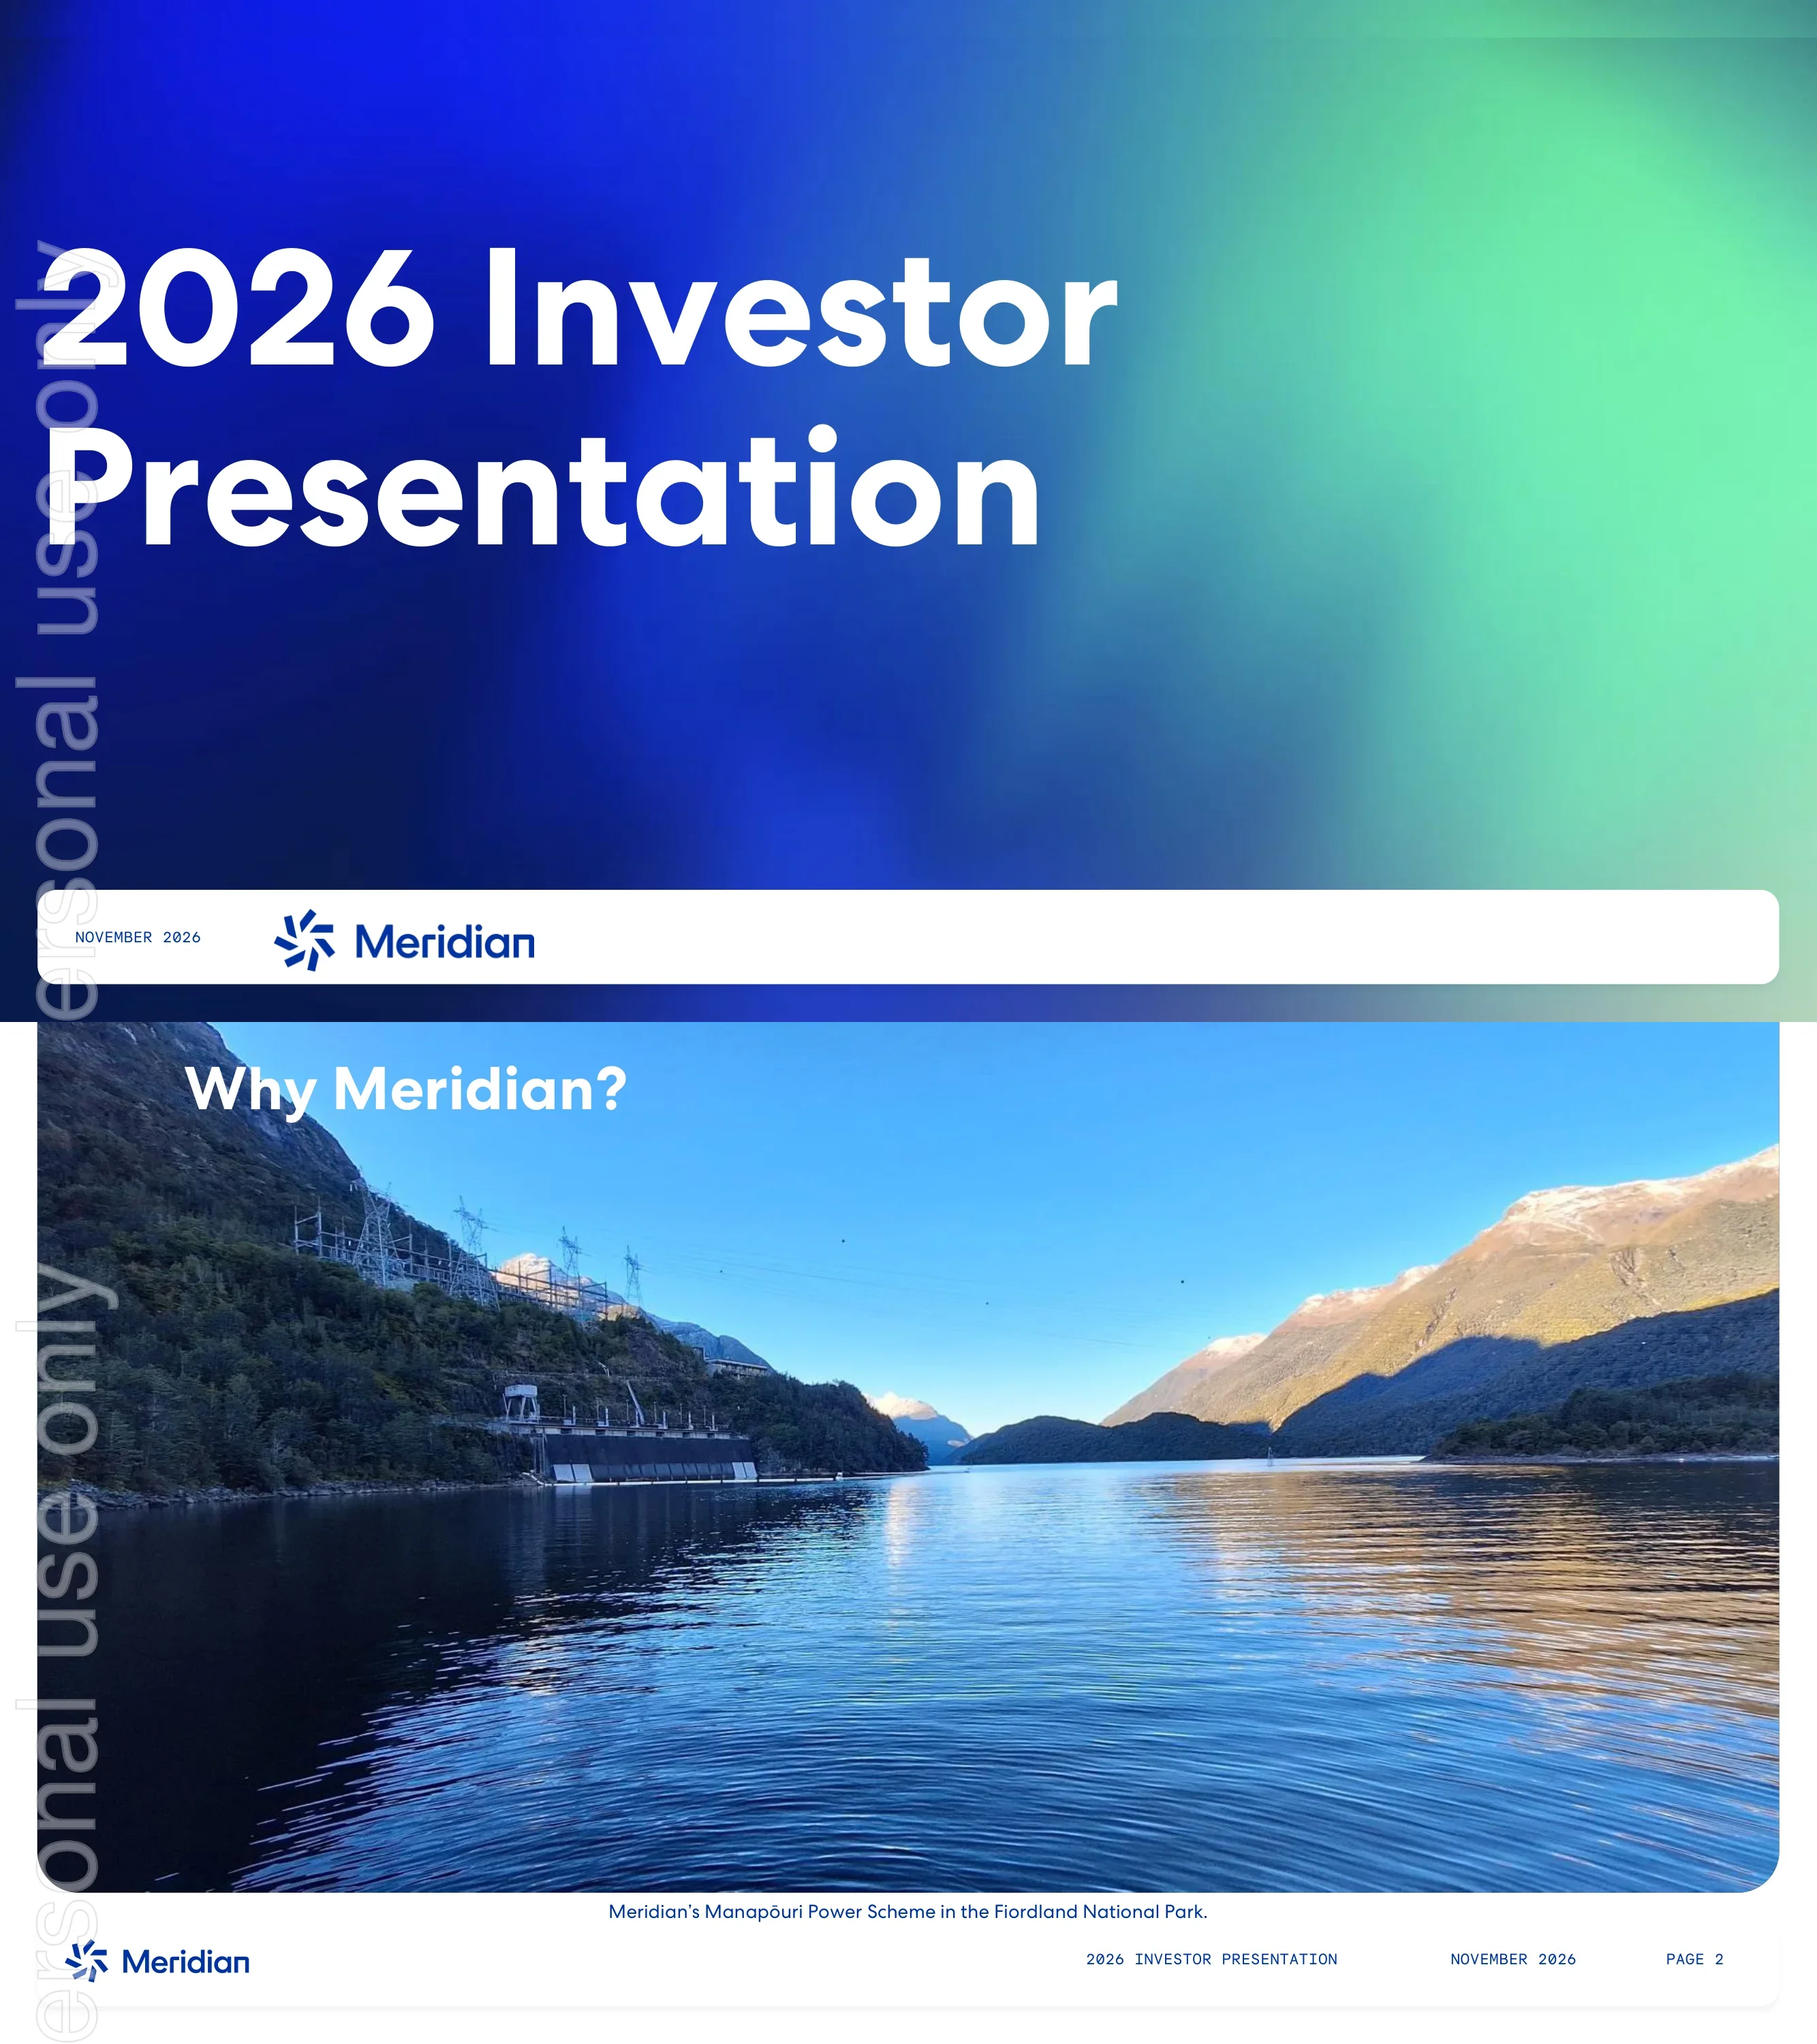
Meridian Energy Investor Presentation October 2026
26 slides
Investor and strategy days
2 decksLong-form decks from investor days that set out strategy, medium-term targets and how each division will get there.
How ASX companies present to investors
Companies listed on the ASX lodge their investor presentations with the exchange under its continuous disclosure rules, so the deck is public the moment it is released to the market. Mining and energy companies also publish a quarterly activities report, and many add a short presentation for the analyst call. Those decks lead with production, all-in sustaining cost (AISC), cash and progress against full-year guidance. Most Australian companies use a July to June financial year, so Q1 FY2027 is July to September 2026, with half-year results in February and full-year results in August. Figures are in Australian dollars unless the deck says otherwise. The collection also includes New Zealand companies listed on the ASX.
Australian decks are written for a market where miners report every quarter. They lead with production, costs and cash, then guidance against the full-year target, and show how to make operating data the story rather than an appendix.
Anatomy of an ASX quarterly deck
- 01
Quarter highlights
Production, sales, cost and cash on one page, compared with the previous quarter.
- 02
Safety and sustainability
Injury frequency rates and environmental metrics, usually near the front.
- 03
Operations by asset
One page per mine or business: output, grades, unit costs and what changed.
- 04
Guidance tracker
Year-to-date results against full-year guidance for production, costs and capital spending.
- 05
Balance sheet and pipeline
Cash, debt and hedging, followed by exploration or growth projects and the next milestones.
Frequently asked questions
Where do these decks come from?
- They are the investor presentations the companies lodged with the ASX as market announcements. The slides are unchanged.
What is a quarterly activities presentation?
- ASX-listed mining and energy companies report their activities every quarter. Many release a short deck alongside the report for the analyst call, covering production, costs, cash and guidance.
What do Q1 FY2027 and H1 FY2027 refer to?
- Most Australian companies run a July to June financial year. FY2027 is July 2026 to June 2027, so Q1 is July to September 2026 and H1 is July to December 2026.
What does AISC mean?
- All-in sustaining cost: the cost of producing an ounce of gold, or a unit of another metal, including the spending needed to keep the mine running. It is the main cost measure in Australian mining decks.
Can I use these as a template?
- Download the PPTX and reuse the layouts, chart types and section order. Replace the figures and branding with your own: the logos, trademarks and numbers belong to the companies that published them.
Turn your quarterly results into an investor deck
Upload your quarterly report, financial statements or production data, and 2Slides drafts the presentation for you: highlights, operations, guidance and outlook, ready to edit.


