
Part of Investor presentation examples
Contact Energy Investor Roadshow Presentation October 2026 — the 24-page international investor roadshow deck (cover: "International investor roadshow, October / November 2026") that New Zealand generator-retailer Contact Energy lodged with the ASX on 20 October 2026. Contact is dual-listed on NZX and the ASX (CEN), and all amounts are in New Zealand dollars (NZ$). The deck covers its ~98% renewable generation portfolio, the Contact31+ strategy, NZ$1.3b of projects under construction, an 11TWh+ development pipeline, the Southland wind farm pathway with NZAS, the 250MW Stratford data centre partnership with CDC, the capital allocation framework, and FY26 (July 2025–June 2026) earnings with underlying EBITDAF of NZ$1,011M.
Uses this deck’s cover as a style reference for slides made from your own content. Or pick any page below to use its layout as the reference.
Quick Navigation
Tags
Share the slides
Contact Energy Investor Roadshow Presentation October 2026 — the 24-page international investor roadshow deck (cover: "International investor roadshow, October / November 2026") that New Zealand generator-retailer Contact Energy lodged with the ASX on 20 October 2026. Contact is dual-listed on NZX and the ASX (CEN), and all amounts are in New Zealand dollars (NZ$). The deck covers its ~98% renewable generation portfolio, the Contact31+ strategy, NZ$1.3b of projects under construction, an 11TWh+ development pipeline, the Southland wind farm pathway with NZAS, the 250MW Stratford data centre partnership with CDC, the capital allocation framework, and FY26 (July 2025–June 2026) earnings with underlying EBITDAF of NZ$1,011M.
Detailed view of each slide page, including layout, key content and visual elements.
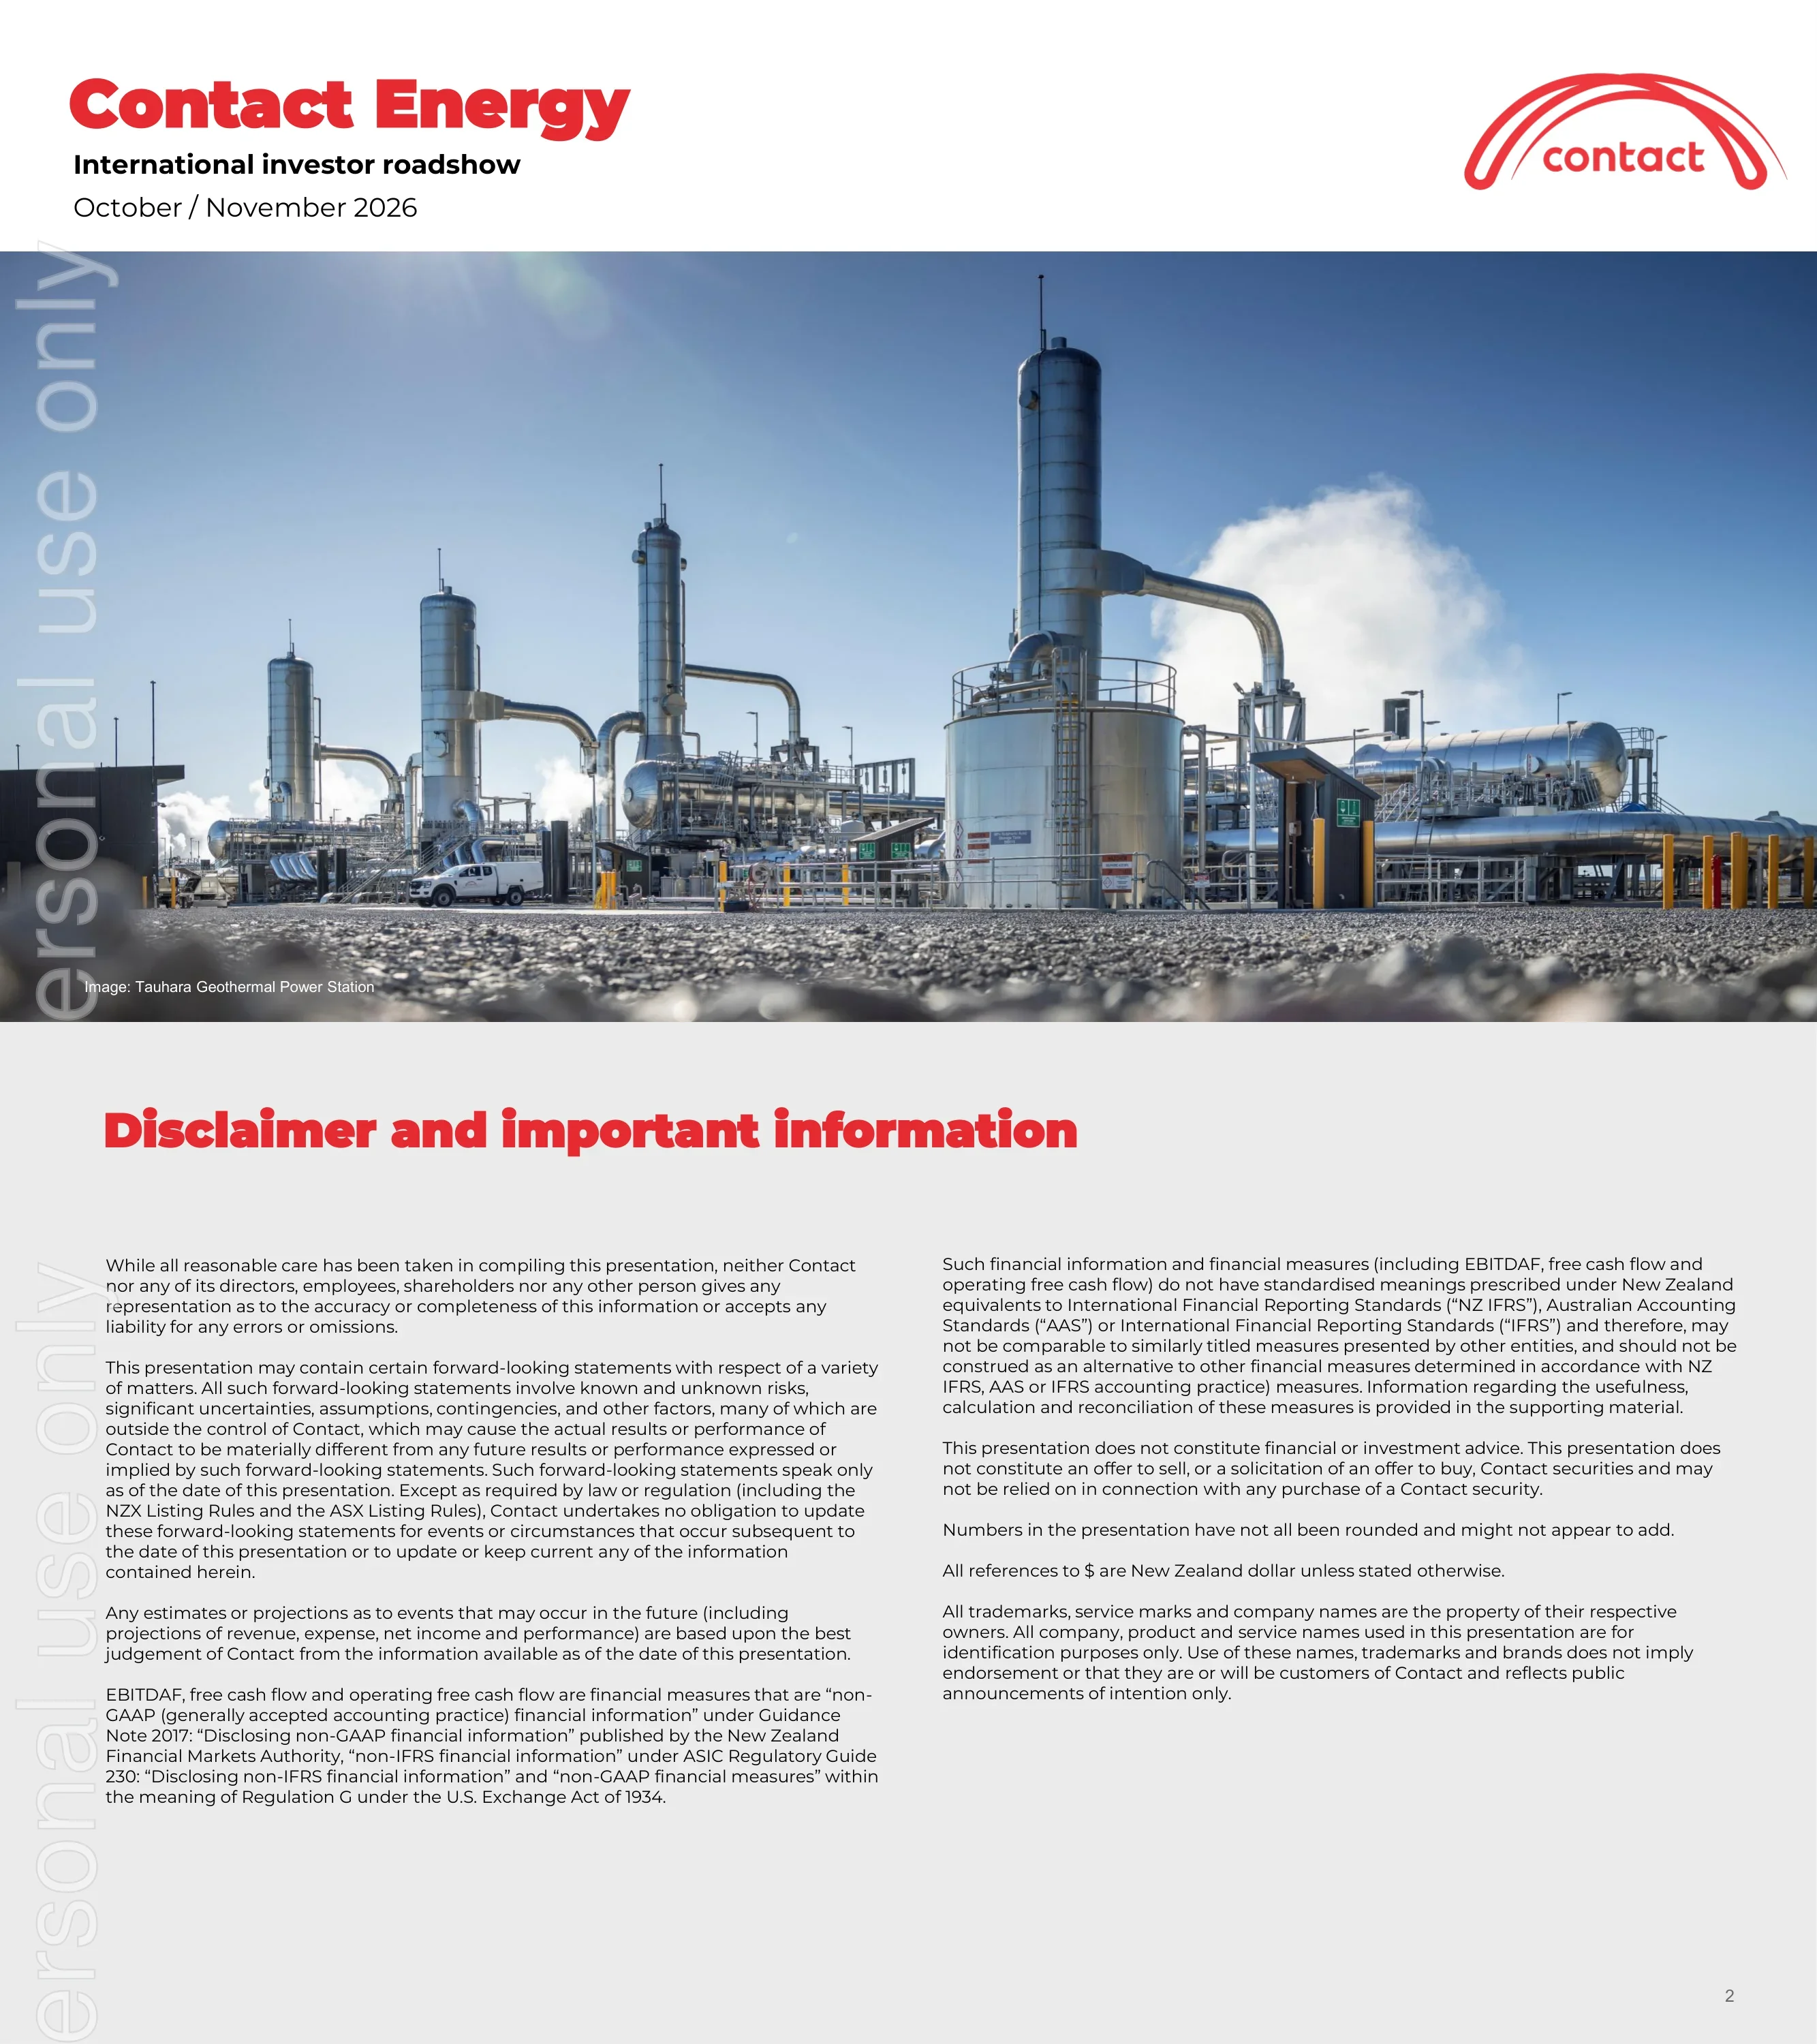
Cover slide naming the deck as the International investor roadshow for October / November 2026, with a full-width photo of the Tauhara Geothermal Power Station.
Title and subtitle top-left, Contact arc logo top-right, full-bleed photograph across the lower two-thirds; the ASX 'For personal use only' watermark runs vertically down the left edge.
Standard disclaimer covering forward-looking statements, non-GAAP measures (EBITDAF, free cash flow and operating free cash flow) under NZ FMA, ASIC RG 230 and SEC Regulation G, rounding, and the statement that all references to $ are New Zealand dollars unless stated otherwise.
Red headline over a light-grey background with two columns of small body text.
Investment case: CEN:NZX/ASX is the 4th largest NZX company by free-float market cap, in S&P Global and MSCI indices, with 13% annual TSR over 10 years. Four pillars: 98% renewable generation in FY26 (up from 81% in FY21), positioned for NZ demand growth (250MW Stratford data-centre option with CDC, 1.9TWh new geothermal in two years, 11TWh p.a. pipeline), S&P BBB balance sheet across 3 debt markets, and earnings growth — underlying EBITDAF rising from NZ$546M (FY22) to NZ$1,011M (FY26) and dividends from 35cps (FY23) to 40cps (FY26) and a >50cps FY31 aspiration.
Red ticker block and three stat callouts in a left column; 2x2 grid of white cards with red titles, icons and bullets, one card containing a mini bar chart and DPS figures.
Company at a glance as at 30 June 2026: 12TWh mean generation (~98% renewable), 7 geothermal stations plus 1 under construction, 26 hydro schemes, 4 controlled storage lakes, 1 solar farm plus 1 under construction, 1 battery plus 1 under construction, 3 thermal peaking stations, 700k customer connections, 4 product verticals (electricity, gas, broadband, mobile), 1,421 employees, 59k shareholders, 167 community organisations supported and 3 debt capital market jurisdictions.
Centred red headline over two rows of icon-plus-number stats arranged in an arc, framed by a thin dashed red outline.
Strategy map: four strategic pillars (extend advantage as NZ's geothermal leader; lead on new flexibility with batteries, hydro and gas flex; build into new demand with wind and solar anchored on industrial partnerships; lead the energy transition at home), four enablers (empowered people and leaders, stakeholder relationships, tech advantage in data and AI, productivity), a banner on operational excellence, and three values (Own the future, Brave humility, Performance edge).
Contact31 logo with headline; three horizontal tiers (pillars, enablers, values) of icon-topped text columns separated by dashed dividers and labelled arrows, with a full-width red ribbon banner.
Projects under construction represent ~NZ$1.3b of investment and ~0.5TWh of net new generation: Glorit Solar (150MWac / 287GWh p.a., target online Q4 CY28, target IRR >12%, financial close June 2026), Glenbrook-Ohurua Battery 2 (200MW / 400MWh, Q1 CY28, IRR >10%) and Te Mihi Stage 2 geothermal (101MW / ~840GWh p.a., ~200GWh net uplift, Q3 CY27, IRR ~10%, some equipment delivery delays). Recent builds since 2021: Tauhara (+1,450GWh, May 2024), Te Huka 3 (+430GWh, Dec 2024), Glenbrook-Ohurua Battery 1 (+100MW/200MWh, Mar 2026) and Kōwhai Park solar (+275GWh, Sep 2026).
Grey North Island map with red pins on the left; three stacked project rows on the right, each with photo, specs and bullet status; bottom chevron timeline of four recently completed projects.
Contact31+ priority options of ~4TWh net new renewable output — Tauhara 2 (50–70MW), Te Mihi Stage 3 and Tauhara 3 (up to 100MW each), Huriwaka wind (250MW / 890GWh), Southland wind (>325MW / 1,210GWh), Stratford solar hybrid (150MWac) and BESS (200MW / 400MWh), Argyle solar (80MWac) — marked by consent status, within a total uncommitted pipeline of ~11TWh across solar, geothermal and wind.
Full New Zealand map with labelled project callouts and consent-status badges on the left; stacked bar (~4 vs ~7 TWh) linked to two technology-mix donut charts on the right.
Southland wind farm: up to 55 turbines, >325MW, average output >1,210GWh. Consent approved April 2026; Mafic appointed to find a strategic partner for Contact's wind pipeline with a shortlist engaged; non-binding LOI with Rio Tinto for a PPA supporting a potential restart of the 50MW Line 4 potline at the NZ Aluminium Smelter; FID targeted mid-2027.
Left card with wind-farm photo and stacked electricity stats; right card with four red chevron-bullet project updates and an inset Southland site map.
Four market trends: domestic gas production falling from 135PJ (FY24) to 93PJ (FY26), a 17% CAGR decline; demand growth averaging only 0.3% p.a. since 2021 with large new industrial load still to come; thermal share of generation ~7% in FY26, the lowest since market start; and wider seasonal price spreads. A 10-year wholesale and futures price chart shows long-dated futures moving from ~NZ$80/MWh to ~NZ$170/MWh and recently settling near NZ$130/MWh, close to Contact's long-run view of NZ$120–130/MWh (2026 real).
Four icon-headed text columns across the top; bottom row with a three-bar gas production chart and a wide multi-line price chart annotated with eras and a callout box.
MBIE demand scenarios range from 47 to 61TWh by 2035; peak demand rose from 6,952MW to 7,564MW, driven mainly by residential usage. Key demand drivers: ~1GW of proposed data-centre load in Transpower's pipeline, Rio Tinto LOI for NZAS Line 4, Fonterra dairy electrification (coal phase-out by 2037), population growth above 1% p.a. and EVs expected to exceed 40% of the light vehicle fleet (3.7% in 2026).
Two line charts side by side (demand scenarios fan, peak demand) with rounded grey commentary boxes; bottom band of four driver cards with icons and partner logos.
Data centres are shifting from small 10–20MW domestic cloud facilities in cities (e.g. CDC Silverdale 20MW) to >100MW regional hubs for latency-tolerant global AI workloads of up to 1,000MW (e.g. CDC's 250MW Stratford proposal, Datagrid's 280MW Southland proposal). A map shows existing and future subsea fibre cables to Australia and the US and six advantaged data-centre zones.
Comparison table (workloads, location, scale, NZ example with photos) on the left; New Zealand map with subsea cable routes and shaded zones on the right.
BCG analysis scoring NZ across five investment drivers: rapid speed (1–3 year grid connection vs 2–5+ years elsewhere, fast-track permitting, ~1GW of generation under construction or shovel-ready), competitive cost (firmed energy, abundant land), advantaged sites (>1GW grid capacity within 1–2 years across 6 zones, 4 existing and 4 new subsea cables), supportive policy (20% immediate capex depreciation; 8th of 82 in EIU business rankings) and sustainability and security (95%+ renewable by 2027, EU data-adequacy, Moody's Aaa).
Three-column table with red header row: investment driver (icon), key component, NZ competitive position, with green up-arrow or grey neutral markers per row.
BCG market scenarios grow NZ data-centre capacity from 45MW (2020) and 125MW (2025) to 800MW in 2030 and up to 1,425MW in 2035 in the high export case. Contact lists six 'bottom lines': new demand matched by new renewables, data centres paying their share of transmission, fair power prices reflecting new firmed renewable cost, closed-loop cooling, local community benefit and enduring regional value.
Stacked column chart (domestic, export base, export high) with a rounded callout on the left; numbered list of six principles in outlined rows with red number circles on the right.
After the March 2026 closure of the TCC gas plant, Contact and CDC will seek resource consent for a 250MW (IT load) data centre at Stratford with closed-loop cooling. Site strengths: consented 150MWac / 312GWh solar with up to 750MWh DC-coupled batteries and 500MW grid-scale battery consent; 350MW of transmission capacity within 1–2 years and 600MW within 2–3 years; diverse fibre to Auckland; owned and optioned land; altitude and climate supporting PUE and rainwater harvesting; 50 years in the community. The existing 200MW gas peakers are unaffected.
Grey intro band with CDC and Contact logos; 3x2 grid of rounded red-outlined cards, each with a circular photo and short text.
Priorities: fund core operations (sustaining capex NZ$110–120M p.a., 2025 real), preserve financial strength (BBB rating, net debt/EBITDAF 2.6–2.8x, upper limit 3.0x), deliver dividends (80–100% of rolling four-year operating free cash flow; buybacks considered when leverage sits below target), and invest for growth. Investor metrics: project returns >10% (or WACC + 200–300bps), +300bps ROIC uplift by FY31, operating free cash flow at 55–60% of EBITDAF. Funding sources: EBITDAF growth, surplus OFCF, hybrids and DRP equity.
Four chevron-linked priority icons across the top; middle row splitting growth commitments (two white cards) and investor metrics (three white tiles); bottom arrow flow of funding sources.
Section divider introducing the first appendix on the New Zealand electricity sector.
Red appendix title on white at left; large aerial photo of a South Island hydro dam filling the right two-thirds.
Value chain: 4 major generators (Meridian 33%, Contact 23%, Mercury 21%, Genesis 11%, other 12% of generation), a spot pool, 1 national grid operator (Transpower) and 29 distribution businesses as regulated monopolies, and 8 retailers over 50k connections serving 2.4 million consumers. Average bill split: generation 38.5%, distribution 24.5%, GST 13.0%, retail 11.0%, transmission 8.0%, metering 4.5%, levies 0.5%. Network charge changes from 1 April 2025 lifted household bills by NZ$10–25 per month.
Left-to-right value chain with numbered grey and red circles under competitive/regulated headers; stacked market-share bars with company logos; central pie chart of the average bill.
FY26 national generation of 41.2TWh: hydro 60%, geothermal 23%, wind 9%, gas 6%, coal 1%, solar 1%. Electricity emissions fell from a 4.0 million tCO2e five-year average (2017–2021) to 2.9 (2022–2026), with 2026 at 1.2 gas and 0.3 coal. A chart of average controlled hydro lake storage since the late 1990s (average 2,809GWh) shows dry-year variability, so stored gas and coal remain important for resilience.
Left column with a big '41.2 TWh' figure, generation-mix donut and stacked emissions bars with dashed average lines; right panel with a long hydro storage line chart with max/min/average reference lines.
Five themes, each with delivered actions and a look-ahead: investing at pace in renewables (fast-track consenting, 4TWh added in five years, 93% renewable in FY26, ~3TWh committed by 2027); managing fuel security and dry-year risk (NZAS demand response, Huntly firming options, potential LNG import terminal); enhancing market settings; innovating for industrial customers (NZAS long-term contracts, 1TWh dairy electrification, NZ Steel electric arc furnace, up to ~725MW of data centres by 2035); and supporting energy wellbeing (~NZ$5M Contact Good support in FY26, NZ$7.5M committed for FY27).
Five red-headed columns with icons; two rows of red-outlined boxes labelled vertically 'Delivered' and 'Looking ahead'.
Section divider introducing the second appendix with Contact-specific supporting information.
Red appendix title at left; large interior photo of a power station turbine hall on the right.
Underlying EBITDAF (continuing operations) bridges from electricity sales margin and other gross margin less fixed costs, location losses and fuel costs: NZ$546M (FY22), 573M, 663M, 774M and NZ$1,011M (FY26), with FY26 electricity sales margin of NZ$1,640M. Long-term channel volume rose to 7.58TWh at NZ$132/MWh in FY26; market channels 4.10TWh at NZ$155/MWh; renewable generation 9.96TWh at ~NZ$1/MWh fuel cost; thermal, acquired and PPA volumes fell to 1.74TWh at NZ$138/MWh.
Tall stacked bar chart of EBITDAF components on the left; four smaller combo charts (stacked volume bars with price lines) in a 2x2 grid on the right.
FY26 channels to market total 11.5TWh: retail 3.7TWh (NZ$174/MWh), strategic fixed price 3.9TWh (NZ$92/MWh), C&I 1.9TWh (NZ$165/MWh) and CFDs 2.0TWh (NZ$155/MWh). ASX Otahuhu futures for FY27–FY31 sit around NZ$163–175/MWh at peaks, against a long-run wholesale view of NZ$120–130/MWh (2026 real). Contact31+ expectations: strategic fixed price volume steady ex-Stratford, rising with the data centre.
Four-panel layout: futures line chart, pricing-linkage cards with red price circles, a single stacked channel bar, and a grid of arrow icons showing volume and price expectations.
Maps of every operational asset with capacity: 649MW of North Island geothermal (e.g. Tauhara 174MW, Te Mihi 166MW, Wairakei 138MW), 255MW of North Island hydro, 1,040MW of South Island hydro (Clyde 464MW, Roxburgh 320MW), Stratford peakers 200MW, Whirinaki 156MW, Glenbrook-Ohurua Battery 1 (100MW / 200MWh) and Kōwhai Park solar (150MWac).
Side-by-side grey maps of the North and South Islands with colour-coded dots and dashed leader lines to capacity labels; red total-capacity callout boxes.
Combined solar and wind options of ~10TWh (~2.5TWh solar, ~7TWh wind) shown by land/consent status, plus a project table listing committed projects (Te Mihi Stage 2, Glorit, Glenbrook-Ohurua 2), high-priority Contact31+ options (Argyle, Stratford solar and battery, Southland, Huriwaka, Tauhara 2, Te Mihi Stage 3, Tauhara 3) and assessing options (Kaihiku JV 300MW, Kaipara, Moa Creek, Pouto >400MW, Hapuakohe, Mackenzie Basin, Ototoka, Marlborough and other solar/wind) with capacity, output and status bars.
Two donut charts stacked on the left with footnotes; wide red-header table on the right with vertical group labels and pink Gantt-style status bars.
Common questions about this slide and the underlying presentation content.
It is the 24-page deck Contact Energy used for its international investor roadshow in October/November 2026, lodged with the ASX on 20 October 2026. It covers the company's renewable portfolio, Contact31+ strategy, construction programme, 11TWh+ pipeline, the Stratford data centre partnership with CDC, capital allocation, and two appendices on the NZ electricity market and Contact's portfolio economics.
Contact Energy is dual-listed on NZX and the ASX under the code CEN, so it lodges its investor materials with both exchanges. All amounts in the deck are New Zealand dollars (NZ$) unless stated otherwise, not Australian dollars.
Contact's financial year runs July to June, the same as the Australian fiscal year. FY26 covers July 2025 to June 2026, and the deck's company-level figures are as at 30 June 2026.
Underlying EBITDAF grew from NZ$546M in FY22 to NZ$1,011M in FY26, and the dividend rose from 35 cents per share in FY23 to 40cps in FY26, with an aspiration of more than 50cps by FY31. The capital framework targets net debt/EBITDAF of 2.6–2.8x and a BBB credit rating.
Slides 11–14 explain how AI workloads make New Zealand a viable data-centre location, cite BCG scenarios of up to 1,425MW of NZ data-centre capacity by 2035, and introduce Contact's partnership with CDC to seek consent for a 250MW data centre at its Stratford site, supported by co-located batteries and new renewable generation.
Yes. Alongside the original PDF there is an editable PPTX that was converted from the PDF, so text boxes, tables and shapes can be edited. As a conversion, some charts and maps may come through as images and fonts may need adjusting; it is not an original Contact Energy template file.
The deck shows reusable patterns for energy and infrastructure presentations: icon-plus-number stat grids, map-based project pipelines, combo bar and price-line charts, scorecard tables and a capital allocation flow. Build your own version in 2Slides with similar red-and-grey styling and replace the content with your own data.
Official investor relations page with results, presentations and announcements.

Create Your Own Slides
Turn your ideas into professional presentations in seconds with 2slides AI.
Reference professional designs, choose your style, and generate slides with perfect text rendering. Powered by Nano Banana—start creating your presentation now.
Your AI Agent for slides. Save time, shine faster with intelligent presentation creation.


© 2026 2slides. All rights reserved.