
E-commerce collection
E-commerce presentation examples
Real decks from online marketplaces, commerce platforms and the brands that sell through them: quarterly results, trend reports and playbooks. Every slide is readable on the page before you download anything.
- Decks
- 12
- Slides
- 432
- Last added
- 2026-10-20

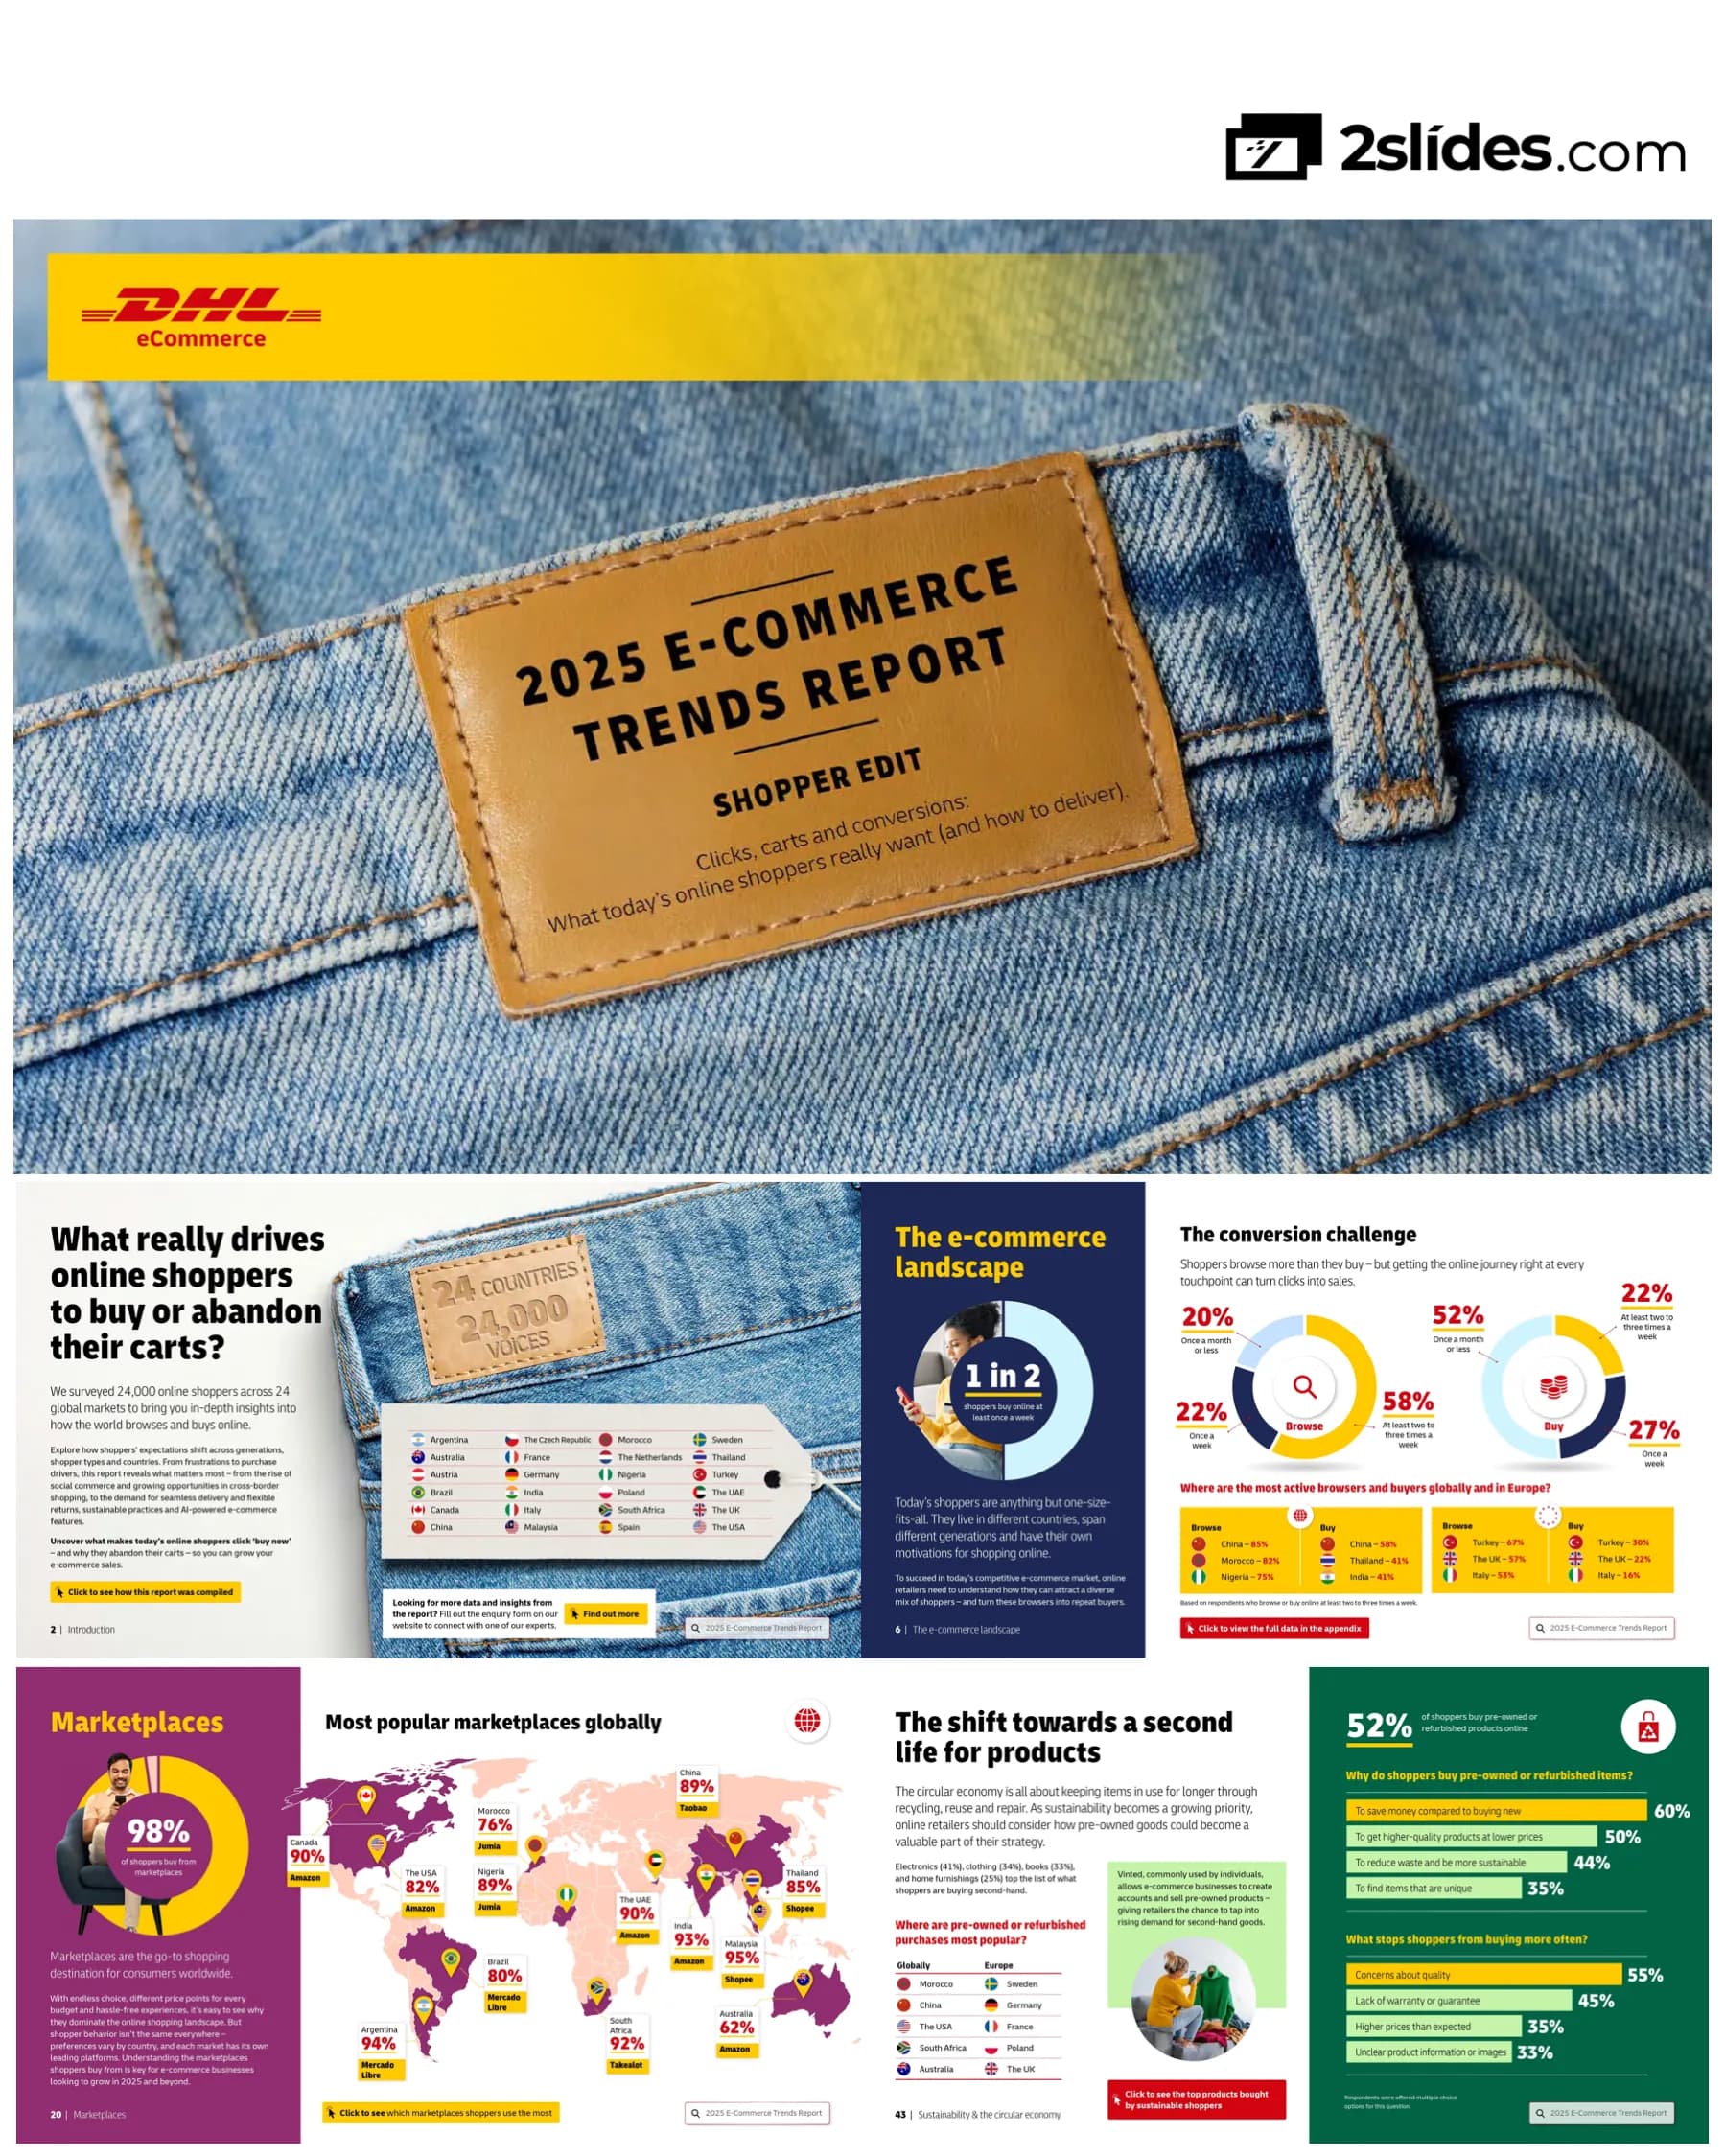
Company results & investor decks
9 decksHow marketplaces and commerce platforms report: GMV, take rate, active buyers, fulfilment and the outlook for the next quarter.
eBay Q2 2026 Earnings Presentation
40 slides
Commerce (BigCommerce) Q2 2026 Earnings Presentation
37 slides

MercadoLibre Q2 2026 Investor Presentation
34 slides

Shopify Q2 2026 Investor Presentation
31 slides

Global-e Q2 2026 Earnings Presentation
26 slides
Coupang Q2 2026 Earnings Presentation
23 slides

Sea Limited Q2 2026 Earnings Presentation
21 slides
Chewy Q2 2026 Earnings Presentation
15 slides
Amazon Q2 2026 Earnings Presentation
15 slides
Trend reports & playbooks
3 decksResearch on how people shop online, and guides for brands selling through new channels.
What an e-commerce deck has to show
E-commerce businesses are judged on a handful of operating metrics, and their presentations are built around them. Gross merchandise volume shows how much passes through the platform; take rate shows how much of it becomes revenue; active buyers and order frequency show whether growth comes from new customers or existing ones; fulfilment and logistics costs explain the margin. A good e-commerce deck puts those numbers in the same order every quarter so readers can compare one period with the last. The same structure works for a merchant's own business review.
The company decks are the files each business published for its investors, kept whole, so you can see how a marketplace explains GMV, take rate and active buyers to people who will check the numbers. The reports and playbooks show the other side: where online shoppers are heading and how brands plan for it.
Anatomy of an e-commerce results deck
- 01
GMV and revenue
Gross merchandise volume next to revenue, so the take rate is visible.
- 02
Buyers and frequency
Active buyers, new versus returning, and orders per buyer.
- 03
Unit economics
Average order value, contribution margin and fulfilment cost per order.
- 04
Channels and regions
Growth split by marketplace, country or business line such as ads and payments.
- 05
Outlook
Guidance for the next quarter, usually GMV, revenue and adjusted EBITDA.
Frequently asked questions
Where do these e-commerce presentations come from?
- The company decks are the files each business published on its own investor relations page. The reports and playbooks are documents their publishers released for free. Nothing is redrawn, summarised or reconstructed.
Can I use one as a template for my store's business review?
- Download the PPTX and reuse the layouts, chart types and section order. Replace the figures and branding with your own: the logos, trademarks and reported numbers belong to the companies that published them.
Which metrics should an e-commerce presentation include?
- Most start with GMV or net sales, then active customers, average order value and repeat rate, then marketing and fulfilment costs, and finish with the plan for next quarter. The company decks here show how large marketplaces sequence the same metrics.
How often are new decks added?
- Company decks are checked after every earnings season and added as they are published. Reports are added when a new edition comes out.
Turn your store's numbers into a deck
Upload a sales export, a spreadsheet or a PDF report, and 2Slides drafts the business review for you: headline metrics, channel charts and next quarter's plan, ready to edit.


