
Part of Investor presentation examples
Sea Limited Q2 2026 Earnings Presentation — second quarter 2026 results for Shopee (e-commerce), Monee (digital financial services) and Garena (digital entertainment), presented August 2026
Quick Navigation
Tags
Share the slides
Sea Limited Q2 2026 Earnings Presentation — second quarter 2026 results for Shopee (e-commerce), Monee (digital financial services) and Garena (digital entertainment), presented August 2026
Detailed view of each slide page, including layout, key content and visual elements.
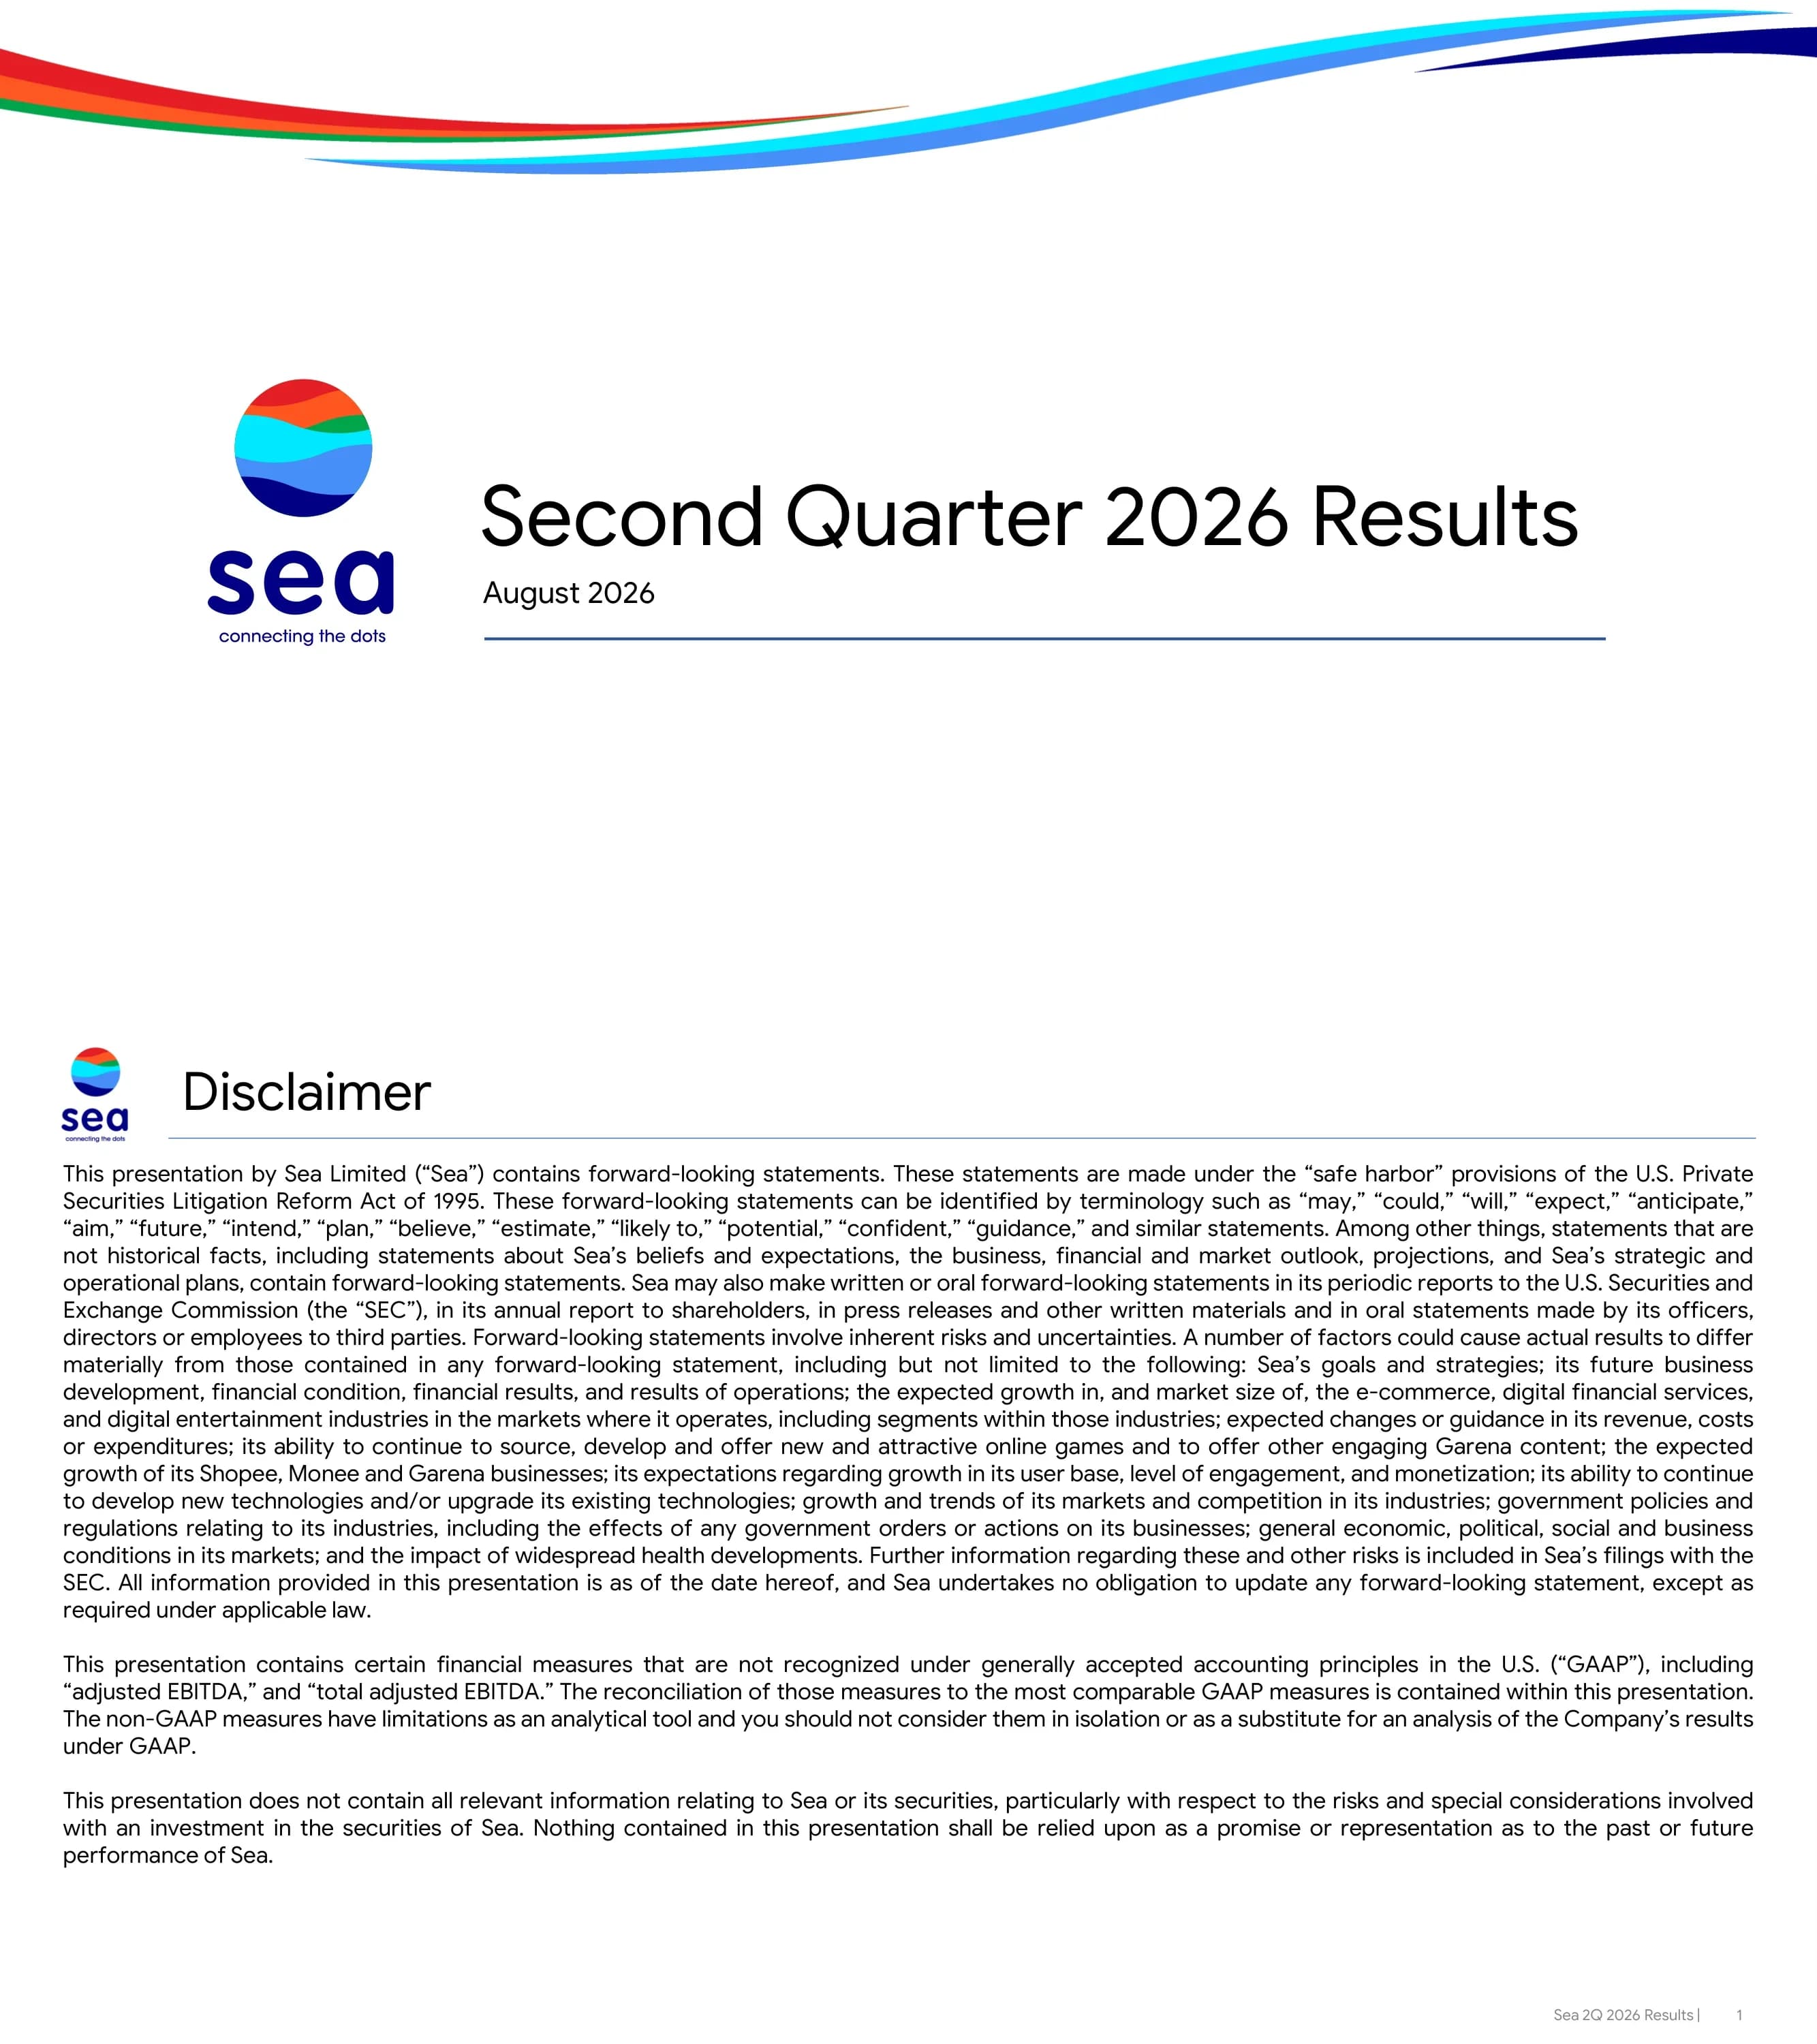
Cover slide announcing Sea Limited's Second Quarter 2026 Results, dated August 2026, with the Sea 'connecting the dots' logo.
White background with a multi-coloured ribbon swoosh (red, orange, green, cyan, blue, navy) sweeping across the top; circular Sea logo on the left, large black title and date to the right above a thin blue rule.
Forward-looking statements safe-harbor language under the Private Securities Litigation Reform Act of 1995, risk factors for Shopee, Monee and Garena, a note that adjusted EBITDA and total adjusted EBITDA are non-GAAP measures reconciled in the deck, and a statement that the presentation is not complete information about Sea's securities.
Standard content template: small Sea logo top-left, black title, thin blue rule, then three fully justified paragraphs filling the body; footer 'Sea 2Q 2026 Results | 1'.
Section divider opening the results overview section.
Same layout as the cover: ribbon swoosh at top, Sea logo left, two-line section title with blue underline.
One headline metric per segment: Shopee GAAP revenue US$5.6B (from 3.8B in 2Q25 and 5.1B in 1Q26; +48.2% YoY, +9.3% QoQ); Monee loans principal outstanding US$11.1B (6.9B, 9.9B; +62.5% YoY, +12.3% QoQ); Garena bookings US$763.5M (661.3M, 931.4M; +15.5% YoY, -18.0% QoQ). Footnotes define loans outstanding (on- and off-book) and bookings.
Three equal columns, each with a centred two-line heading, unit label, YoY/QoQ callout at top right, and a three-bar chart (2Q 2025 | 1Q 2026 | 2Q 2026) separated by a vertical dashed line after the year-ago bar; current quarter in dark blue, earlier periods in lighter blue.
Group financials across three periods: GAAP revenue US$7.8B (5.3B 2Q25, 7.1B 1Q26); gross profit US$3.5B (2.4B, 3.1B); operating income US$650.3M (487.7M, 593.0M); net income US$458.1M (414.2M, 438.2M). Figures are unaudited.
Four equal columns of three-bar charts with the same dashed divider and colour coding as the previous slide; unit labels above each chart and period labels along a shared baseline.
Total adjusted EBITDA US$917.2M (829.2M in 2Q25, 1,034.3M in 1Q26) with a segment table beneath: Shopee 227.7 / 223.2 / 255.4, Monee 255.3 / 275.2 / 288.0, Garena 368.2 / 573.6 / 429.8 (US$M). Gross cash position US$10.3B (10.6B, 11.1B). Footnotes define gross cash and note that from 3Q 2026 the deferred-revenue effect will be excluded from adjusted EBITDA.
Two-panel layout: left bar chart with an aligned three-row data table underneath sharing the chart's period columns; right a larger three-bar chart. Dashed divider runs through both chart and table.
Segment table in US$M: revenue Shopee 5,587.6, Monee 1,402.8, Garena 746.6, Other Services 50.8, consolidated 7,787.8; operating income 160.3, 279.0, 404.2, (51.5), unallocated (141.7), consolidated 650.3; adjusted EBITDA 255.4, 288.0, 429.8, (46.2), (9.7), consolidated 917.2. Notes explain the Garena deferred-revenue treatment and that unallocated expenses are mainly share-based compensation and corporate costs.
Single wide table with blue column headers, a heavy black rule beneath the header, and a vertical black rule separating the Consolidated column; generous row spacing and footnotes at bottom.
Section divider opening the business highlights section for Shopee, Monee and Garena.
Ribbon swoosh header, Sea logo left, two-line section title with blue rule — identical to the other dividers.
Shopee highlights in three themes. Growth with discipline: record quarter, GMV +28% YoY, adjusted EBITDA above US$250M, monthly new active buyers up >35%, monthly active buyers +18%, purchase frequency +8%, ad revenue up >70% and ad take rate up >90bps, Brazil the fastest-growing market, and optimism about reaching US$1B adjusted EBITDA for the full year. Structural moats: instant delivery in Indonesia as fast as 1 hour with volumes ~+80% and cost per order ~-20%, fulfillment volumes >20% QoQ, ShopeeVIP above 15M members (+45% QoQ, ~80% monthly retention, 24% of Asia GMV), Brazil VIP above 1M. Content ecosystem: livestream and short-video orders >50% YoY and >25% of SEA physical-goods orders, Facebook-driven orders >85% QoQ, Instagram collaboration extended to all eight core markets.
Shopee orange logo replaces the Sea logo and the header rule turns red; three equal columns each with a rounded dark-blue header tab and a rounded outlined card holding bullet points, with bold sub-headings inside cards.
Five-quarter trend: GMV US$29.8B, 32.2B, 36.7B, 37.3B, 38.3B from 2Q 2025 to 2Q 2026, with gross orders rising from 3.3B to 3.6B, 4.0B, 4.0B and 4.2B.
Centred chart title, legend top-left, five vertical bars with value labels and a grey line-with-markers overlay for gross orders; latest quarter in dark blue.
Shopee GAAP revenue rose from US$3.8B to 4.3B, 5.0B, 5.1B and 5.6B over five quarters; 2Q 2026 split into core marketplace revenue 4.3B, value-added services 0.7B and product revenue 0.7B. GAAP take rate (revenue as % of GMV) climbed from 12.6% to 13.3%, 13.5%, 13.7% and 14.6%.
Stacked bar chart with three blue shades for revenue streams and a grey take-rate line above; only the latest bar shows segment value labels; legend in two columns at top-left.
Shopee adjusted EBITDA of US$227.7M, 186.1M, 202.5M, 223.2M and 255.4M from 2Q 2025 to 2Q 2026, with adjusted EBITDA as a percentage of GMV at 0.8%, 0.6%, 0.6%, 0.6% and 0.7%.
Five-bar column chart with a grey margin line overlay and percentage labels; legend top-left; footnote on GAAP reconciliation.
Monee highlights. Growth with stable risk: loans principal outstanding US$11.1B (+62% YoY), NPL90+ ratio stable at 1.0%, the Philippines the fifth market with a loan book above US$1B, ~5.3M first-time borrowers added, active credit users above 40M (+~34% YoY), average loans per user +~20%; AI underwriting lifted approval rates ~10% at similar risk and AI income-document checks cut review time ~95%. New segments and off-Shopee growth: broader one-month interest-free SPayLater, promotional rates for first-time cash loans, off-Shopee above 20% of the SPayLater portfolio (up to 35% in some markets), a ShopeePay Unlimited Card test in Thailand, and standalone ShopeePay app monthly transacting users more than doubling, with Brazil launch coming.
Monee blue wave logo and blue header rule; two wide columns, each with a rounded dark-blue header tab and an outlined bullet card containing bold sub-headings; footnotes defining NPL90+ and active credit users.
Loans principal outstanding grew from US$6.9B to 7.9B, 9.2B, 9.9B and 11.1B over five quarters; the latest split is 10.0B on-book and 1.1B off-book. NPL90+ ratio held between 1.0% and 1.1% (1.0%, 1.1%, 1.1%, 1.1%, 1.0%).
Stacked two-tone bars (on-book darker, off-book lighter) with a grey NPL line overlaid; legend top-left; three footnotes explaining definitions.
Monee GAAP revenue rose from US$882.8M to 989.9M, 1,131.9M, 1,241.8M and 1,402.8M; adjusted EBITDA grew from 255.3M to 258.3M, 263.1M, 275.2M and 288.0M.
Clustered column chart with two bars per quarter (revenue darker, EBITDA lighter) across five quarters; latest pair highlighted in stronger colours.
Garena highlights. Free Fire: bookings +15% YoY with healthy, growing profitability; Free Fire in its ninth year still drawing over 100M average daily active users; the Songkran-inspired 'Undersea Mystery' campaign and the World Cup tie-in 'Fire Kickoff', whose song 'Booyah Olé' passed 350M social views. Portfolio: two newly announced mobile games on global IP — Palworld Online, published by Garena under licence from Pocketpair, and Monster Hunter Outlanders, developed by Tencent on Capcom's franchise.
Red Garena dragon logo with red header rule; two columns with dark-blue header tabs and outlined bullet cards, bold lead-in sentence at the top of each card.
Quarterly active users of 664.8M, 670.8M, 633.3M, 666.5M and 666.3M from 2Q 2025 to 2Q 2026; quarterly paying user ratio 9.3%, 9.8%, 9.2%, 10.9% and 10.2%; ARPPU (average bookings per paying user) US$10.7, 12.8, 11.6, 12.8 and 11.2 shown in a table row under the chart.
Five-bar chart with grey ratio line on top and a single-row ARPPU table aligned to the bar columns beneath the baseline.
Five quarters of Garena bookings (661, 841, 672, 931, 764), GAAP revenue (559, 653, 701, 697, 747) and adjusted EBITDA (368, 466, 364, 574, 430) in US$M, with adjusted EBITDA as a percentage of bookings at 55.7%, 55.4%, 54.1%, 61.6% and 56.3%.
Clustered chart of three bars per quarter in graded blues with a grey margin line overlay; two-column legend top-left; footnotes defining bookings and noting the 3Q 2026 EBITDA methodology change.
Section divider introducing the appendix with non-GAAP reconciliations.
Ribbon swoosh, Sea logo and single-word title with blue rule.
Reconciliation in US$ thousands, 2Q 2025 vs 2Q 2026. Shopee: operating income 154,851 / 160,284 plus D&A 72,843 / 95,135 = adjusted EBITDA 227,694 / 255,419. Monee: 243,115 / 279,031 plus D&A 12,148 / 8,954 = 255,263 / 287,985. Garena: 275,465 / 404,156 plus deferred-revenue effect 88,344 / 20,269 and D&A 4,381 / 5,331 = 368,190 / 429,756.
Two-column financial table grouped by segment with blue segment labels, italic line items, black total rules and bold subtotals.
Other Services: operating loss (15,683) / (51,475) plus D&A 1,917 / 5,250 = adjusted EBITDA (13,766) / (46,225). Group: operating income 487,719 / 650,329, deferred-revenue effect 88,344 / 20,269, D&A 91,289 / 114,670, share-based compensation 161,892 / 131,920, giving total adjusted EBITDA 829,244 / 917,188 (US$ thousands).
Continuation of the reconciliation table format with two grouped blocks and bold totals; unaudited note at bottom.
Common questions about this slide and the underlying presentation content.
It is Sea Limited's 21-slide second-quarter 2026 results deck from August 2026. It covers group revenue (US$7.8B), operating income (US$650.3M), net income (US$458.1M) and adjusted EBITDA (US$917.2M), then reviews Shopee, Monee and Garena individually and closes with GAAP-to-non-GAAP reconciliation tables.
Shopee reported GMV of US$38.3B (up 28% YoY), 4.2B gross orders, GAAP revenue of US$5.6B (up 48.2% YoY), a 14.6% GAAP take rate and adjusted EBITDA of US$255.4M. Ad revenue grew more than 70% and ShopeeVIP passed 15 million members.
Yes. The gallery page provides the original PDF and a converted PPTX, so you can reuse the layouts — three-period bar charts, combo bar-and-line trend charts, column cards and reconciliation tables — in PowerPoint, Keynote or Google Slides. Converted files may need minor font and spacing touch-ups.
Yes. It shows how to present GMV, gross orders, take rate, revenue mix and EBITDA as a percentage of GMV over five quarters, which are the core metrics investors expect from any marketplace or e-commerce business.
Each segment keeps the same white corporate template but swaps in its own logo and header-rule colour (orange Shopee, blue Monee, red Garena). Each section opens with a text highlights slide followed by two or three KPI charts, and a single segment table ties everything back to the consolidated totals.
A restrained corporate style: white background, light black sans-serif titles under a thin rule, a single blue palette for all charts with the current period in the darkest blue, grey lines for ratios, and a colourful ribbon swoosh only on the cover and section dividers.
Investors and analysts researching Sea Limited, IR and finance teams designing quarterly earnings decks, e-commerce and fintech founders preparing board updates, and designers who need a clean example of financial data visualisation.
Yes. You can use 2Slides to generate a deck in this style from your own figures or report, then edit the charts and text, or use the downloadable PPTX as a starting point for a manual build.

Create Your Own Slides
Turn your ideas into professional presentations in seconds with 2slides AI.
Reference professional designs, choose your style, and generate slides with perfect text rendering. Powered by Nano Banana—start creating your presentation now.
Your AI Agent for slides. Save time, shine faster with intelligent presentation creation.


© 2026 2slides. All rights reserved.