
Part of Investor presentation examples
Chewy Q2 2026 Earnings Presentation: the online pet retailer's second-quarter fiscal 2026 financial results (September 9, 2026), covering net sales of $3.33 billion, Autoship customer sales, net sales per active customer, gross margin, adjusted EBITDA, free cash flow, FY2026 and Q3 guidance, and full non-GAAP reconciliations
Quick Navigation
Tags
Share the slides
Chewy Q2 2026 Earnings Presentation: the online pet retailer's second-quarter fiscal 2026 financial results (September 9, 2026), covering net sales of $3.33 billion, Autoship customer sales, net sales per active customer, gross margin, adjusted EBITDA, free cash flow, FY2026 and Q3 guidance, and full non-GAAP reconciliations
Detailed view of each slide page, including layout, key content and visual elements.
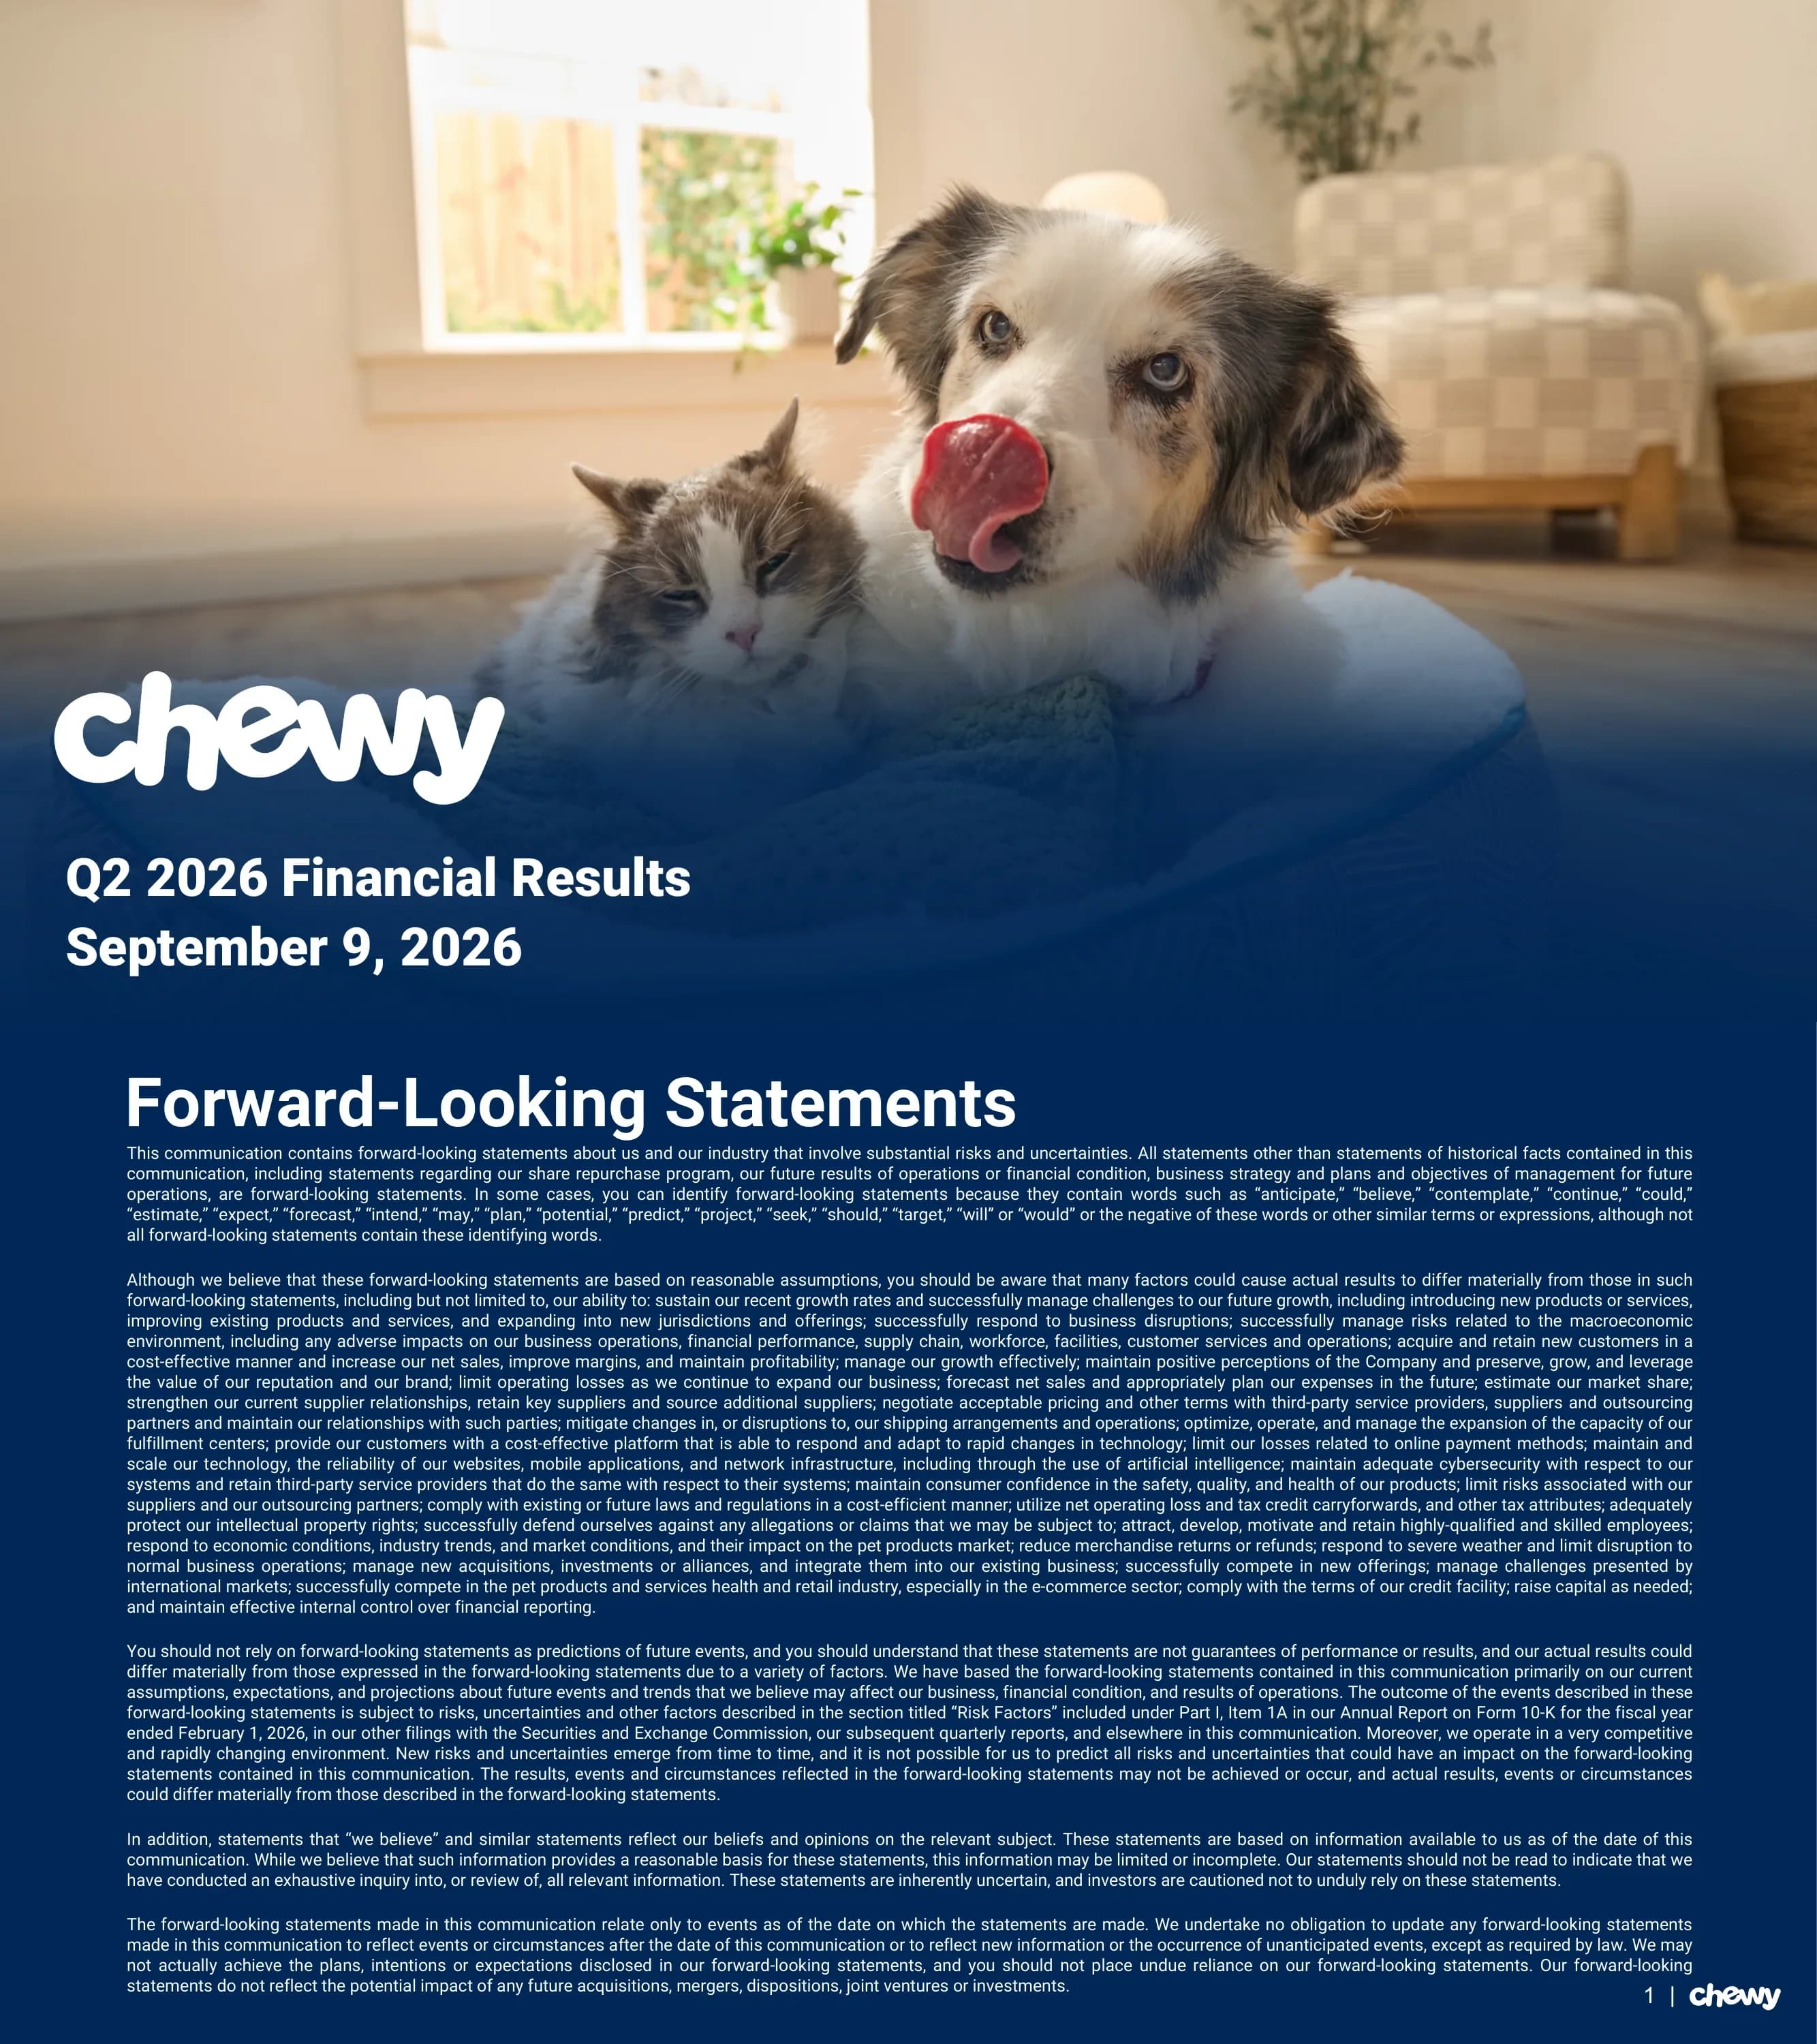
Title slide introducing Chewy's Q2 2026 financial results, dated September 9, 2026, with the white Chewy wordmark over a full-bleed photo of a dog and a cat sharing a pet bed.
Full-bleed lifestyle photograph with a navy gradient fading up from the bottom third; logo and two-line title stacked bottom-left.
Standard safe-harbor disclaimer listing risks such as sustaining growth rates, supply chain and fulfillment capacity, customer acquisition and retention, competition in pet e-commerce, technology and AI reliance, regulation and capital needs, referencing the 10-K for the fiscal year ended February 1, 2026.
Single full-width block of justified small body text under a large white headline on navy; page number and logo in the bottom-right footer.
Quarter scorecard: 208K net sequential active customer adds, $200 million capital returned to shareholders in Q2 26 via buybacks, and financial metrics of $602 net sales per active customer, 84.6% Autoship customer sales as a share of net sales, and $226.7M adjusted EBITDA at a 6.8% margin (+90 bps YoY).
Two rounded outline cards on top, each crowned by a circular icon badge, above a wide rounded panel titled Financial Metrics containing three evenly spaced KPI columns; numbered footnotes at the bottom.
Net sales grew from $11,148M in FY23 to $11,635M in FY24, $12,602M in FY25 and $13,069M LTM; quarterly net sales were $3,104M (Q2 25) rising to $3,330M in Q2 26, with YoY growth of 7.3% in Q2 26 and 5.7% excluding the SmartPak and Modern Animal acquisitions.
Two side-by-side bar charts (Full Year left, Quarterly right) with value labels above bars and a boxed YoY growth strip beneath each chart.
Autoship subscription sales rose from $8,493M in FY23 to $11,007M LTM, and from $2,577M in Q2 25 to $2,817M in Q2 26, growing 9.3% YoY in the latest quarter; Autoship customers are defined as those with a shipped Autoship order in the preceding 364 days.
Same two-panel annual vs quarterly bar chart layout as the net sales slide, with a YoY growth strip under each panel.
NSPAC increased from $555 (FY23) to $567, $591, and $602 in Q2 26 versus $591 in Q2 25, while active customers grew to 21.7 million (including about 43,000 from SmartPak, excluding Modern Animal additions).
Single wide five-bar chart spanning the slide, with an active-customer count strip (in millions) beneath and four footnotes.
Gross margin expanded from 28.4% in FY23 to 29.9% LTM, and was 30.4% in Q2 26, flat with Q2 25; gross profit reached $3,911M LTM and $1,011M in each of Q1 and Q2 26.
Two-panel bar chart (annual percentages left, quarterly right) with gross profit dollar strips in italics underneath.
Adjusted EBITDA climbed from $368M (3.3% margin) in FY23 to $823M (6.3%) LTM; quarterly it was $227M in Q2 26 at a 6.8% margin versus $183M and 5.9% in Q2 25, after a $253M (7.5%) Q1 26.
Two-panel annual vs quarterly bar charts with a % margin strip under each panel.
Free cash flow rose from $343M in FY23 to $568M LTM; quarterly FCF was $90M in Q2 26 versus $106M in Q2 25, and the quarter closed with a $612M cash balance including marketable securities.
Two-panel bar charts with a single full-width outlined callout box for the cash balance beneath.
Fiscal 2026 guidance of $13.46–$13.57 billion net sales (about 6.8%–7.7% growth, 5.5%–6.3% ex-acquisitions) and 6.7%–6.8% adjusted EBITDA margin; Q3 2026 guidance of $3.323–$3.358 billion net sales (6.6%–7.7% growth, 5.3%–6.2% ex-acquisitions) and 6.6%–6.7% adjusted EBITDA margin.
Left third is a vertical photo of a cat in a party hat sitting in a Chewy box; right two-thirds hold two light-blue section bars (Fiscal Year 2026, Fiscal Third Quarter 2026) each followed by label/value outline box pairs.
Explains the non-GAAP measures used (adjusted EBITDA and margin, adjusted net income and EPS, free cash flow), what each excludes, and their limitations, noting adjusted net income excludes transaction-related costs from Q1 2026 onward.
Headline plus several stacked text paragraphs on navy, occupying the top two-thirds of the slide.
Table reconciling net income to adjusted EBITDA for the last five quarters, LTM and fiscal 2023–2025: Q2 26 net income of $80.5M plus D&A, $85.9M share-based compensation, taxes and a $(24.0)M legal settlement gain yields $226.7M adjusted EBITDA on $3,330.2M net sales (2.4% net margin, 6.8% adjusted EBITDA margin).
Subtitle and intro sentence above a wide financial table grouped into Fiscal Quarter Ended, LTM and Fiscal Year column groups separated by vertical rules.
Reconciles net income to adjusted net income ($148.8M in Q2 26 vs $141.1M in Q2 25) and shows weighted-average shares (410.1M diluted) with GAAP diluted EPS of $0.20 and adjusted diluted EPS of $0.36 for the quarter, plus FY2023–2025 comparisons.
Wide reconciliation table with quarter and fiscal-year column groups, share count rows and EPS rows at the bottom.
Reconciles operating cash flow to free cash flow: Q2 26 operating cash of $137.4M less $47.9M capex gives $89.5M FCF; LTM FCF is $568.1M and FY2025 was $562.4M, with a note that capex for fulfillment, pharmacy, vet clinics and technology drives period-to-period variation.
Short three-row reconciliation table in the upper half, explanatory paragraph in the lower half.
Brand sign-off with the centered Chewy wordmark over a navy-tinted photo of a small long-haired dog eating from a blue bowl.
Full-bleed photograph with a heavy navy color overlay and a centered white logo; no text beyond the logo.
Common questions about this slide and the underlying presentation content.
It covers Chewy's second quarter of fiscal 2026, reported on September 9, 2026: key highlights, net sales, Autoship customer sales, net sales per active customer, gross margin, adjusted EBITDA, free cash flow, FY2026 and Q3 guidance, and non-GAAP reconciliations, in 15 slides.
Net sales were $3.33 billion (up 7.3% YoY, 5.7% excluding acquisitions), adjusted EBITDA was $226.7 million at a 6.8% margin (+90 bps), Autoship sales were 84.6% of net sales, active customers reached 21.7 million and net sales per active customer was $602.
Chewy guided fiscal 2026 net sales to $13.46–$13.57 billion with a 6.7%–6.8% adjusted EBITDA margin, and Q3 2026 net sales to $3.323–$3.358 billion with a 6.6%–6.7% adjusted EBITDA margin.
Yes. The gallery page offers both the original PDF and an editable PPTX version, so you can study the layout or reuse the chart and table structure in your own deck.
Yes. Its repeating layout of annual bars beside quarterly bars, with a growth or margin strip underneath, works for any retailer or subscription business, and the Autoship and NSPAC slides show how to present recurring revenue and customer value.
A deep navy background with white bold headings, light-blue bars and a royal-blue highlight for the current or comparison period, rounded outline cards on the highlights slide, and warm pet photography reserved for the cover, guidance and closing slides.
Because it reports adjusted EBITDA, adjusted net income, adjusted EPS and free cash flow, SEC rules require reconciliation to the closest GAAP measures. The three appendix tables are a useful reference format for any company presenting non-GAAP metrics.
Use this deck as a structural reference, then generate your own slides with 2Slides: describe your quarter's metrics or upload your financial summary, and pick a dark, data-focused style to get a comparable KPI-driven layout.

Create Your Own Slides
Turn your ideas into professional presentations in seconds with 2slides AI.
Reference professional designs, choose your style, and generate slides with perfect text rendering. Powered by Nano Banana—start creating your presentation now.
Your AI Agent for slides. Save time, shine faster with intelligent presentation creation.


© 2026 2slides. All rights reserved.