
Semiconductor collection
Semiconductor investor presentation examples
Earnings decks, investor days and keynotes from chip designers, memory makers and the companies that build the fab equipment, exactly as they were published for investors. Every slide is readable on the page before you download anything.
- Decks
- 21
- Slides
- 1,304
- Last added
- 2026-10-22


Earnings presentations
14 decksQuarterly results decks: revenue by end market, gross margin, operating expenses and the guidance for next quarter.
Lam Research September Quarter 2026 Earnings Presentation
26 slides
Micron FQ4 2026 Earnings Presentation
51 slides
Arm Q1 FY27 Investor Presentation
35 slides
NXP Semiconductors Q2 2026 Earnings Presentation
41 slides

onsemi Q2 2026 Investor Presentation
27 slides
Applied Materials Q3 FY26 Earnings Presentation
35 slides
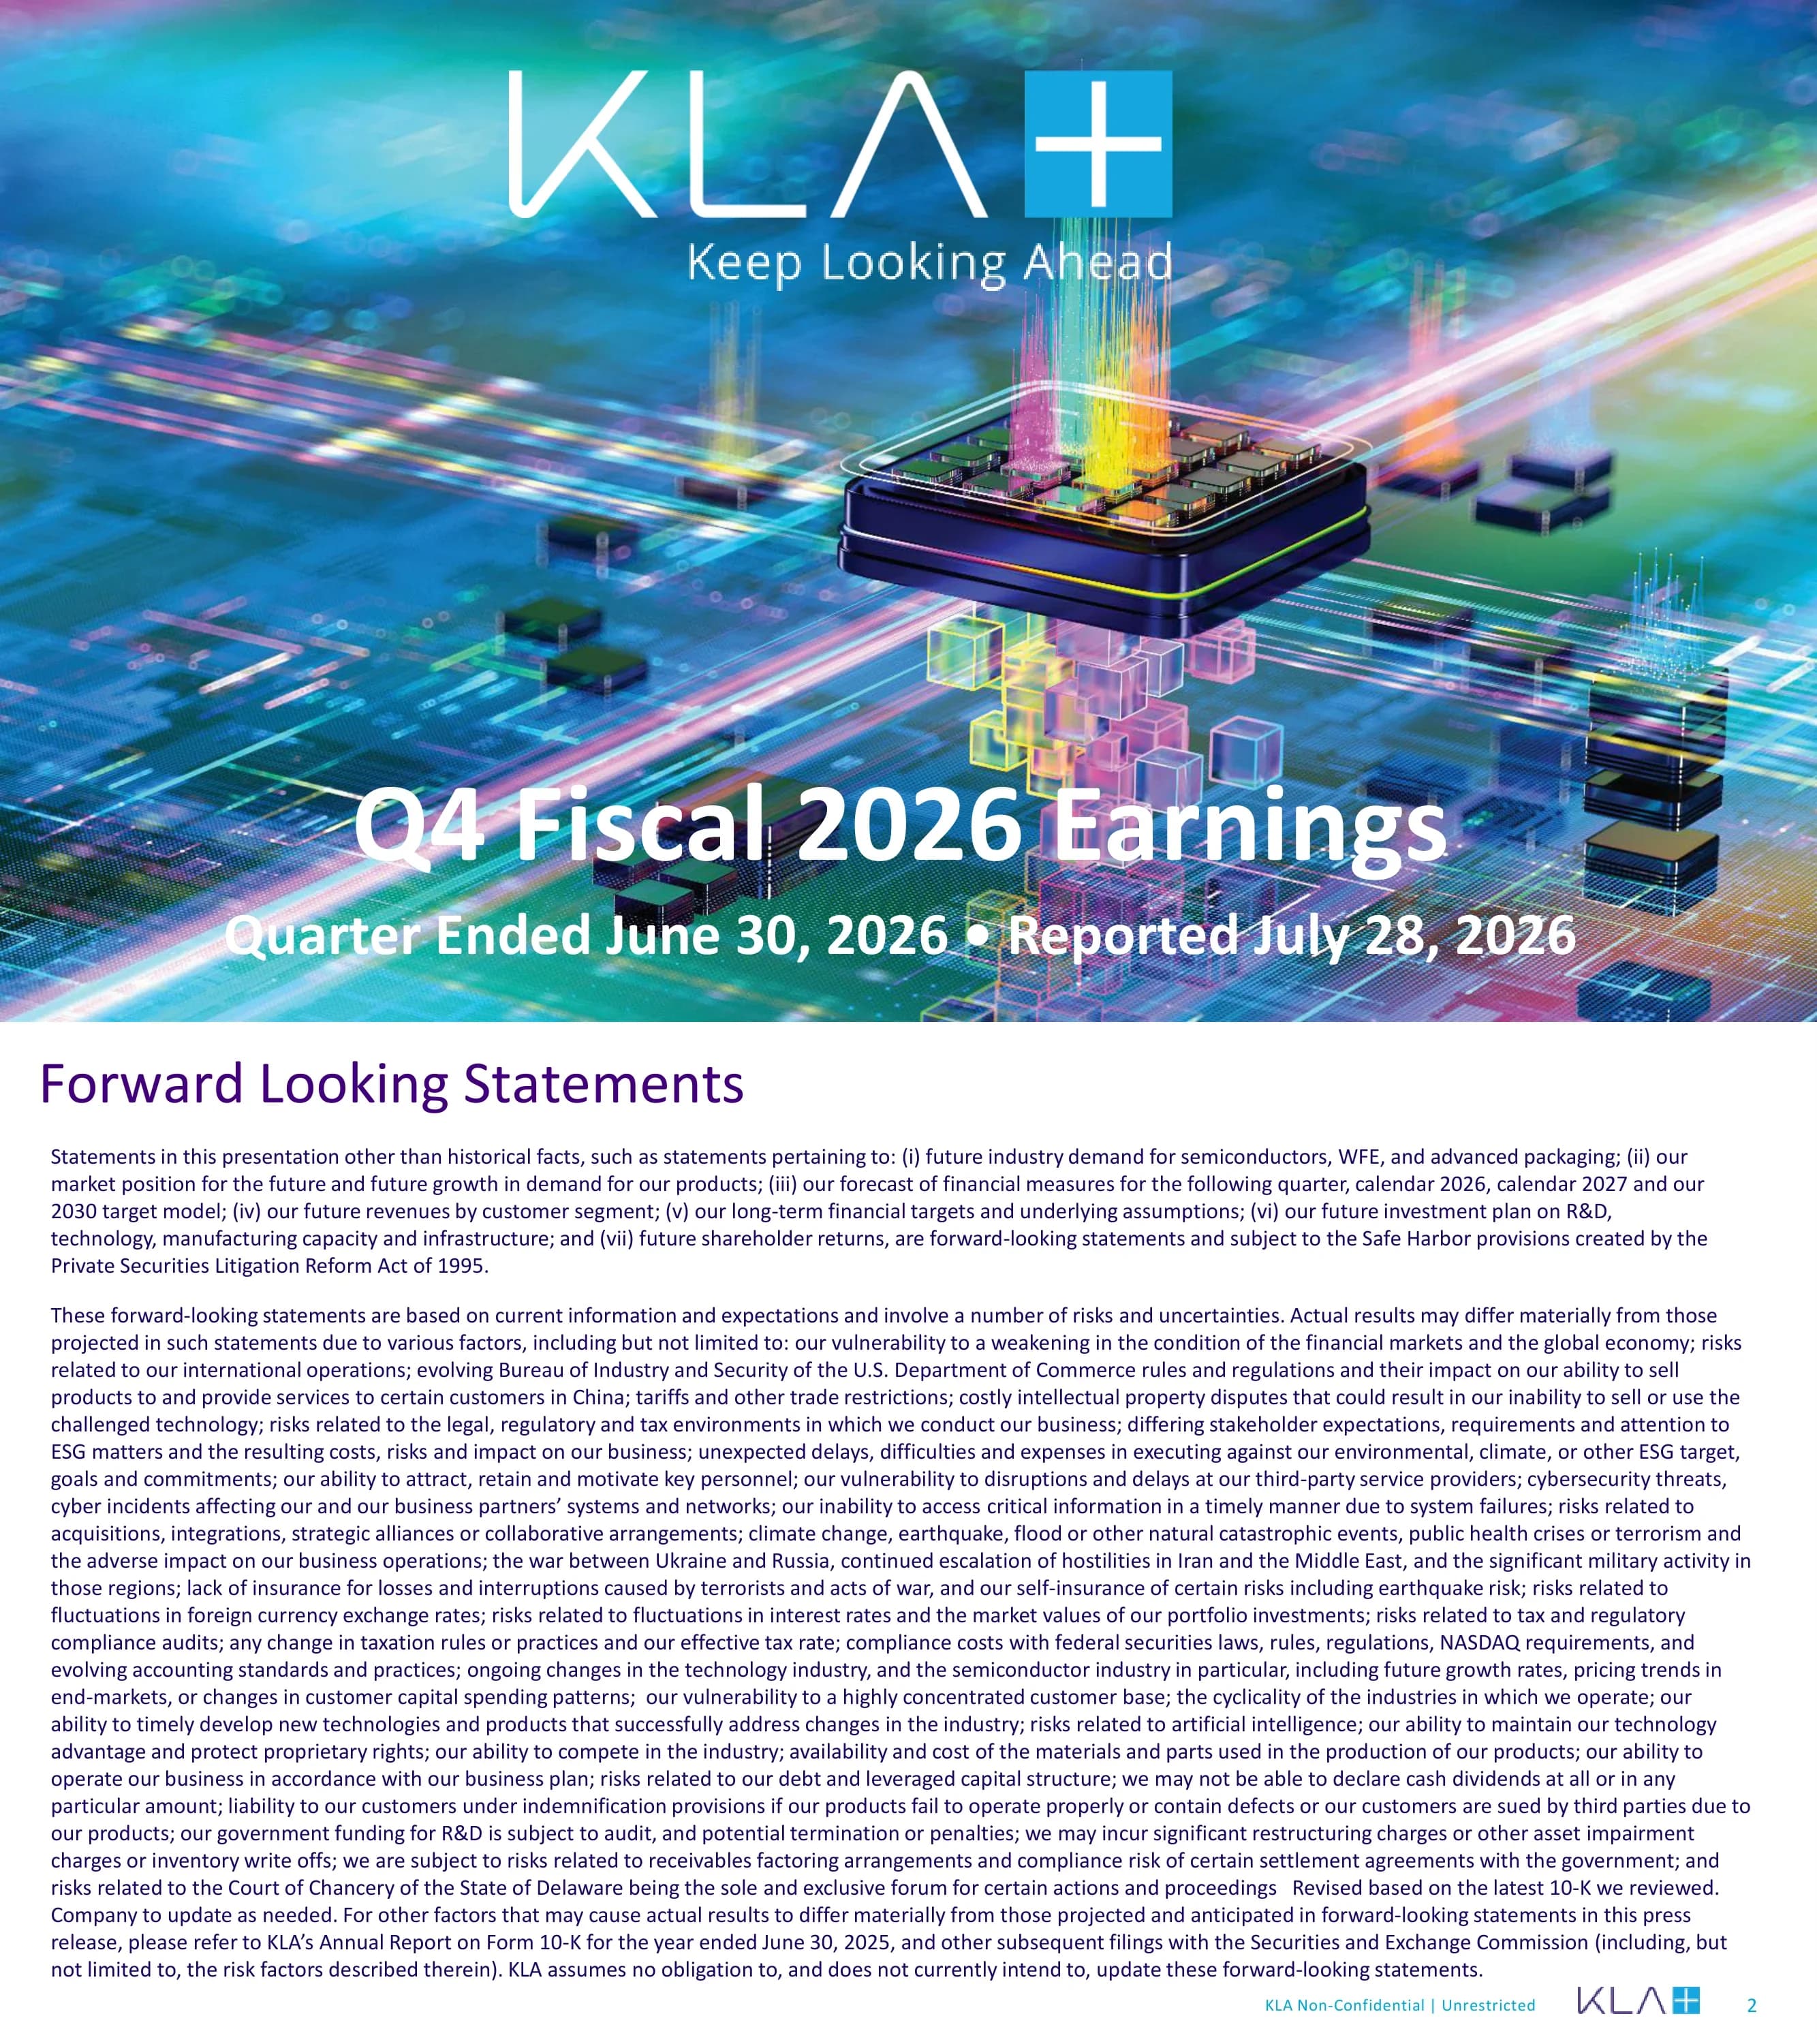
KLA Q4 FY26 Earnings Presentation
18 slides
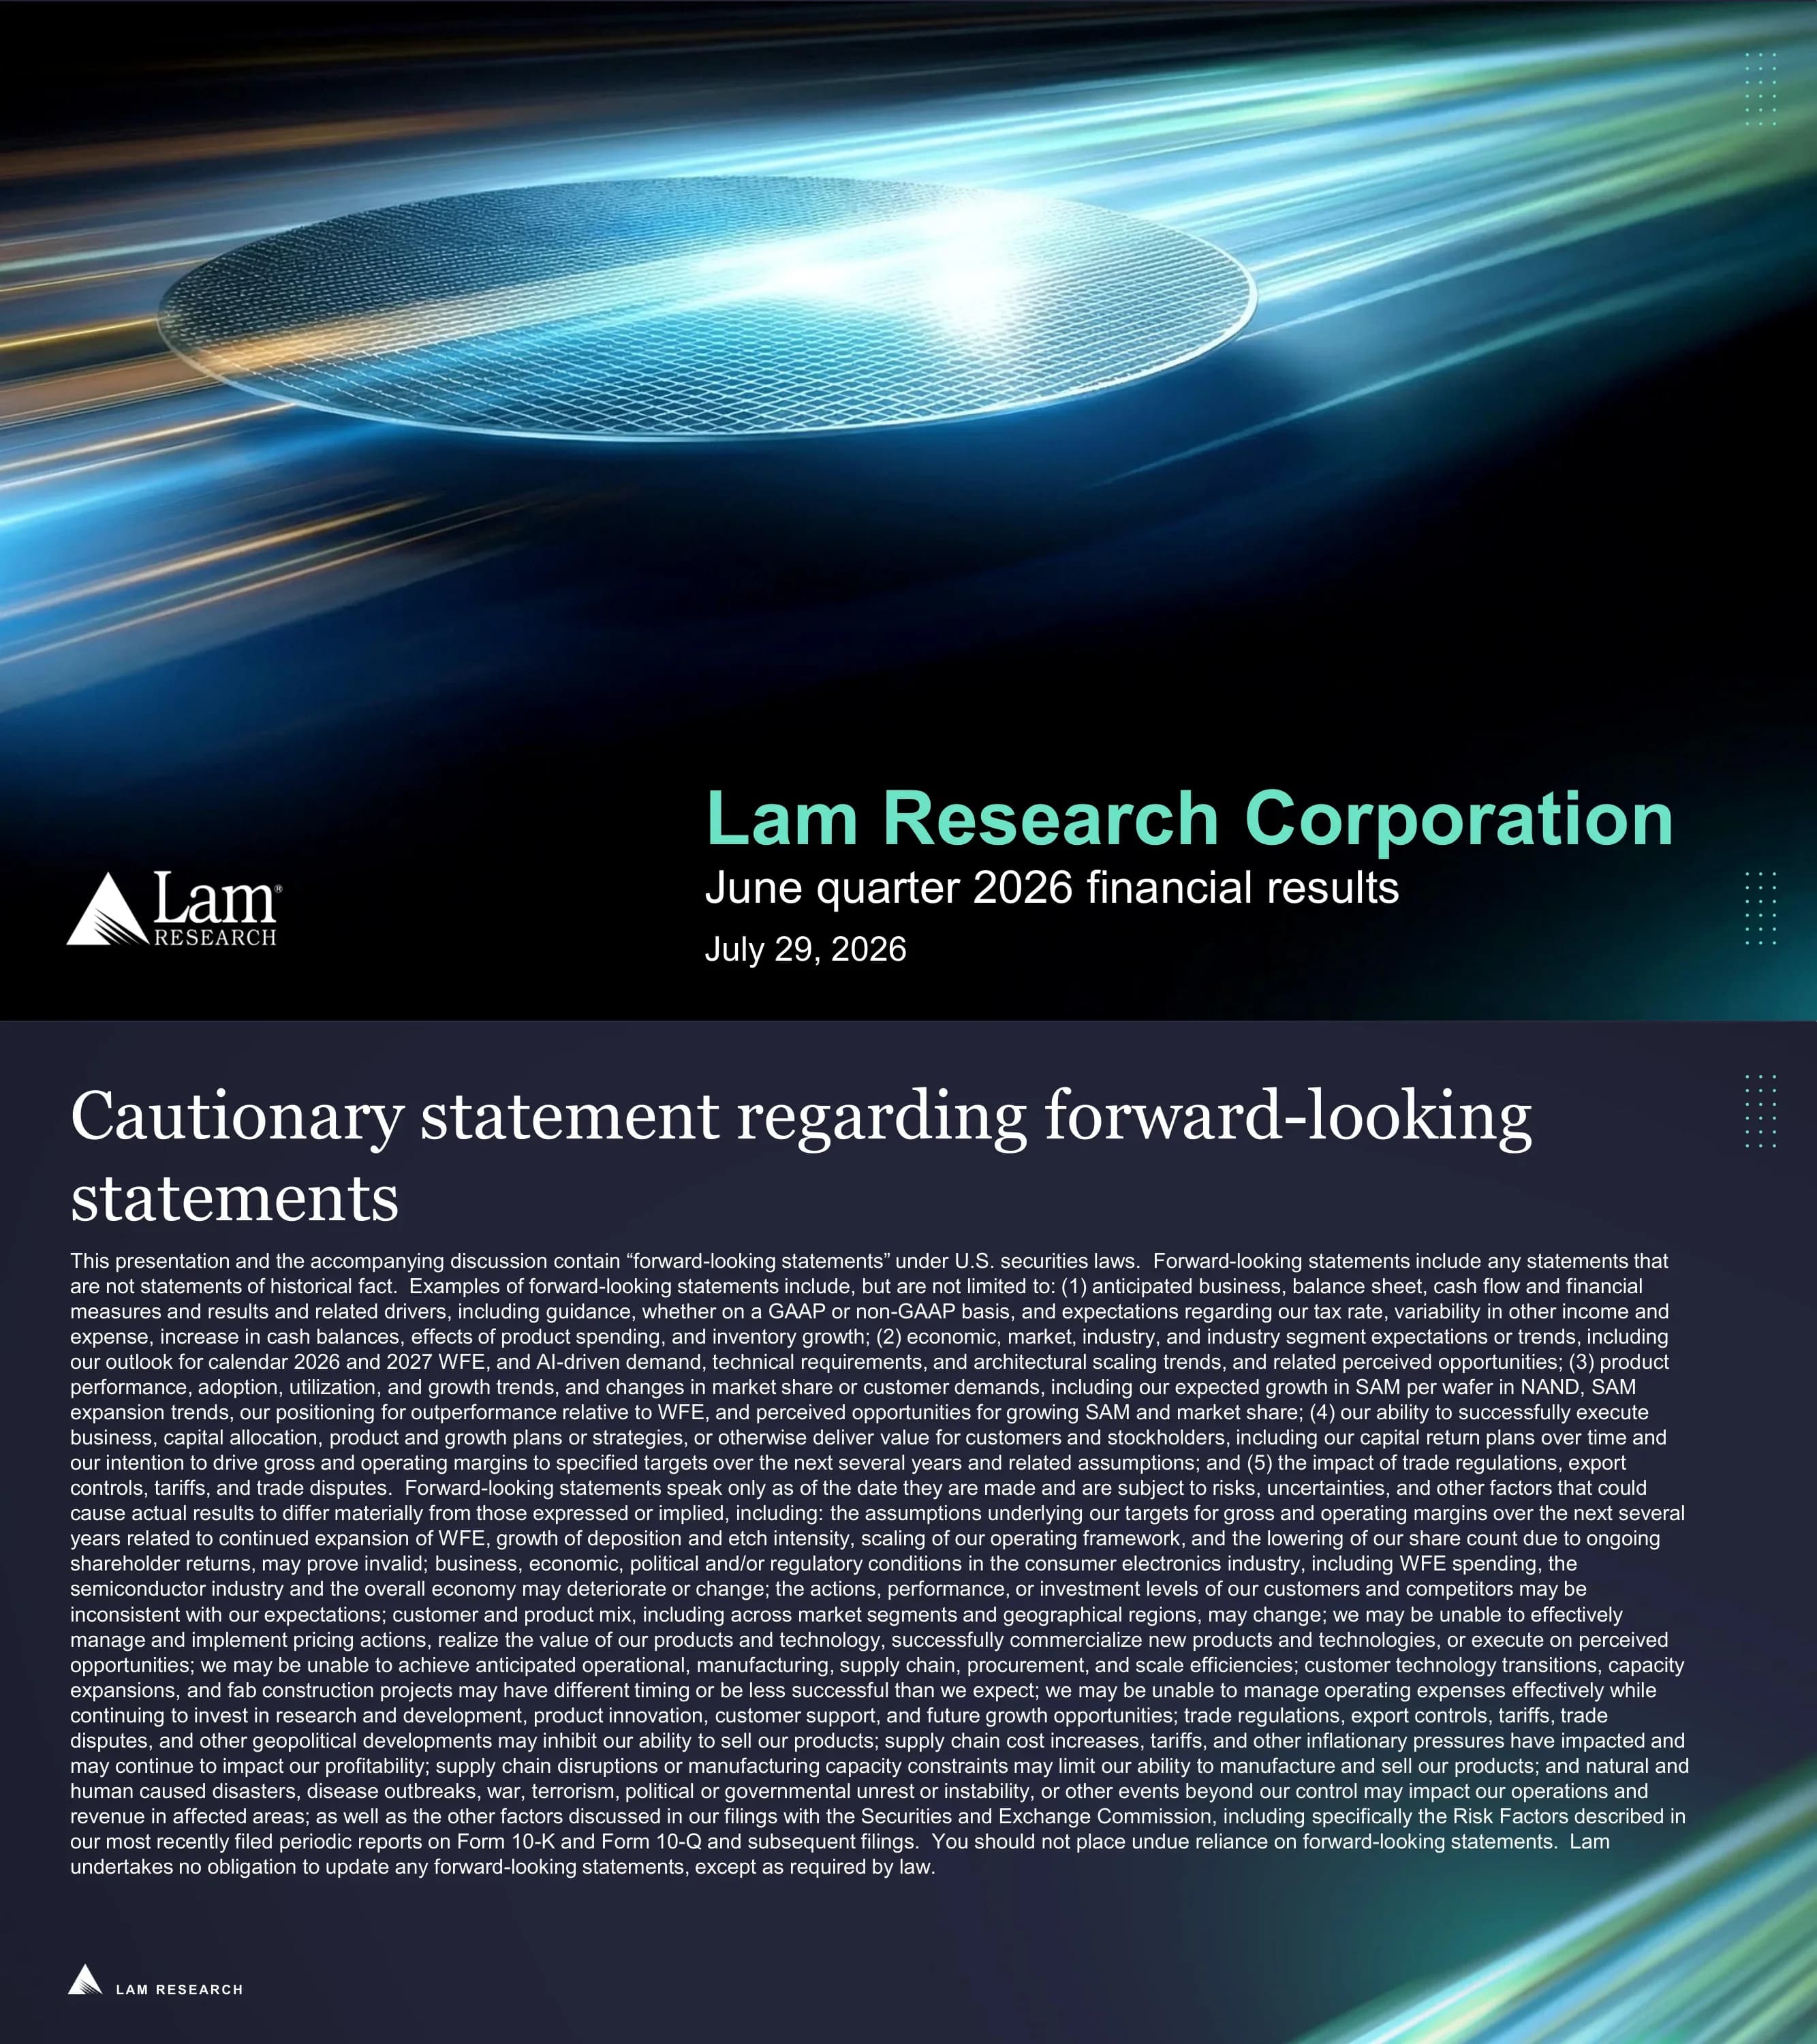
Lam Research June Quarter 2026 Earnings Presentation
27 slides
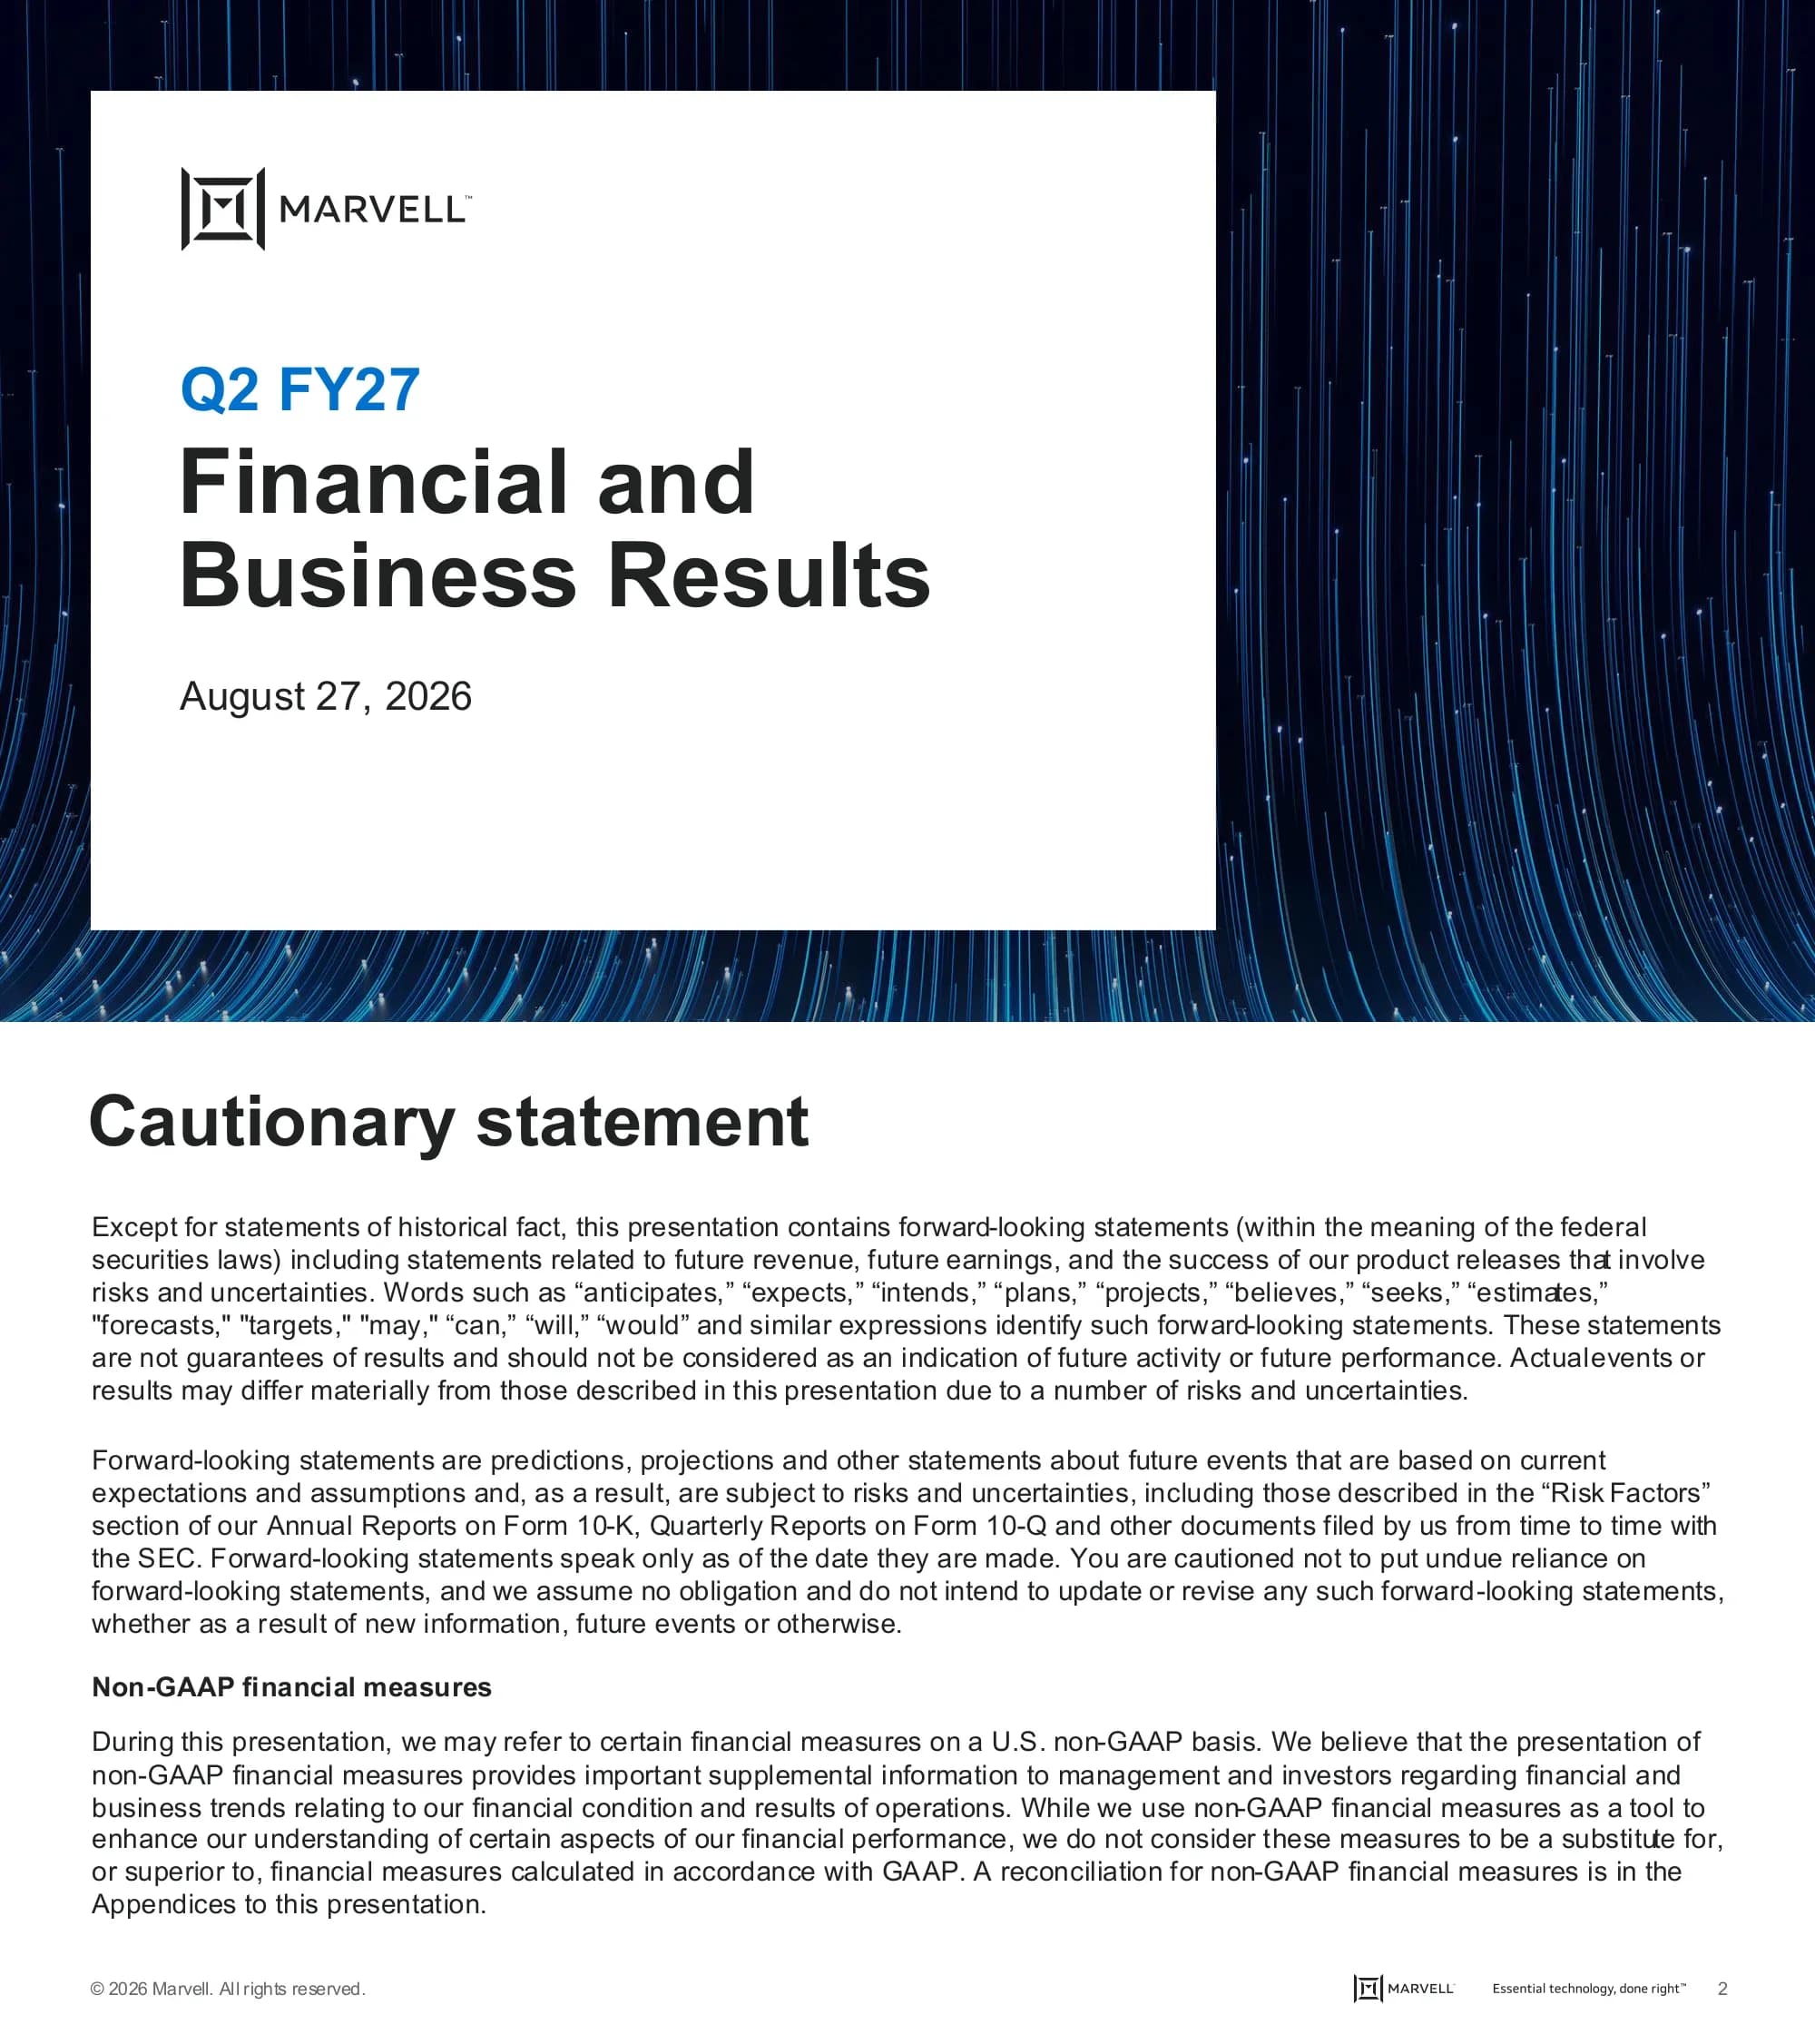
Marvell Q2 FY27 Earnings Presentation
36 slides
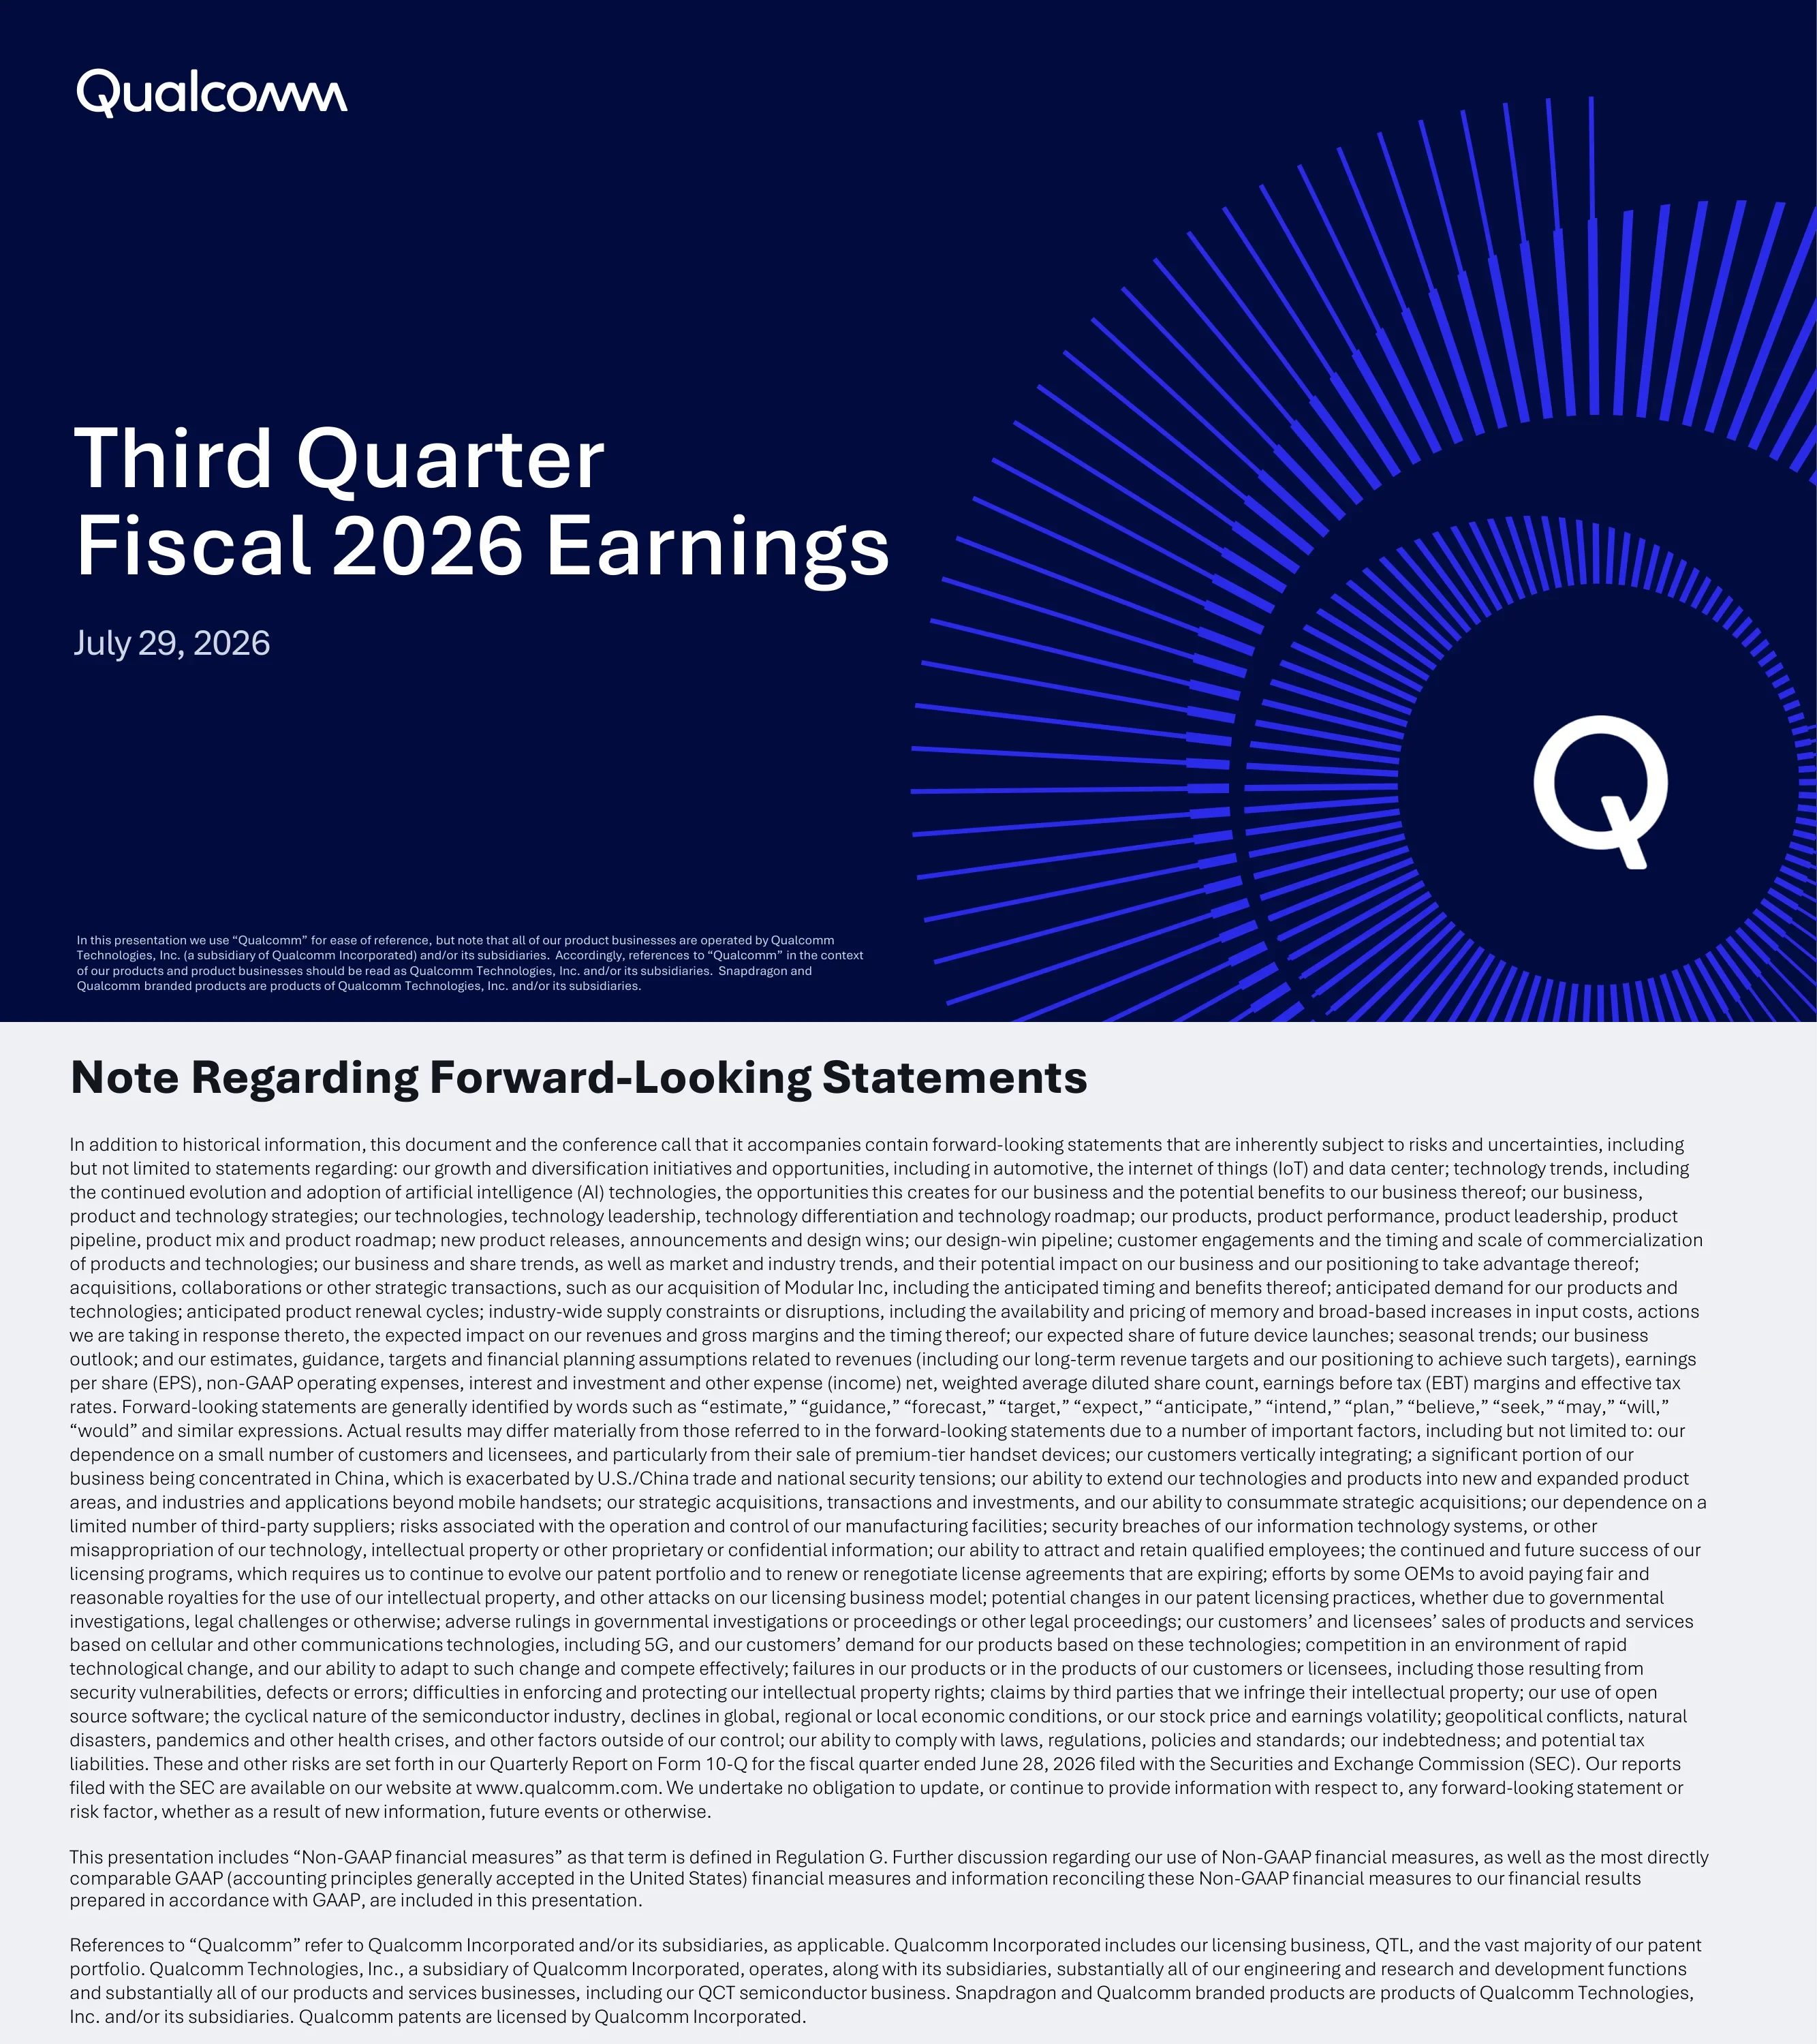
Qualcomm Q3 FY26 Earnings Presentation
32 slides
NVIDIA Q2 FY27 Investor Presentation
17 slides
Micron FQ3 2026 Earnings Presentation
44 slides
AMD Q2 2026 Earnings Presentation
27 slides
Intel Q2 2026 Earnings Presentation
16 slides
Investor days & strategy decks
6 decksLong-term models, market sizing, product roadmaps and capital return plans, from investor days, capital management calls and company overviews.

Keynotes
1 decksProduct and technology keynotes, where chip companies present their platforms to customers and developers.

How chip companies present to investors
Semiconductor revenue rises and falls with inventory cycles, capital spending and new product ramps, so investors read these decks for the direction of travel as much as for the quarter. Most results decks open with revenue and gross margin, split revenue by end market (data centre, PC, mobile, automotive, industrial), and close with guidance as a range. Equipment suppliers add wafer fab equipment spending and their share of it; memory makers add bit growth and pricing. Investor days set out the long-term model: revenue growth, gross margin and operating margin targets, and how much cash goes back to shareholders.
Chip companies explain a cyclical business to people who know the cycle well. Their decks show how to split revenue by end market, how to talk about gross margin when utilisation moves, and how to put a long-term model next to a quarter that may not match it. The investor day decks go further: total addressable market, product roadmaps and the financial targets for the next three to five years.
Anatomy of a semiconductor earnings deck
- 01
Headline results
Revenue, gross margin and earnings per share against last quarter, last year and the guidance.
- 02
End-market split
Revenue by market such as data centre, PC, mobile, automotive and industrial, with the trend for each.
- 03
Margin and spending
Gross margin drivers, operating expenses and R&D, often against the long-term model.
- 04
Cash and capital return
Free cash flow, capital expenditure, buybacks and dividends.
- 05
Guidance
Next quarter's revenue and margin as a range, with the assumptions behind it.
Frequently asked questions
Where do these semiconductor presentations come from?
- They are the files each company published on its own investor relations site. Nothing on the slides is redrawn, summarised or reconstructed.
Which companies are included?
- Chip designers such as NVIDIA, AMD, Qualcomm, Marvell and Arm; memory makers such as Micron; analog and power companies such as Texas Instruments, Analog Devices, onsemi and NXP; and equipment suppliers such as Applied Materials, Lam Research, KLA and ASML. New companies are added as they publish.
Can I use one as a template?
- Download the PPTX and reuse the layouts, chart types and section order. Replace the figures and branding with your own: the logos, trademarks and reported numbers belong to the companies that published them.
How often are new decks added?
- Decks are checked after every earnings season and added within days of publication. Investor days and keynotes are added when they happen.
Turn your results into an investor deck
Upload your financial statements, a spreadsheet or last quarter's report, and 2Slides drafts the presentation for you: headline results, market split, margin bridge and guidance, ready to edit.


