
Japan collection
Japanese investor presentation examples
Earnings presentations (決算説明資料) from large Japanese companies, exactly as they were filed with the Tokyo Stock Exchange. The slides are in Japanese; each page on 2Slides comes with an English summary of every slide.
- Decks
- 4
- Slides
- 153
- Last added
- 2026-10-22
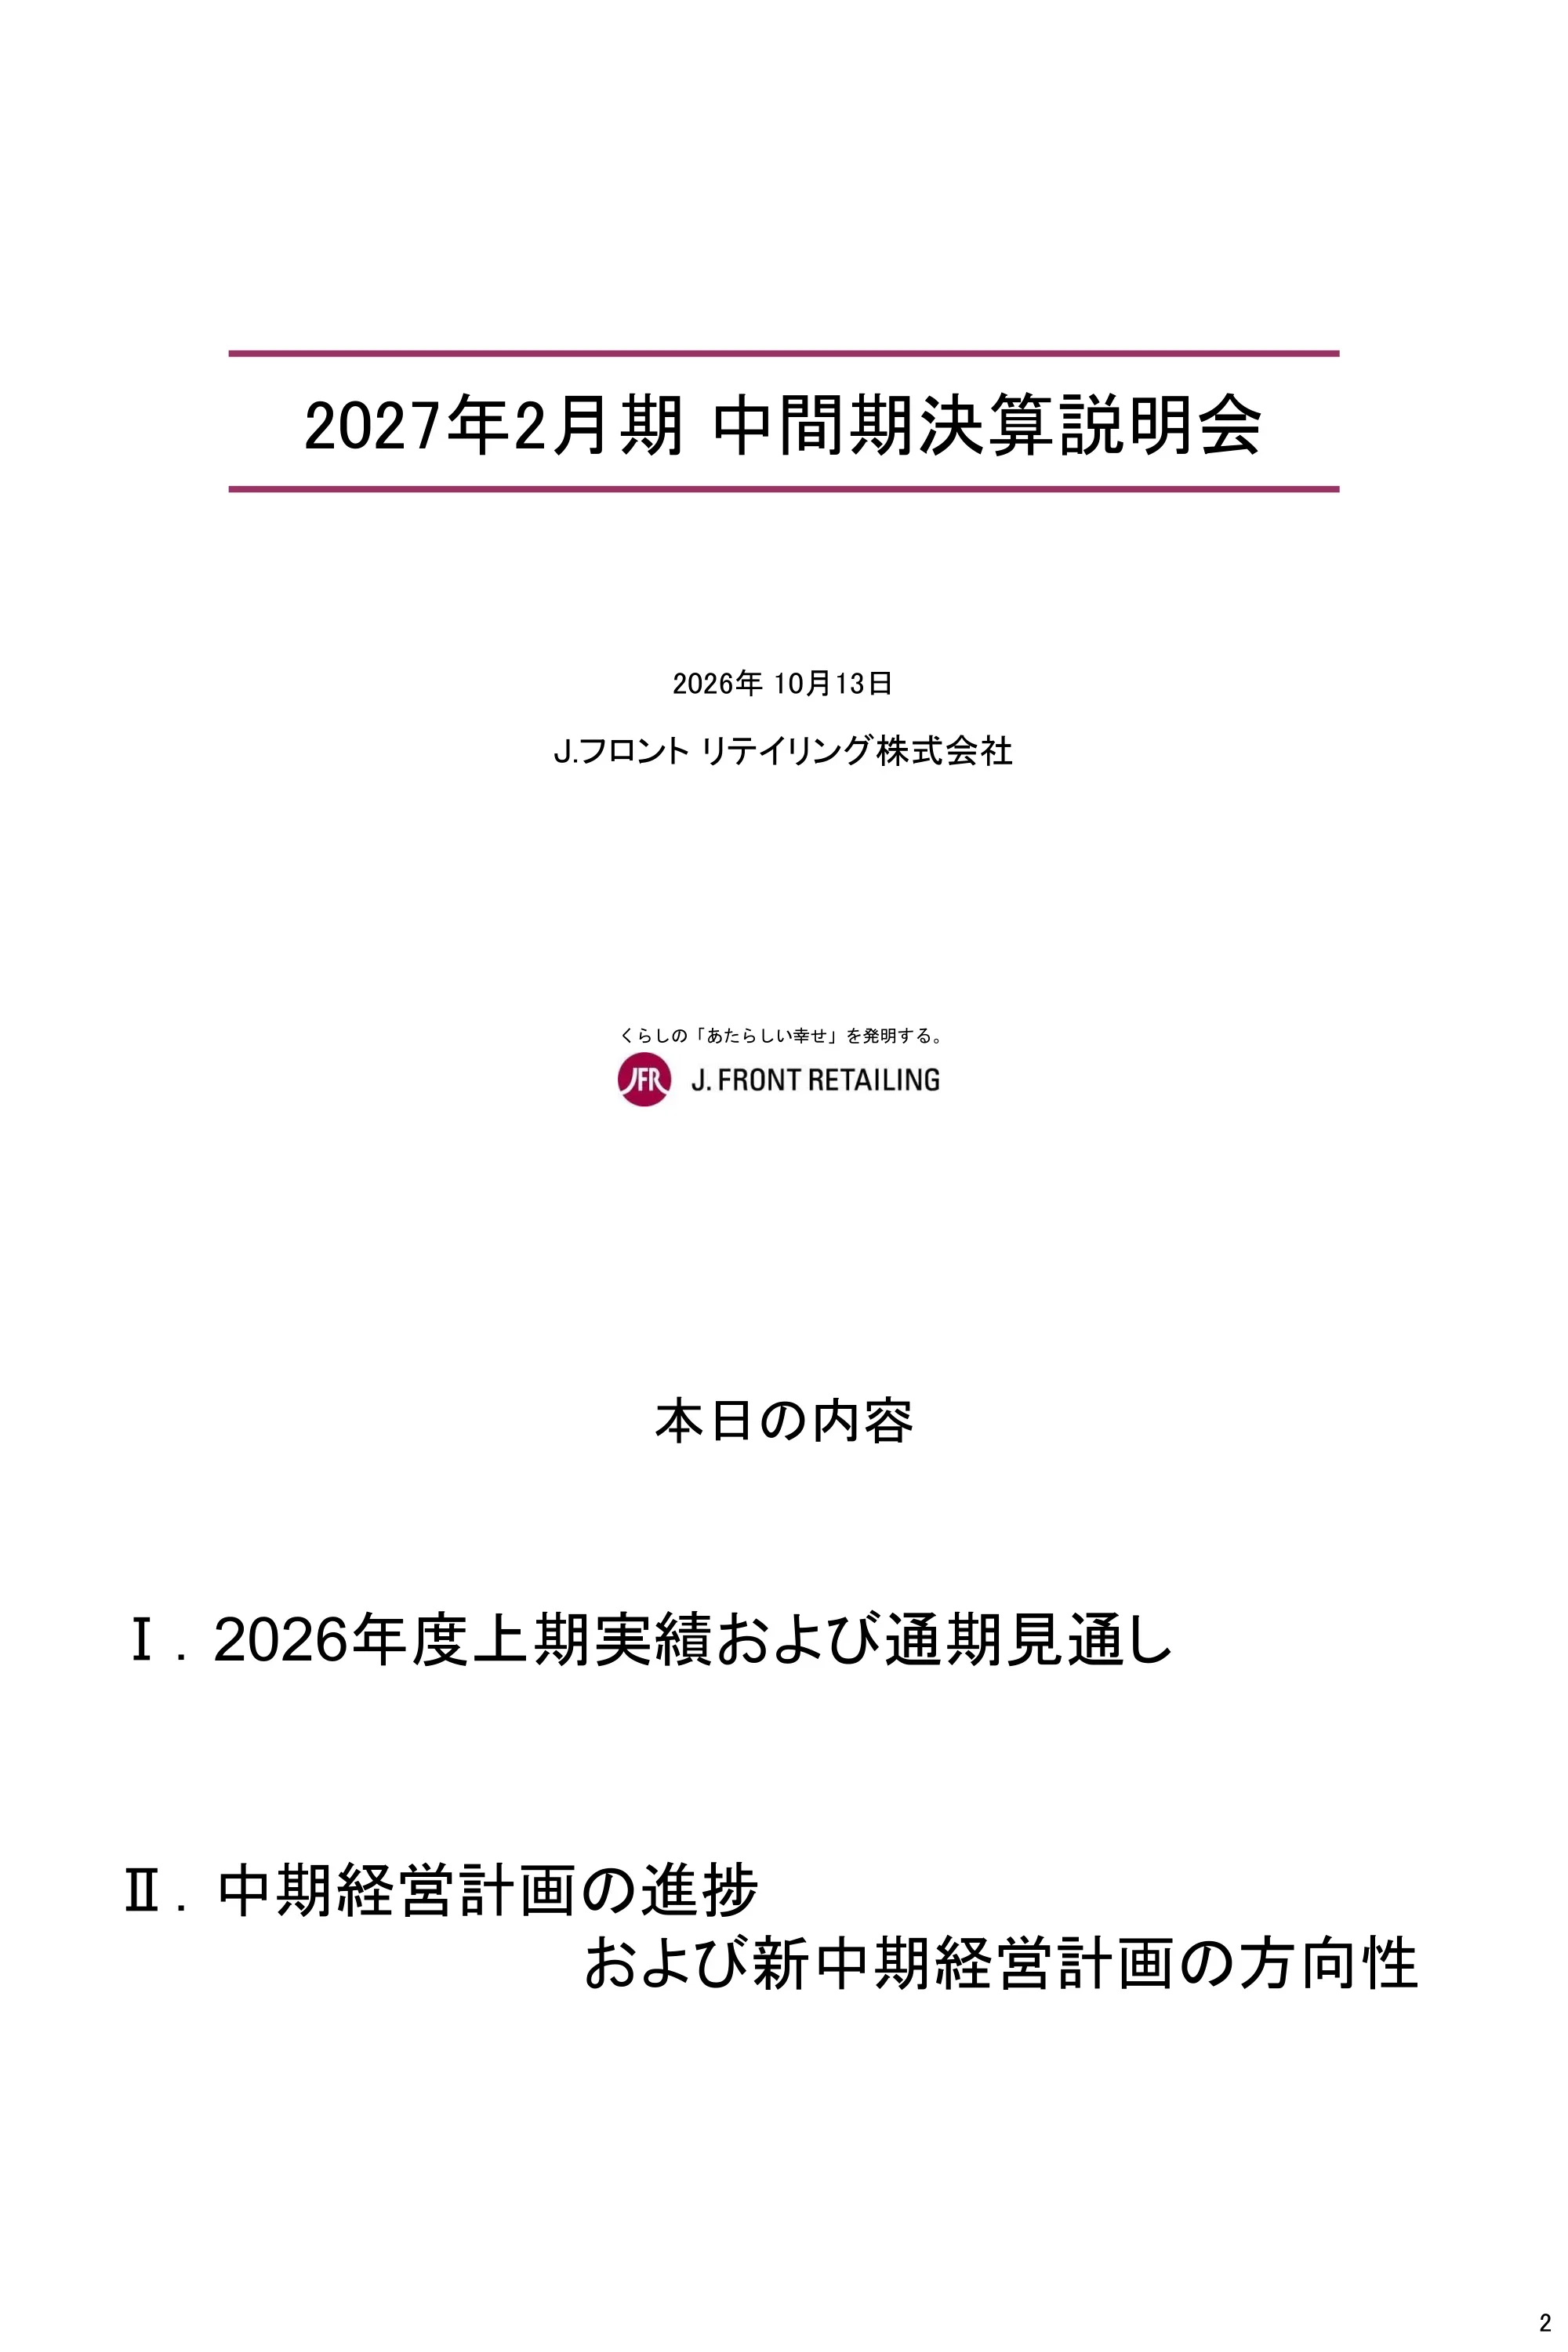
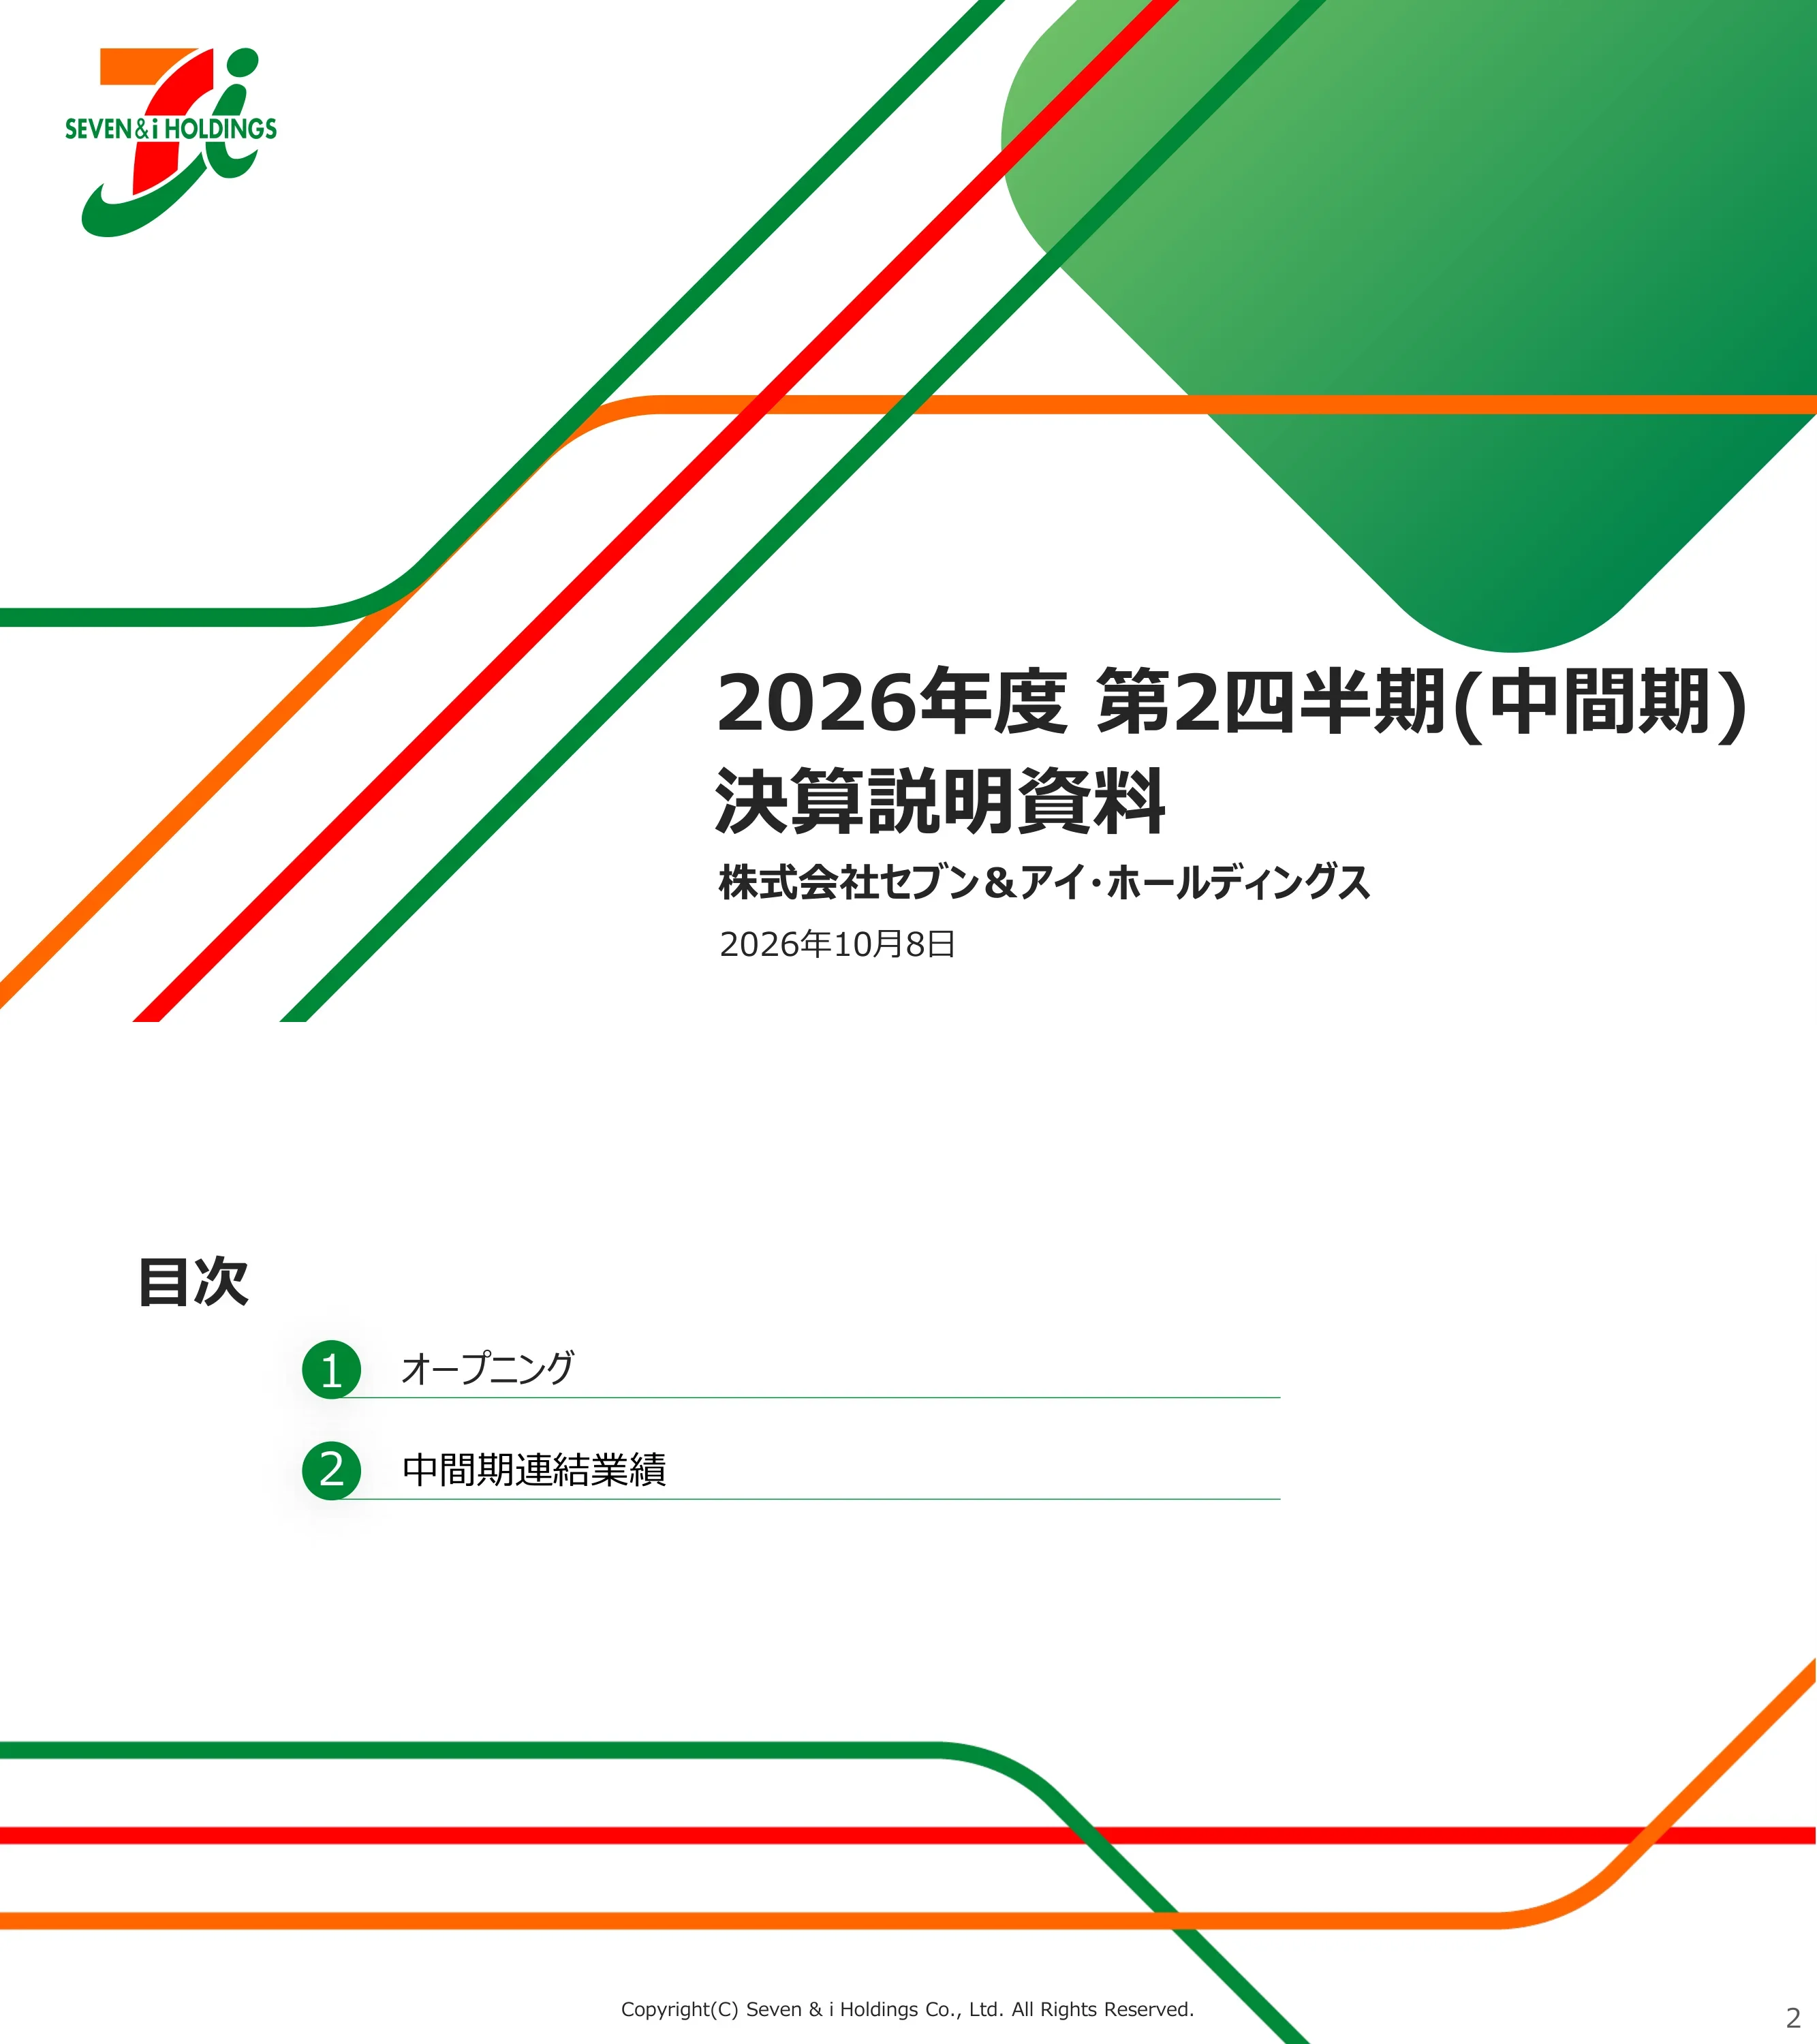
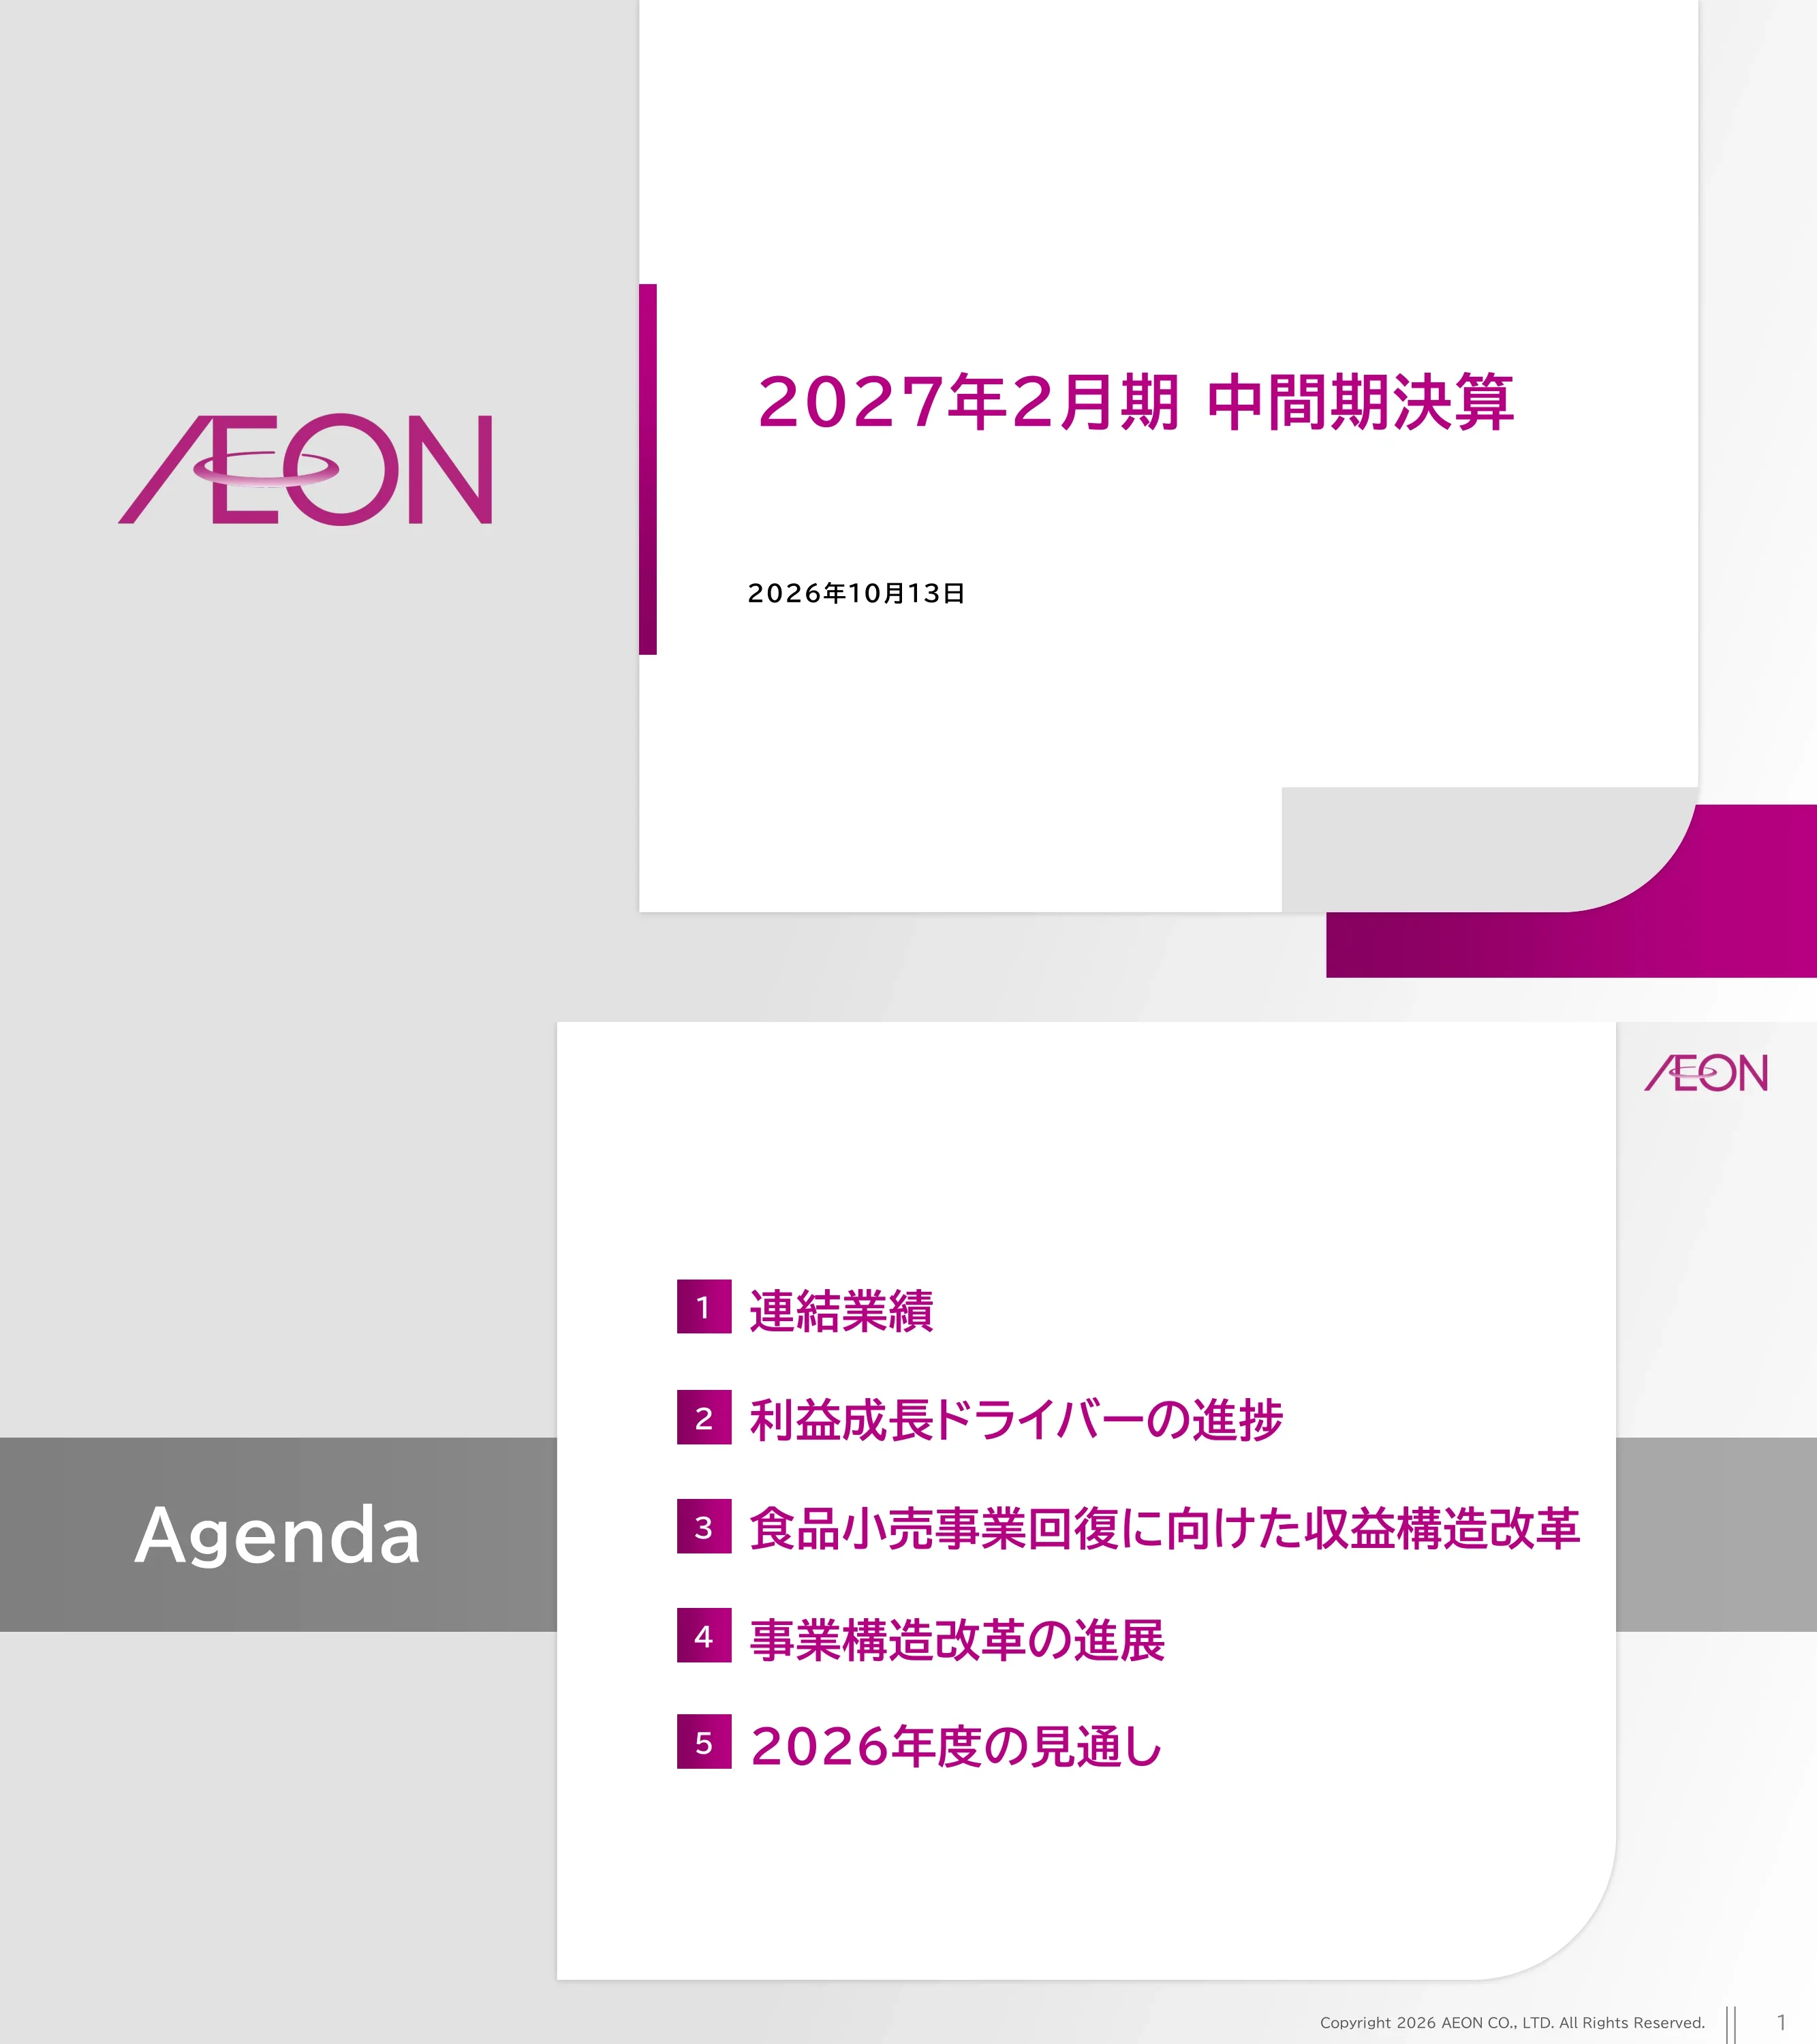
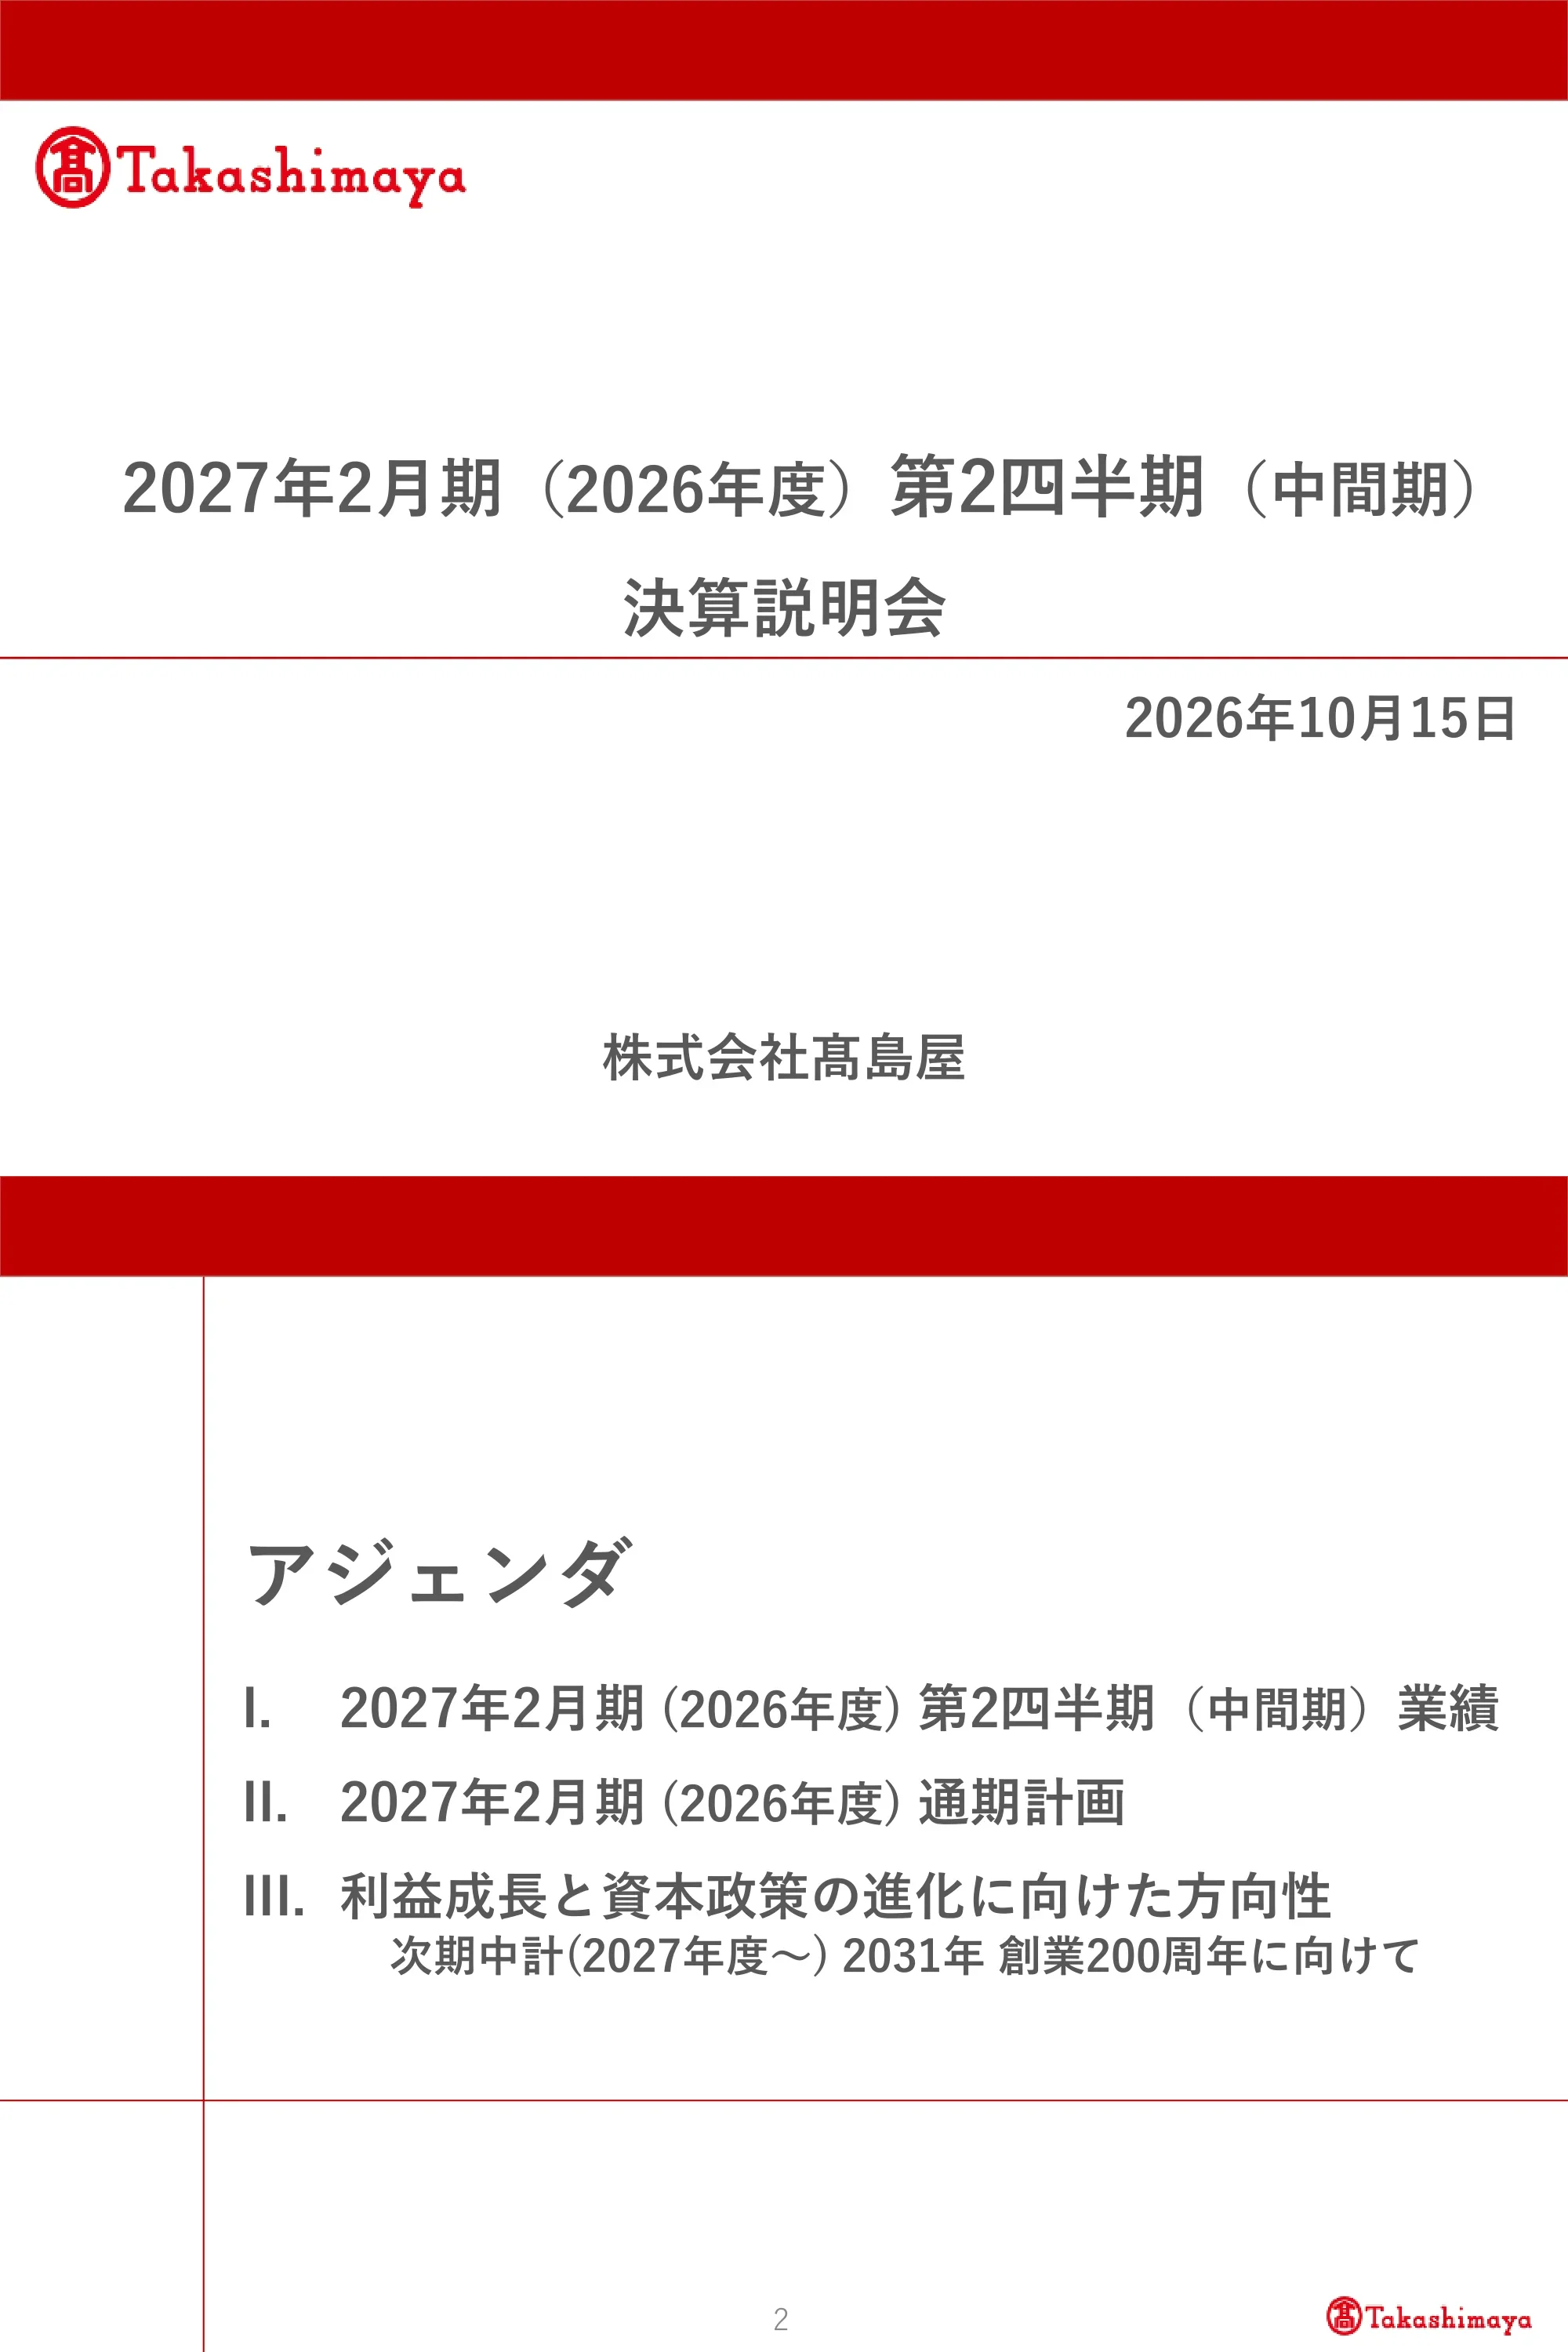
Earnings presentations
4 decksQuarterly, half-year and full-year results decks: results against last year and against plan, segment detail, the forecast and the dividend.
How Japanese companies present results
Listed companies in Japan file their results presentations through TDnet, the Tokyo Stock Exchange's disclosure system, usually on the day of the earnings call. Most follow the same order: a summary page, consolidated results with the change from last year and from the company's plan, a page per business segment, the balance sheet and cash flow, the full-year forecast, and shareholder returns. Half-year decks usually add a progress report on the medium-term plan. Figures are normally in units of ¥100 million (億円), and negative numbers are marked with ▲ rather than a minus sign.
Japanese results decks follow conventions of their own: dense tables that set the result against both last year and the company's own plan, profit bridges by business, and a medium-term plan section in almost every half-year deck. They are a useful reference for anyone presenting to Japanese investors or partners, and for anyone who wants to see how much one slide can hold and still be read.
Anatomy of a Japanese earnings deck
- 01
Summary (サマリー)
The period in one page: sales, operating profit and net profit, and how each compares with plan.
- 02
Results vs last year and plan
A table with both comparisons side by side, often with the variance circled.
- 03
Segment pages
One page per business, with its own profit bridge and the reasons behind it.
- 04
Forecast and dividend
The full-year forecast, any revision, and the planned dividend per share.
- 05
Medium-term plan
Progress on the multi-year targets, usually ROE, operating profit and capital allocation.
Frequently asked questions
Are these presentations in Japanese or English?
- The slides are the original Japanese files. Each deck page on 2Slides includes an English summary of every slide, so you can follow the content without reading Japanese. Some companies also publish an English version on their own investor relations site.
Where do these decks come from?
- They are the presentations the companies filed on TDnet, the Tokyo Stock Exchange's timely disclosure system. Nothing is redrawn or summarised on the slides themselves.
What does 億円 mean in the figures?
- 億円 is ¥100 million, the unit most Japanese companies use in their results. ▲ in front of a number means it is negative.
Why do the fiscal years look off by one?
- Many Japanese companies close their year in February or March. A year ending February 2027 is labelled 2027年2月期, and many of those companies call it fiscal 2026 (2026年度). The deck pages use the company's own label.
Can I use these as a template?
- Download the PPTX and reuse the layouts, table styles and section order. Replace the figures and branding with your own: the logos, trademarks and numbers belong to the companies that published them.
Turn your results into an investor deck
Upload your financial statements, a spreadsheet or last quarter's report, and 2Slides drafts the presentation for you: summary, results tables, segment pages and outlook, ready to edit.


