
Part of Investor presentation examples
Dalrymple Bay Infrastructure Investor Presentation October 2026 — a 22-slide deck lodged with the ASX on 19 October 2026 (cover reads "Investor Presentation — October/November 2026") by Dalrymple Bay Infrastructure (DBI), owner of the Dalrymple Bay Terminal (DBT) in Queensland, the world's largest metallurgical coal export facility by contracted volume. Amounts are in Australian dollars (A$, written $ in the deck). It covers the H1-26 result (six months to 30 June 2026: EBITDA $150.5m, FFO $92.7m, distributions 13.5cps), the take-or-pay Terminal Infrastructure Charge (TIC) model, NECAP organic growth, the 8X expansion option, the investment-grade balance sheet, ESG and appendix financial statements.
Uses this deck’s cover as a style reference for slides made from your own content. Or pick any page below to use its layout as the reference.
Quick Navigation
Tags
Share the slides
Dalrymple Bay Infrastructure Investor Presentation October 2026 — a 22-slide deck lodged with the ASX on 19 October 2026 (cover reads "Investor Presentation — October/November 2026") by Dalrymple Bay Infrastructure (DBI), owner of the Dalrymple Bay Terminal (DBT) in Queensland, the world's largest metallurgical coal export facility by contracted volume. Amounts are in Australian dollars (A$, written $ in the deck). It covers the H1-26 result (six months to 30 June 2026: EBITDA $150.5m, FFO $92.7m, distributions 13.5cps), the take-or-pay Terminal Infrastructure Charge (TIC) model, NECAP organic growth, the 8X expansion option, the investment-grade balance sheet, ESG and appendix financial statements.
Detailed view of each slide page, including layout, key content and visual elements.
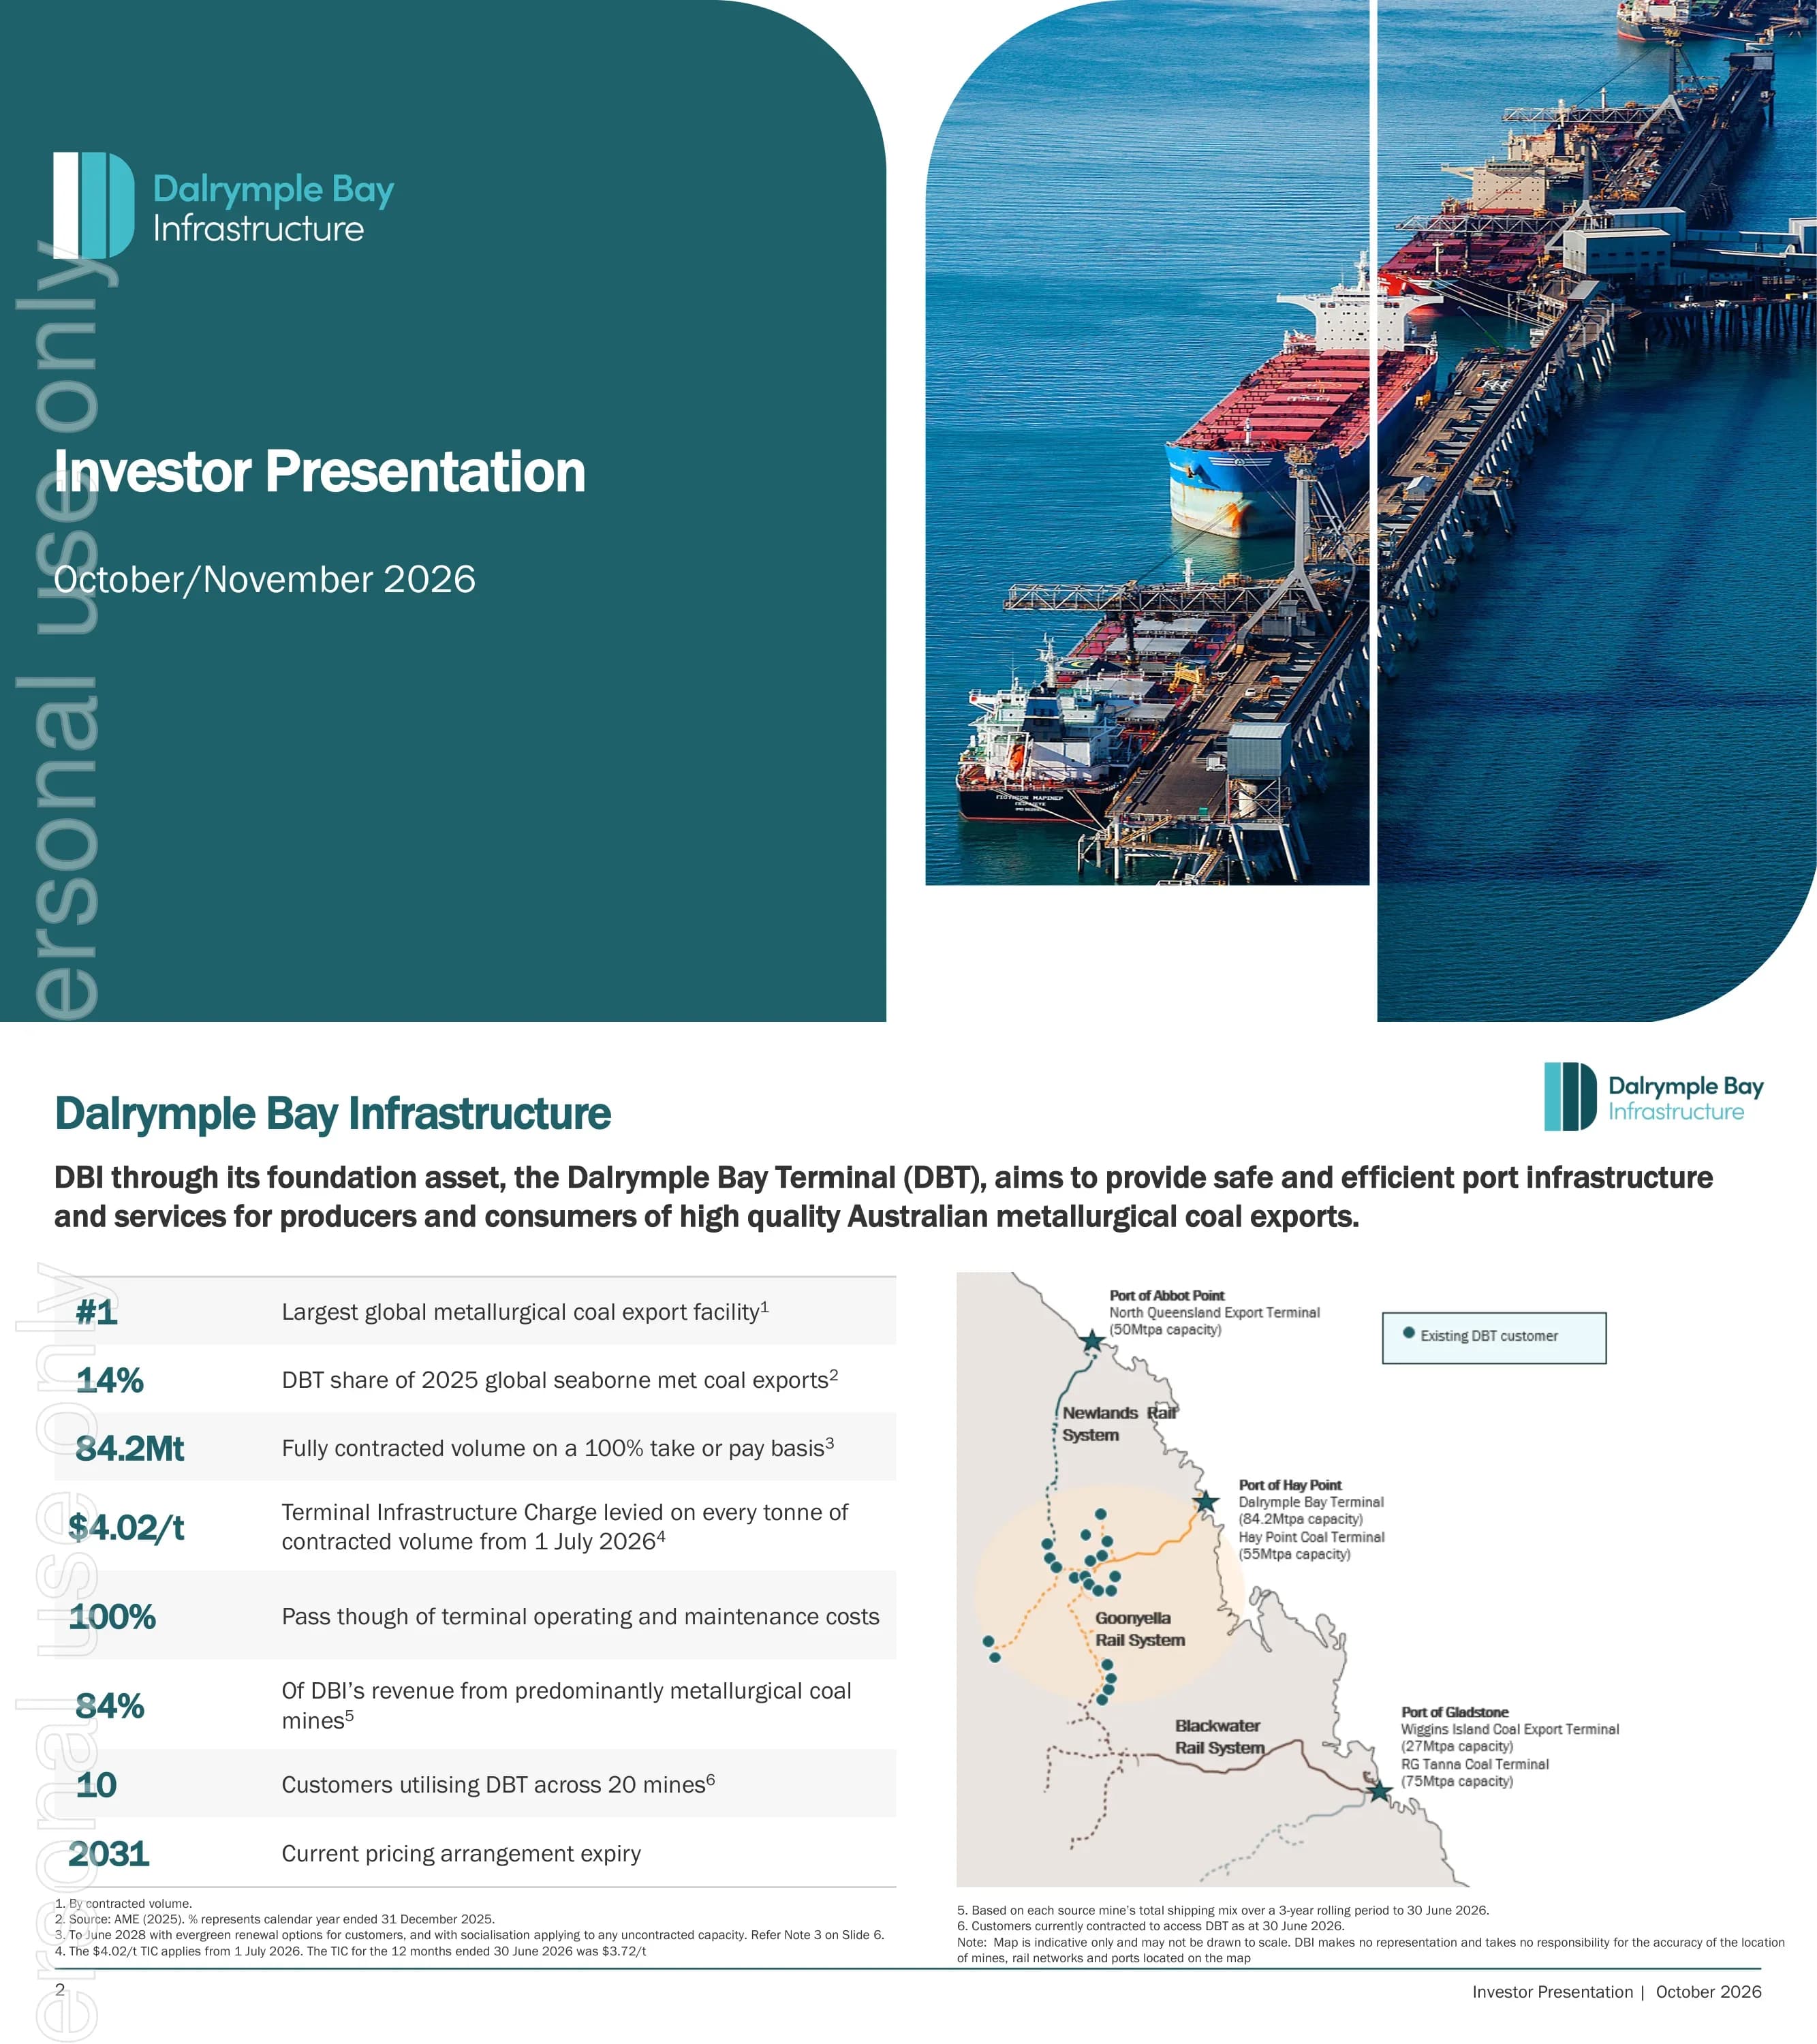
Title slide with the Dalrymple Bay Infrastructure logo, the title "Investor Presentation" and the date line "October/November 2026".
Left half solid dark-teal panel with rounded top-right corner holding logo and title; right half shows two rounded aerial photo panels of the terminal jetty with bulk carriers berthed.
DBI's foundation asset DBT serves Australian metallurgical coal exports: #1 global met coal export facility by contracted volume, 14% share of 2025 global seaborne met coal exports (AME), 84.2Mt fully contracted on a 100% take-or-pay basis, a $4.02/t TIC from 1 July 2026 (A$; $3.72/t for the 12 months to 30 June 2026), 100% pass-through of operating and maintenance costs, 84% of revenue from predominantly met coal mines, 10 customers across 20 mines, and a pricing arrangement expiring 2031.
Left column of eight KPI rows (large teal number plus description on alternating grey bands); right side a Queensland map showing DBT, Abbot Point and Gladstone terminals, rail systems and customer mine dots.
Half-year headline metrics: EBITDA $150.5m (+4.7% vs H1-25), FFO $92.7m (+10.2%), $370.6m of capital projects still to be added to the NECAP Asset Base, $350m issued in the Australian Medium Term Note market, distributions of 13.5cps (+14.9%), and zero incidents causing serious injury or illness.
Full-width dark-teal band with six equal KPI columns separated by thin white rules (label, aqua figure, comparison); wide panoramic photo of the terminal and berths below; footnotes at bottom.
The TIC for TY-26/27 is ~$4.02/t, up ~8.1% on TY-25/26, applied to every tonne of 84.2Mt contracted capacity. A table breaks down TIC components by TIC year: Base TIC 3.32/3.44/3.52/3.66, NECAP Charge 0.12/0.16/0.20/0.35, TIC per contracted tonne 3.44/3.59/3.72/4.02 and NECAP Asset Base 94.2/112.9/139.5/232.5 ($m) for TY-23/24 to TY-26/27. Six key contract terms are listed: take-or-pay, revenue socialisation, force majeure protection, cost pass-through, 5-year renewals, CPI uplift in Base TIC.
Left two-thirds: three bullets above a teal-header data table; right third: numbered list of six contract terms with large aqua numerals separated by rules.
Q2-26 distribution of 6.750cps; TY-26/27 guidance of 28.6cps, up 8.5%. Policy: distribute 60-80% of FFO, target DPS growth of 3-7% p.a., frank to the maximum extent allowable. Table of distributions earned: TY-23/24 21.5cps, TY-24/25 23.0cps, TY-25/26 26.4cps (+14.7%), TY-26/27 28.6cps guidance. Stacked bars show quarterly distributions by TIC year (7.155cps per quarter guided for TY-26/27) and a line chart tracks the FFO payout ratio from FY-22 to 1H-26 within the 60-80% target band.
Left column: distribution and policy bullets above a teal-header table; right column: stacked quarterly bar chart (with dashed guidance bar) above a line chart with dashed target-range lines.
Four growth levers: revenue initiatives (capacity optimisation and revised security arrangements), NECAP (organic TIC growth), the 8X expansion option delivered in phases, and external opportunities beyond DBT filtered by DBI's competitive advantages. A callout notes that $10m of incremental revenue above TIC revenue implies roughly a 1.5cps uplift in distributions at a 70-80% payout.
Four aqua cards in a row, each with a dark-teal icon tile, header and short description; panoramic jetty photo strip underneath; footnote on 8X optionality.
Explains NECAP mechanics: interest during construction accrues until spend joins the NECAP Asset Base, which then earns the 10-year Australian Government bond rate plus a margin and a depreciation return; regular NECAP runs about $30-50m a year; $97.8m ($91.3m plus $6.5m IDC) was added on 1 July 2026, lifting the TIC by $0.15/t. Three bar charts show NECAP approved by customers (FY21-1H26, including $281m of major projects in FY23), amounts spent on NECAP, and the NECAP Asset Base rising from $51.1m (July 2022) to $232.5m (July 2026).
Five full-width bullets on top; three side-by-side bar charts below with dark teal (sustaining) and aqua (major projects) series.
All current NECAP works were recommended by the Operator and approved by all customers. Shiploader SL1A and Reclaimer RL4 are expected to be completed by 30 June 2027, adding a further ~$0.53/t to the NECAP charge from 1 July 2027 (from $0.35/t). Every $0.10/t of TIC adds ~$8.5m of revenue a year. An indicative scenario chart shows TIC rising from $3.59 (24/25) and $3.72 (25/26) to $4.02 (26/27) and stepping up further through 30/31.
Left half bullets; right half stacked bar chart of TIC by TIC year with solid bars for actuals, hatched light bars for CPI-escalated base TIC, dark teal NECAP charge and grey potential future NECAP, plus a callout marking SL1A and RL4 commissioning.
8X is a phased capacity expansion within the existing footprint, a pathway to 99.1Mtpa of contracted capacity, with about 31Mtpa of demand in the DBT access queue as at 30 April 2026. Three phases: SL4 on Berth 3 (4.4Mtpa, $538m), stockpile augmentation (4.1Mtpa, $335m) and new inloading systems (6.4Mtpa, $710m), totalling 14.9Mtpa and $1,583m (FEL3 P95 estimate). A waterfall chart (AME) shows global seaborne met coal demand rising from 376Mt in 2025 to 476Mt in 2040, with Australia contributing +85Mt; an area chart shows the access queue over time.
Left: bullets above a teal-header phase/capacity/cost table; right: waterfall chart above an area chart; footnotes include the QCA price-ruling reference.
Debt profile: A$2.35bn limit with A$2.06bn drawn at 30 June 2026, liquidity A$261.4m, tenor 6.3 years, weighted average all-in interest rate 7.0%. Credit profile: BBB/Stable (S&P), debt service coverage ratio 2.6x (downgrade threshold 1.4x), about A$415m headroom under the S&P gearing threshold. Charts show the debt maturity profile by facility limit from 2026 to 2034-2038, net debt to EBITDA from FY-22 to 1H-26, and a donut of drawn debt by source (bank debt, USPP, AMTN, derivative structured products).
Two small teal-header tables (Debt Profile, Credit Profile) top left; maturity bar chart below; right column with a net-debt/EBITDA line chart above a donut chart labelled $2.06bn.
Seven priorities: organic revenue growth via new initiatives and NECAP; completing Shiploader 1A and Reclaimer 4 on time and on budget; capturing long-term Bowen Basin met coal volumes including the 8X assessment; refinancing to reduce interest costs while staying investment grade; diversification through acquisitions with a similar risk profile; exploring future alternative uses of DBT; and whole-of-terminal ESG initiatives.
Numbered list of seven priorities with large aqua numerals and divider rules on the left; tall aerial photo of the jetty on the right.
Section divider introducing the appendix slides.
Left dark-teal panel with rounded corner and the word "Appendices"; right side full-bleed photo of a shiploader loading a red bulk carrier.
Six features of the model: light-handed regulation with a pricing agreement to 2031; take-or-pay on 84.2Mt contracted to at least 2028; force majeure protection; Base TIC indexed to Australian CPI plus NECAP returns at the 10-year bond rate plus margin; full pass-through of operating and maintenance costs; and socialisation of uncontracted capacity revenue across customers except in limited circumstances.
Grid of six dark-teal text cards (3 x 2) each with an aqua heading and outline icon; tall photo of shiploading equipment on the far right.
Customer table as at 30 June 2026: Anglo American, Argo Resources, Glencore, Middlemount Coal, QMetco, Peabody, Pembroke Resources, Stanmore Resources, TerraCom and Whitehaven Coal, with their mines (e.g. Moranbah North, Hail Creek, Olive Downs, Daunia). A donut chart splits the 84.2Mtpa contracted capacity by anonymised customer, the largest holding 25.05Mtpa (30%).
Left: two-column customer/mine table with teal header; right: donut chart with 84.2 Mtpa in the centre and a legend.
All foreign-currency debt is swapped back to AUD (no FX risk) and interest-rate risk is managed with fixed-rate issuance and swaps. The weighted average all-in rate was 7.01% at 30 June 2026 and 90.1% of drawn debt was hedged. Summary table: $973.5m drawn maturing in 2-5 years and $1,083.7m beyond 5 years, total drawn $2,057.2m, undrawn $216.5m, total $2,273.7m. A combo chart shows fixed versus floating debt and % fixed from 2026 to 2031.
Narrow bullet column left; right side a combo bar-and-line chart above a teal-header debt summary table.
Approved NECAP table at 1 July 2026: Reclaimer RL4 ($115.6m approved, $82.3m spent), Shiploader SL1A ($165.4m approved, $139.8m spent) and regular series ($319.6m approved); total $600.6m approved, $459.8m spent, $232.5m in the asset base and $370.6m yet to be included. New regular NECAP Series Z of $38.5m was unanimously approved on 13 July 2026, taking the total to $639.1m approved and $409.0m yet to be included. About $300m (+IDC) is expected to join the asset base on 1 July 2027, a ~$0.53/t NECAP charge uplift.
Three bullets across the top; wide teal-header financial table with seven numeric columns and bold total rows below.
In February 2026 DBI released its first Sustainability Report under AASB S2 Climate-related Disclosures, covering the period from 1 January 2025. Disclosures align climate with strategy and governance and include scenario analysis; principles are transparency, proportionality, integrity and consistency.
Left framed box with the 2025 Sustainability Report cover image and descriptive text; right two stacked boxes with aqua header bars listing disclosure contents and principles.
Safety: no fatalities or serious injuries/illnesses and 2 high potential incidents in H1-26. Diversity: 57% female directors and 43% female executive leaders. Community: Healthy Rivers to Reef STEM workshops in Mackay, Whitsunday and Isaac. Governance: three new non-executive directors since September 2025. Procurement: over 95% of new shiploader and reclaimer procurement with Australian companies.
Five outlined text boxes in a grid with vertical teal "Social" and "Governance" side labels; aerial photo of the terminal surroundings in the bottom-right cell.
H1-26 vs H1-25 (A$ million): TIC revenue 156.5 vs 151.1, total income 433.3 vs 395.4, EBITDA 150.5 vs 143.8 (95% margin), net finance costs (55.8) vs (58.3), net profit before tax 74.2 vs 65.4, net profit after tax 49.2 vs 43.1. A second table shows net interest costs borne of 51.1 vs 51.7, flat despite more NECAP debt after the December 2025 refinancing. Numbered notes explain TIC revenue, other revenue, EBITDA and finance costs.
Left: full-height P&L table with teal header and shaded current-period column; right: numbered teal-circle notes above a finance-cost components table.
FFO of $92.7m vs $84.1m; capital expenditure (93.6) vs (57.5); proceeds from borrowings 758.5 and repayments (768.0) reflecting the $350m 5-year AMTN at a 6.234% coupon (maturing 24 March 2031) and repayment of a $250m syndicated term facility; distributions via unfranked dividends (30.0) and loan-note repayments (36.9); cash fell from 110.5 to 66.5.
Left cash-flow table with teal header and shaded current column; right column of five numbered explanatory notes.
Definitions of terms used in the deck: $ (Australian dollar unless stated), 8X Project (expansion to a maximum 99.1Mtpa), AU (Access Undertaking), DBI, DBT, EBITDA, FFO, NECAP, Operator, QCA, TIC, USPP and units.
Two glossary tables side by side with light-aqua term cells; panoramic photo strip of ships at the jetty below.
Legal notices: information current as at 19 October 2026, read with DBI's ASX disclosures; not an offer or financial product advice; forward-looking statements; all figures in Australian dollars; AME industry data caveats; non-IFRS measures labelled non-statutory.
Dense two-column small-print text with aqua sub-headings.
Common questions about this slide and the underlying presentation content.
It is a 22-slide investor presentation from Dalrymple Bay Infrastructure (DBI), owner of the Dalrymple Bay Terminal coal export terminal in Queensland, lodged with the ASX on 19 October 2026. The cover reads "Investor Presentation — October/November 2026". It covers the H1-26 result, the take-or-pay TIC business model, NECAP and 8X growth, the balance sheet and ESG.
For the six months to 30 June 2026, EBITDA was A$150.5m (+4.7%), FFO was A$92.7m (+10.2%), net profit after tax was A$49.2m (vs A$43.1m), and distributions were 13.5 cents per security (+14.9%).
All amounts are Australian dollars (A$, shown as $ in the deck). Unlike many ASX companies whose fiscal year runs July to June, DBI reports on a calendar-year basis, so H1-26 is January to June 2026. Separately, the Terminal Infrastructure Charge is set by TIC Year, which runs 1 July to 30 June (TY-26/27 is 1 July 2026 to 30 June 2027).
The TIC is the per-tonne charge paid by all customers on every tonne of the terminal's 84.2Mt contracted capacity on a take-or-pay basis. It is $4.02/t from 1 July 2026, made up of the CPI-indexed Base TIC ($3.66/t) and the NECAP Charge ($0.35/t).
8X is a phased expansion within the existing terminal footprint toward 99.1Mtpa of contracted capacity. The deck lists three phases adding 14.9Mtpa at an estimated $1,583m, and notes about 31Mtpa of demand in the access queue; DBI has not made a final investment decision.
The PDF is the deck as lodged with the ASX. The PPTX is an editable PowerPoint converted from that PDF, so text and tables can be edited, though some layouts and charts may need tidying compared with the original source file.
Infrastructure and income investors, credit analysts, and IR teams at ports, utilities or toll roads who want an example of explaining contracted revenue, capex-driven tariff growth and distribution policy in a concise deck.
The presentation was lodged with the Australian Securities Exchange on 19 October 2026 and is available through DBI's announcements on the ASX website and DBI's investor centre.

Create Your Own Slides
Turn your ideas into professional presentations in seconds with 2slides AI.
Reference professional designs, choose your style, and generate slides with perfect text rendering. Powered by Nano Banana—start creating your presentation now.
Your AI Agent for slides. Save time, shine faster with intelligent presentation creation.


© 2026 2slides. All rights reserved.