
Part of Investor presentation examples
PLS Group (ASX: PLS, formerly Pilbara Minerals) September Quarter FY27 Activities Presentation, dated 28 October 2026 and lodged with the ASX. The 29-slide deck reports record quarterly spodumene production of 267.6kt at the Pilgangoora Operation in Western Australia, revenue of A$563M (Australian dollars), unit operating cost (FOB) of A$539/t, a cash balance of A$2,217M, the US$700M 8.00% Senior Unsecured Notes due 2032, the P2000 expansion final investment decision (~2Mtpa, ~A$1.9B capex, A$2.7B incremental NPV), a 20-year power purchase agreement with Fortescue, revised FY27 capex guidance and a lithium market update.
Uses this deck’s cover as a style reference for slides made from your own content. Or pick any page below to use its layout as the reference.
Quick Navigation
Tags
Share the slides
PLS Group (ASX: PLS, formerly Pilbara Minerals) September Quarter FY27 Activities Presentation, dated 28 October 2026 and lodged with the ASX. The 29-slide deck reports record quarterly spodumene production of 267.6kt at the Pilgangoora Operation in Western Australia, revenue of A$563M (Australian dollars), unit operating cost (FOB) of A$539/t, a cash balance of A$2,217M, the US$700M 8.00% Senior Unsecured Notes due 2032, the P2000 expansion final investment decision (~2Mtpa, ~A$1.9B capex, A$2.7B incremental NPV), a 20-year power purchase agreement with Fortescue, revised FY27 capex guidance and a lithium market update.
Detailed view of each slide page, including layout, key content and visual elements.
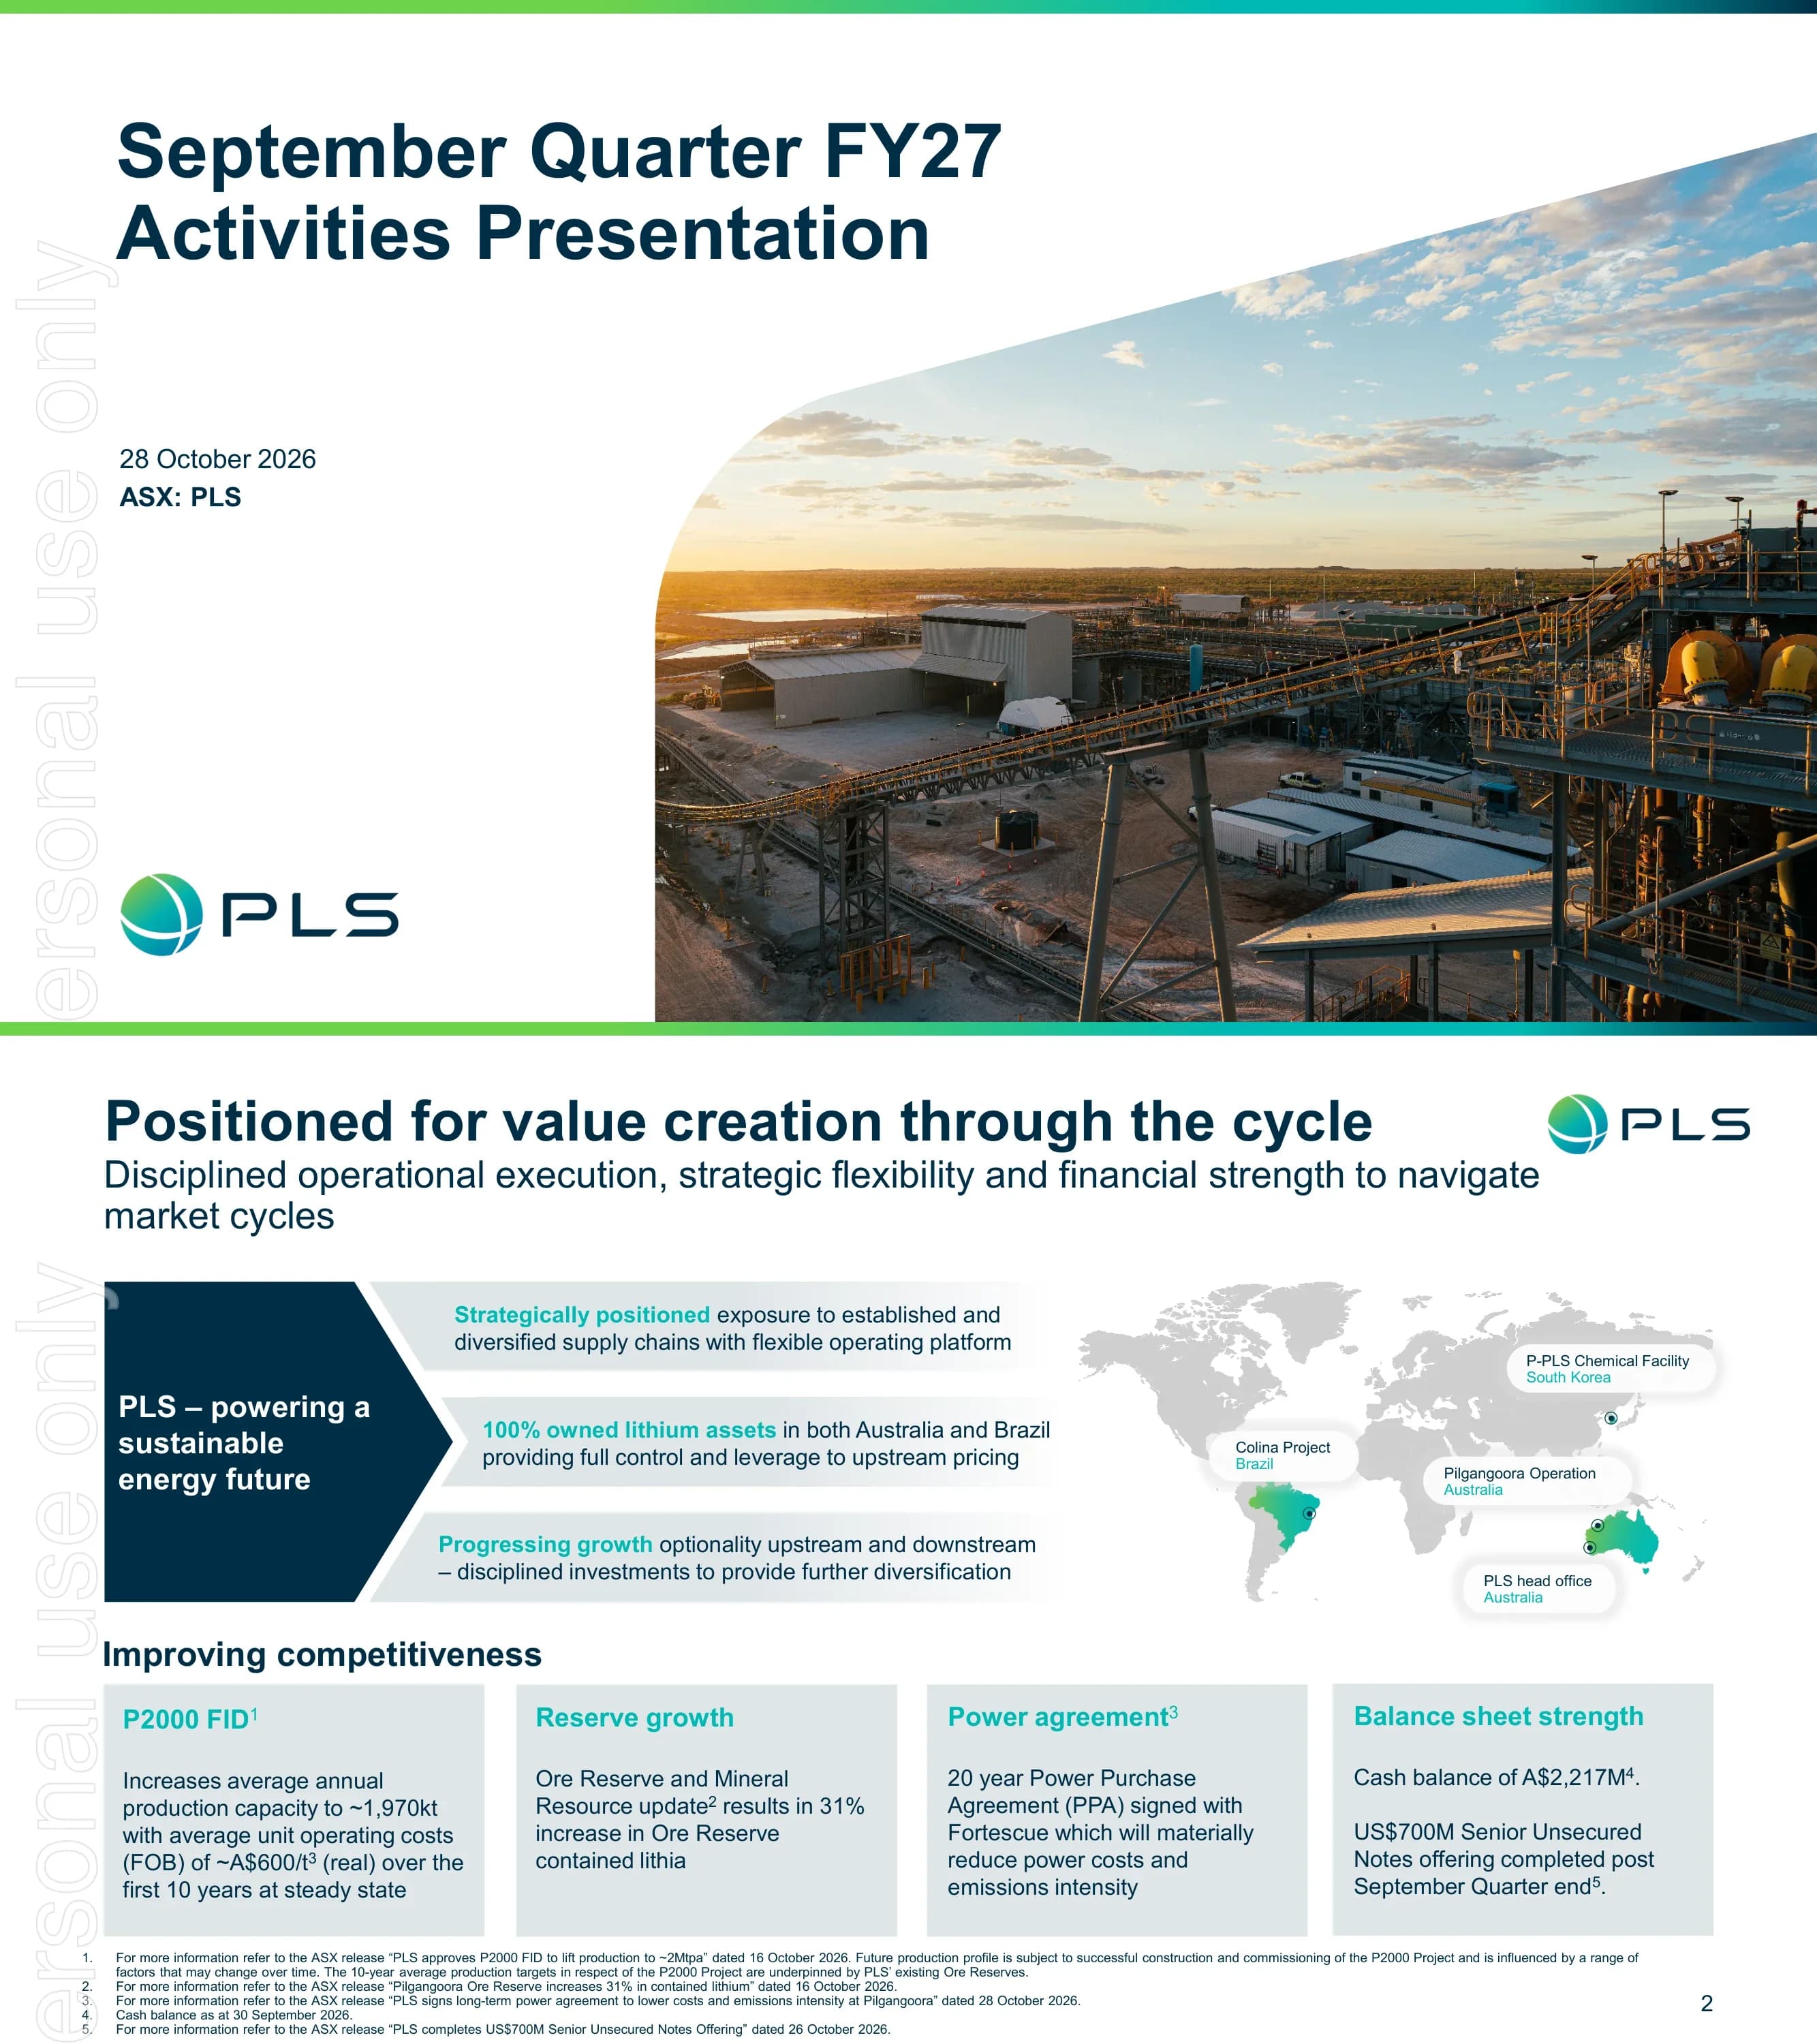
Cover slide titled September Quarter FY27 Activities Presentation, dated 28 October 2026, ticker ASX: PLS, with the PLS logo and a sunrise aerial photograph of the Pilgangoora processing plant and conveyors.
Title and date on a white left panel; large photograph in a curved frame filling the right half; logo bottom left.
Positioning slide: PLS is strategically positioned in diversified supply chains, owns 100% of its lithium assets in Australia and Brazil, and is progressing upstream and downstream growth. Four 'Improving competitiveness' tiles cover the P2000 FID (average annual production capacity ~1,970kt at ~A$600/t FOB real over the first 10 years), a 31% increase in Ore Reserve contained lithia, a 20-year power purchase agreement with Fortescue, and balance sheet strength (cash A$2,217M at 30 September 2026; US$700M Senior Unsecured Notes completed after quarter end).
Navy chevron panel with three statement bars on the left, world map with asset locations on the right, and a row of four grey KPI tiles below.
Six headline metrics: production 267.6kt (SC5.3); estimated realised price US$1,809/t SC5.2 (US$2,077/t SC6.0); group revenue A$563M including negative provisional pricing adjustments of A$69M; unit operating cost (FOB) A$539/t (US$381/t); P2000 FID approved for ~2Mtpa capacity with first product due in the September Quarter of calendar 2029; and the power agreement expected to cut unit operating costs (FOB) by A$15-20/t on commencement.
Two rows of three KPI blocks, each with a label, large teal number and short caption; footnotes along the bottom.
Safety metrics: total recordable injury frequency rate (TRIFR) of 2.36 on a 12-month moving average across Australian and Brazilian sites, and 10.29 quality safety interactions per site leader over a rolling 12 months (previous quarter 9.92).
Full-width aerial photograph of a site vehicle and workers with two navy metric panels overlaid.
Record production underpinned by Pilgan performance and the Ngungaju restart. Total material mined rose to 11.5 million tonnes with 1.5 million tonnes of ore; record quarterly production of 267.6kt, up 25% quarter on quarter, with ~75% lithia recovery helped by ore sorting; sales of 223.6kt at an estimated US$1,809/t CIF China on a ~SC5.2 basis (SC6.0 US$2,077/t; reduced to US$1,754/t as at 26 October 2026); Ngungaju returned to full operational status by the end of October.
Portrait photo of a worker on the left third; four headed text sections (Mining, Processing, Sales, Ngungaju restart) on the right.
Colina study work (drilling, test work and flowsheet development) continued with outcomes due in the December Quarter 2027; PLS completed the acquisition of Lithium Ionic's interests in surrounding tenements and began infill resource drilling; development timing depends on studies, funding and market conditions.
Three bullet points on the left half; photograph of geologists logging drill core on the right half.
Downstream update. PLS holds an 18% interest in the POSCO Pilbara Lithium Solution (P-PLS) lithium hydroxide facility in Gwangyang, South Korea, which ran on a moderated single-train basis; total LH production was 3,558t, 98% (3,520t) battery grade. At the Mid-Stream Demonstration Plant, commissioning put first ore through the electric calciner with successful conversion; first product is now expected in the December Quarter 2026.
Photograph of the Mid-Stream Demonstration Plant tower on the left; two headed bullet sections on the right.
Section divider introducing the quarterly financial results.
Full navy background with large white section title and logo top right.
Comparison table, Sep Q FY27 vs Jun Q FY26: production 267.6kt vs 214.3kt (+25%); sales 223.6kt vs 249.9kt (-11%); realised price US$1,809/t vs US$2,107/t (-14%), SC6 US$2,077/t vs US$2,415/t (-14%); revenue A$563M vs A$743M (-24%); unit operating cost A$539/t vs A$616/t (-12%), US$381/t vs US$437/t (-13%); capex A$185M vs A$124M (+50%); cash margin from operations A$392M vs A$579M (-32%); cash A$2,217M vs A$2,290M (-3%); net cash A$1,277M vs A$1,339M (-5%); liquidity A$2,717M vs A$2,790M (-3%). Commentary explains lower price and shipment timing, cost efficiencies, capex mix (growth A$77M, mine development A$58M, infrastructure/sustaining A$50M) and the A$161M final FY26 dividend.
Five-column financial table occupying the left two-thirds with the current quarter column shaded; grey commentary panel on the right with bold lead-ins.
After quarter end PLS closed US$700M 8.00% Senior Unsecured Notes due 2032, its second US debt capital markets issue. Pro forma total cash rises from A$2,217M to A$3,209M and total cash and liquidity from A$2,717M to A$3,709M (with a A$500M undrawn RCF). Across the 2031 and 2032 notes the weighted average cost of funds is 7.48% p.a. and weighted average maturity is 5.3 years. The debt maturity chart shows A$99M (POSCO convertible bond) in FY27, the A$500M undrawn RCF in FY30, A$856M (2031 US$600M notes) in FY31 and A$999M (2032 US$700M notes) in FY33.
Grey bullet panel on the left; clustered bar chart with data table (actual vs pro forma liquidity) top right; debt maturity bar chart bottom right.
Section divider introducing announcements made after the September Quarter closed.
Full navy background with large white section title.
Three investment pillars. P2000 FID: incremental NPV A$2.7B at an 8% real post-tax discount rate (based on a long-term SC6 price of US$1,620/t) and ~A$1.9B project capex. Enhancing infrastructure: A$600-650M for an access road upgrade, new permanent village and mine services facility, aimed at lower costs and better productivity. Power purchase agreement: A$15-20/t lower unit operating costs (FOB) over 20 years, with ~A$150M for transmission connection and power infrastructure.
Three-column grid, each column with a heading, a headline value and a capex figure separated by thin rules.
Rendering of PLS' third major processing facility at Pilgangoora (dry plant, wet plant and existing Pilgan plant). P2000 key facts: ~2Mtpa 10-year average production capacity at steady state; ~A$600/t 10-year average unit operating cost (FOB, real); A$40-60M per annum sustaining capital (real) FY31-40; ~A$180M per annum mine development (real) FY31-40; first production in the September Quarter CY29 with ~6 month ramp up.
3D aerial rendering with colour-coded plant areas across the left three-quarters; grey fact column on the right.
Three projects: sealing the ~24km Wodgina Road East access road to the Great Northern Highway, enabling ultra-quad road trains and cutting daily truck movements by ~35%; a new 1,200-bed cyclone-rated permanent village; and a mine services facility with 8 enclosed service bays supporting the move to an owner-operator HME fleet.
Three equal cards, each with a photo or map on top and a headed bullet list below.
A 20-year agreement for a minimum 325 GWh per year from Fortescue's Green Grid; expected A$15-20/t lower FOB unit costs beyond the P2000 FID cost base; A$150M connection investment phased FY27-FY29; >100 MW transmission capacity. A chart shows Pilgangoora power-related emissions intensity falling from 0.69 tCO2-e/MWh in FY23 to a forecast 0.13 in FY30, about an 80% reduction, through 6MW onsite solar, LNG, BESS and the PPA.
Four KPI blocks on the left; emissions intensity bar chart with energy-source icons on the right; gradient banner across the bottom.
Benchmark Mineral Intelligence forecast of the top 10 primary lithium producers by average CY30-40 output (kt LCE) shows PLS as the second-largest bar; a Project Blue CY30 all-in sustaining cost curve places Pilgangoora in the second quartile with a 20+ year mine life.
Two side-by-side charts separated by a vertical rule, each with a bold takeaway headline below.
Section divider introducing the revised FY27 guidance.
Full navy background with large white section title.
FY27 guidance updated to include PPA capex: production 1,030-1,100kt (no change, ~SC5.2 basis); unit operating cost (FOB) A$575-625/t (no change); total capex revised to A$1,130-1,195M. Base: sustaining A$85-100M, mine development A$250-280M, infrastructure and projects A$110-130M (all unchanged). Growth: P2000 post-FID A$500M (unchanged), Colina pre-FID subject to Board approval. Enhancing: access road, permanent village, mine services facility and PPA A$185M (revised).
Guidance table with NO CHANGE / REVISED status badges and grouped Base, Growth and Enhancing rows on the left; two explanatory text blocks on the right.
Section divider introducing the lithium market update.
Full navy background with large white section title.
Spodumene concentrate price history (SC6.0, CIF China, US$/t) from January 2019 to October 2026, peaking above US$6,000/t around late 2022, with an inset of daily prices from September 2025 to October 2026; and a Project Blue CY26 all-in sustaining cost curve (US$/t LCE) with the spot battery-grade carbonate price shown as a dashed red line.
Line chart with zoomed inset on the left; stepped cost curve on the right.
Global average battery pack prices fell from US$1,474/kWh in 2010 to US$108/kWh in 2025 (BloombergNEF, real 2025 dollars); China vs rest-of-world demand share from 2020 to 2040 shows broadening geographic demand; lithium demand by end use (EV, BESS, other) grows from 2020 to 2040 (Benchmark Mineral Intelligence).
Three charts in columns, each with a bold takeaway headline and subtitle below.
Mine development cycles from discovery to production rose from 6 years (1990-99) to 18 years (2020-24). A CY27 waterfall moves from a base deficit of -101kt LCE through supply risks in Zimbabwe (154), Nigeria north (90), Jiangxi (81) and Mali (70) to a downside of -496kt. The market balance forecast shows supply of 1,598kt, 1,903kt and 1,824kt (plus 395kt at risk) against demand of 1,640kt, 2,112kt and 2,320kt for CY2025-27, implying deficits of -42kt, -209kt and -101kt base / -496kt downside.
Three charts in columns (horizontal bar, waterfall, bar-and-line combo) with bold conclusions beneath each.
Q&A slide with a full-bleed photograph of Pilbara hills at sunset.
Full-bleed landscape photograph with a white heading top left.
Investor relations contact (James Fuller, Group Manager, Investor Relations) and media contact (Michael Vaughan, Fivemark Partners), with social media icons.
Navy background with left-aligned contact blocks and social icons at the bottom.
Section divider introducing the appendix.
Full navy background with large white section title.
Five-quarter physicals from Sep Q FY26 to Sep Q FY27. For Sep Q FY27: ore mined 1,547,632 wmt; waste 9,994,063 wmt; total material 11,541,695 wmt; average grade 1.3% Li2O; ore processed 1,317,082 dmt; spodumene concentrate produced 267,596 dmt and shipped 223,613 dmt; tantalite produced 46,233 lb and shipped 39,235 lb; concentrate grade 5.3%; lithia recovery 74.7%.
Two stacked data tables (ore mined and processed; production and shipments) with the latest quarter column highlighted.
Three-year growth and enhancing infrastructure capex (A$M): FY27 685 (P2000 500 + enhancing 185), FY28 1,385 (900 + 485), FY29 630 (500 + 130), using the top end of enhancing infrastructure guidance.
Stacked column chart on the left; landscape photograph of a vehicle in the Pilbara on the right.
Disclaimer page: document prepared by PLS Group Limited dated 28 October 2026, to be read with the September Quarterly Activities Report lodged with the ASX; covers not an offer of securities, summary information, no liability, not financial product advice, forward-looking statements and guidance assumptions.
Dense full-width legal text with bold subheadings.
JORC Code reporting of Mineral Resources and Ore Reserves (Competent Persons Ross Jaine and Simon Kusabs; production targets underpinned by 6% proved and 94% probable Ore Reserves), reliance on third-party information, rounding, past performance, a statement that all dollar amounts are Australian dollars unless stated otherwise, and release authorised by Managing Director and CEO Dale Henderson.
Dense full-width legal text with bold subheadings.
Common questions about this slide and the underlying presentation content.
It is the 29-slide September Quarter FY27 Activities Presentation from PLS Group Limited (ASX: PLS, formerly Pilbara Minerals), dated 28 October 2026 and lodged with the ASX alongside the September Quarterly Activities Report. It covers Pilgangoora operations, quarterly financials, new debt financing, the P2000 expansion, a power agreement with Fortescue, revised FY27 guidance and a lithium market update.
PLS reports on an Australian financial year that runs from July to June, so FY27 covers July 2026 to June 2027. The September Quarter FY27 is July to September 2026, the first quarter of that year.
Financial figures such as revenue (A$563M), unit operating cost (A$539/t), cash (A$2,217M) and capex are in Australian dollars (A$), as the deck's notices confirm. Spodumene prices and the new notes are quoted in US dollars as in the original, for example a realised price of US$1,809/t on a SC5.2 basis and the US$700M Senior Unsecured Notes.
Record production of 267.6kt of spodumene concentrate (up 25% quarter on quarter), sales of 223.6kt, an estimated realised price of US$1,809/t (SC5.2), revenue of A$563M (down 24%), unit operating cost (FOB) of A$539/t (down 12%), and cash of A$2,217M with liquidity of A$2,717M at 30 September 2026.
P2000 is PLS' approved expansion at Pilgangoora, centred on the new Jimmagunya processing plant. It lifts 10-year average production capacity to ~2Mtpa at a ~A$600/t average FOB cost (real), with ~A$1.9B project capex, an incremental NPV of A$2.7B at an 8% real post-tax discount rate, and first production expected in the September Quarter of calendar 2029.
Production (1,030-1,100kt) and unit operating cost (A$575-625/t) guidance were unchanged. Capex guidance was revised to A$1,130-1,195M to include capex for the access road, permanent village, mine services facility and the Fortescue power purchase agreement (A$185M enhancing capex), alongside A$500M for P2000.
Yes. The page offers the original PDF and a PPTX version converted from it, so you can reuse the layouts: KPI tiles, the quarter-on-quarter financial table, the guidance table with status badges, debt maturity and capex charts, and the market supply-demand charts. Text in the converted file may need minor font and alignment cleanup.
The presentation was lodged with the Australian Securities Exchange (ASX) under the ticker PLS on 28 October 2026 and is also published on the PLS investor centre. Read it together with the September Quarterly Activities Report and the 16 and 28 October 2026 ASX releases on the P2000 FID, Ore Reserve update, enhancing infrastructure and the power agreement.

Create Your Own Slides
Turn your ideas into professional presentations in seconds with 2slides AI.
Reference professional designs, choose your style, and generate slides with perfect text rendering. Powered by Nano Banana—start creating your presentation now.
Your AI Agent for slides. Save time, shine faster with intelligent presentation creation.


© 2026 2slides. All rights reserved.