
Part of Investor presentation examples
Nickel Industries September 2026 Quarterly Activities Presentation: an 11-slide ASX quarterly update from Nickel Industries Limited (ASX: NIC), lodged with the ASX on 21 October 2026, covering the quarter ended 30 September 2026. The deck reports Group Adjusted EBITDA of US$125.9m (+4% on the June 2026 quarter), a second consecutive record quarter at the 80%-owned Hengjaya Mine (US$76.9m Adjusted EBITDA, 4.5m wmt ore sales), RKEF nickel pig iron output of 27,822t Ni at a US$14,408/t sale price, first MHP and Class 1 nickel cathode from the ENC HPAL project, a cash flow waterfall, net debt of US$1,104m and year-to-date progress against FY26 guidance. All figures are in US dollars, as reported by the company.
Uses this deck’s cover as a style reference for slides made from your own content. Or pick any page below to use its layout as the reference.
Quick Navigation
Tags
Share the slides
Nickel Industries September 2026 Quarterly Activities Presentation: an 11-slide ASX quarterly update from Nickel Industries Limited (ASX: NIC), lodged with the ASX on 21 October 2026, covering the quarter ended 30 September 2026. The deck reports Group Adjusted EBITDA of US$125.9m (+4% on the June 2026 quarter), a second consecutive record quarter at the 80%-owned Hengjaya Mine (US$76.9m Adjusted EBITDA, 4.5m wmt ore sales), RKEF nickel pig iron output of 27,822t Ni at a US$14,408/t sale price, first MHP and Class 1 nickel cathode from the ENC HPAL project, a cash flow waterfall, net debt of US$1,104m and year-to-date progress against FY26 guidance. All figures are in US dollars, as reported by the company.
Detailed view of each slide page, including layout, key content and visual elements.
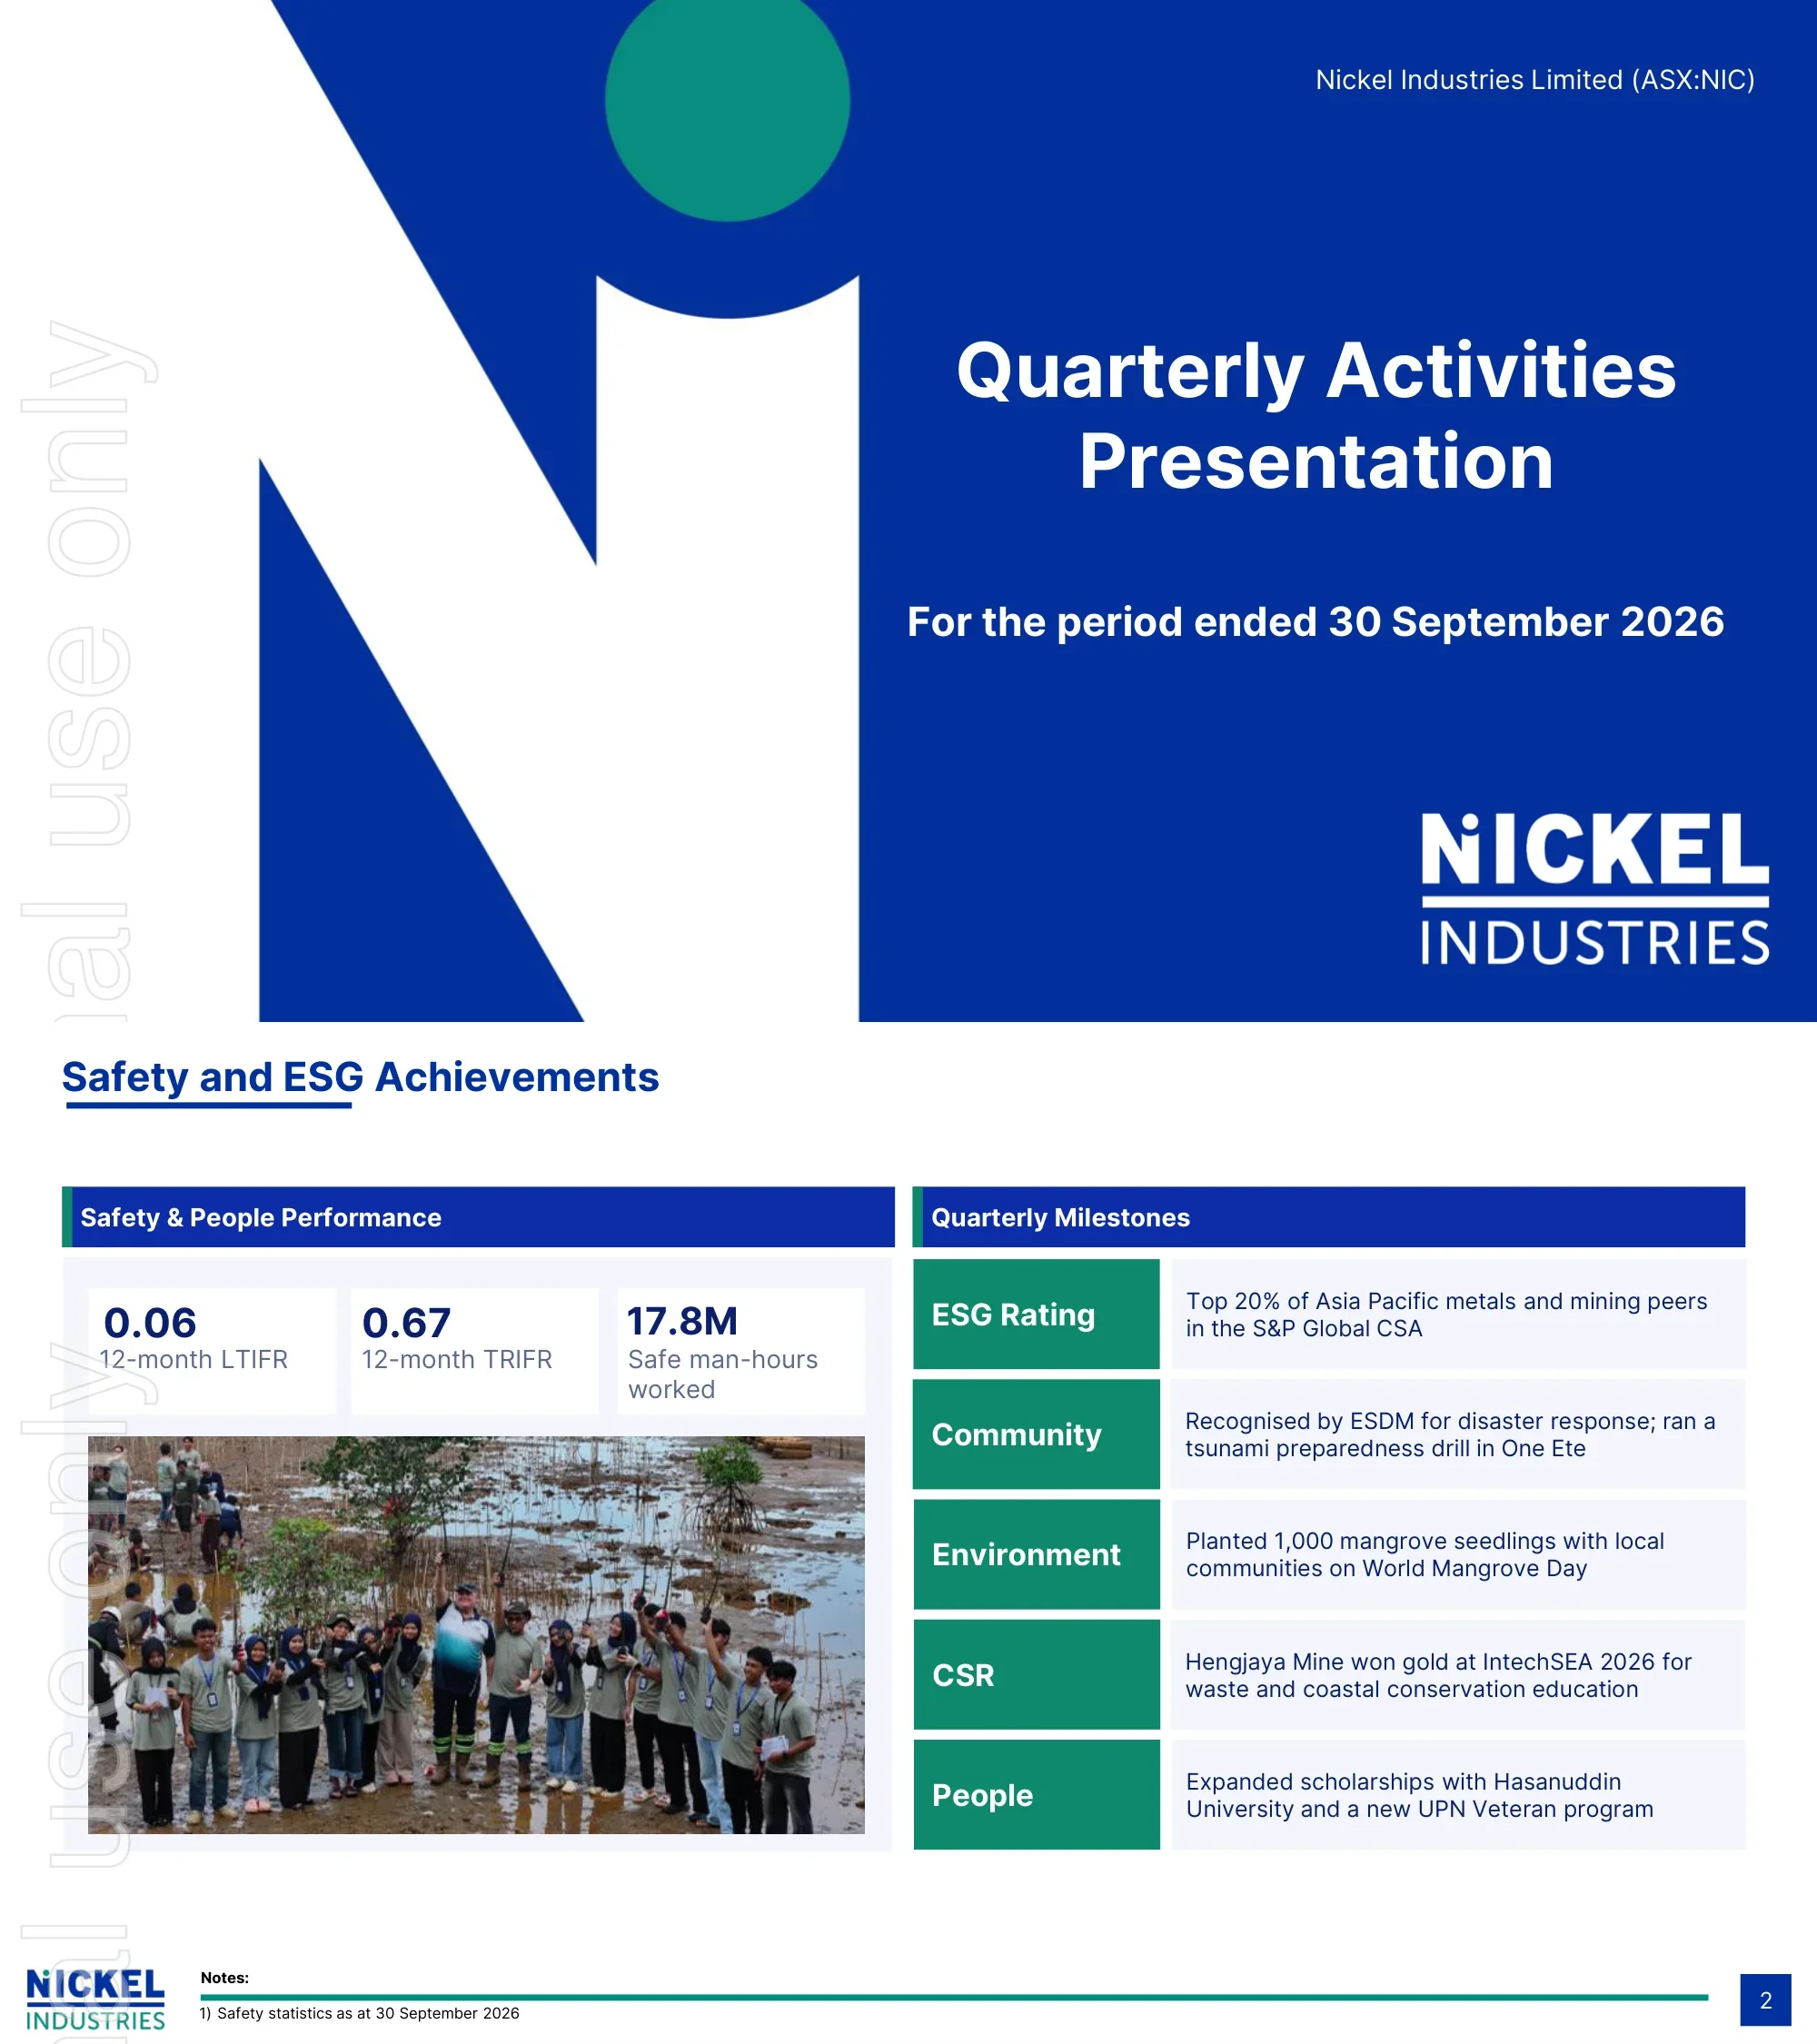
Cover slide identifying Nickel Industries Limited (ASX:NIC) and the Quarterly Activities Presentation for the period ended 30 September 2026. A faint vertical ASX watermark ('...nal use only', the standard 'For personal use only' marking) runs along the left edge of every slide.
Full-bleed royal-blue background with an oversized white 'N' letterform and teal circle forming the company's 'Ni' brand mark on the left; title, period and company name right-aligned; white Nickel Industries wordmark bottom right.
Safety & People Performance tiles show a 12-month LTIFR of 0.06, a 12-month TRIFR of 0.67 and 17.8M safe man-hours worked (statistics as at 30 September 2026). Quarterly Milestones: ESG Rating - top 20% of Asia Pacific metals and mining peers in the S&P Global CSA; Community - recognised by ESDM for disaster response and ran a tsunami preparedness drill in One Ete; Environment - planted 1,000 mangrove seedlings with local communities on World Mangrove Day; CSR - Hengjaya Mine won gold at IntechSEA 2026 for waste and coastal conservation education; People - expanded scholarships with Hasanuddin University and a new UPN Veteran program.
Two-column layout: left panel with a blue header bar, three KPI number cards and a large community photo; right panel with a blue 'Quarterly Milestones' header and five rows, each a teal label block paired with a light description cell. Footnote strip at the bottom.
Headline: US$125.9m Adjusted EBITDA, with record ore sales and EBITDA at Hengjaya Mine and first MHP and nickel cathode from ENC. Group: US$125.9m Adjusted EBITDA (+4%), quarterly record ore sales, top 20% in S&P Global CSA. Mining (Hengjaya Mine): record Adjusted EBITDA of US$76.9m (+68%), 4.5m wmt ore sales (+56%), US$17.1/wmt Adjusted EBITDA (+8%). RKEF: US$40.7m Adjusted EBITDA (-33%), 26.8kt Ni sold (-4%), NPI price US$14,408/t (-1%). HPAL: US$8.4m Adjusted EBITDA (-42%), US$13.0m HNC distributions (+271%), first MHP and cathode production at ENC HPAL. Variances are relative to the June 2026 quarter.
Teal subtitle sentence under the slide title, then a 2x2 grid of segment panels (Group, Mining, RKEF, HPAL), each with a blue header bar and three KPI tiles carrying variance percentages; photographs of an RKEF kiln interior (two images) and an aerial view of the HPAL plant fill the lower half.
Hengjaya Mine (80% owned) results, Q2 2026 vs Q3 2026. Production: saprolite 1,736,274 to 1,976,658 wmt (+14%); limonite 2,395,643 to 4,166,786 wmt (+74%); total 4,131,917 to 6,143,444 wmt (+49%); overburden 860,930 to 1,433,933 BCM (+67%); strip ratio 0.21 to 0.23 BCM/wmt. Sales: saprolite 1,507,689 to 1,682,693 wmt (+12%); limonite 1,375,380 to 2,802,477 wmt (+104%); total 2,883,068 to 4,485,170 wmt (+56%); saprolite grade 1.48% to 1.50%; limonite grade 1.13% to 1.09%; saprolite price US$51.6 to US$58.1/wmt (+13%); limonite price US$22.7 to US$22.2/wmt; average sale price US$37.8 to US$35.7/wmt (-6%); unit operating costs US$21.9 to US$18.5/wmt (-15%); Adjusted EBITDA US$45.7m to US$76.9m (+68%); Adjusted EBITDA/wmt US$15.9 to US$17.1 (+8%); EBITDA margin 42.0% to 46.7%. Commentary: ore sales up on a full quarter of operation; lower average price due to a higher limonite mix; EBITDA/wmt helped by more efficient haulage routes; second consecutive record quarterly result.
Left column 'Mining quarterly performance' panel with four stacked KPI cards, each with a green or grey variance pill and an explanatory sentence; right column holds two financial tables (Production and Sales) with Units, Q2 2026, Q3 2026 and Variance columns and shaded total rows.
Sampala Project: the ANN IUP Feasibility Study is awaiting evaluation by the Indonesian Government and the ETL Feasibility Study remains under regulatory review; three community bridges supporting logistics and heavy equipment mobilisation were completed; the first 8km of the 24km Sampala haul road, linking the ETL and ANN concessions, was completed; 274 drill holes for 6,922 metres were completed across the ANN and Gita Flora areas to support detailed mine planning; additional geotechnical drilling continued for engineering design and permitting. Siduarsi Project: the Feasibility Study remains under review by the Indonesian Government.
Left half holds two text panels with blue header bars (Sampala Project with five bullets, Siduarsi Project with one bullet); right half shows two stacked aerial photographs.
ENC quarterly performance (46% indirect interest): MHP production of 4,840t Ni and 494t Co; MHP cash cost US$13,943/t; cathode conversion cash cost US$3,888/t. Commissioning roadmap: Jul 2026 - ore slurry from Hengjaya Mine, MHP produced and delivered to the refinery; Aug-Sep 2026 - first Class 1 nickel cathode produced, then cobalt cathode, and MHP export exemption received; Oct 2026 - US$245m OCBC-led project finance signed, enabling a dividend recap to shareholders; Q4 2026 - IUI expected to be received (government inspection completed). HNC and Trading Division (10% indirect interest in HNC): total Adjusted EBITDA US$8.4m (-42%); HNC attributable nickel sales 1.9kt Ni (+7%); Adjusted EBITDA US$4,416/t Ni (-45%), driven by lower prices and increased costs; US$13.0m received in distributions from HNC (+271%).
Two-column layout: left 'ENC quarterly performance' panel with three KPI cards above a four-node horizontal timeline labelled 'Commissioning Roadmap'; right 'HNC (and Trading Division) quarterly performance' panel with four stacked KPI rows carrying variance pills.
Visual walkthrough of the ENC HPAL value chain in four numbered segments: 1) FPP - Feed Preparation Plant located at Hengjaya Mine; 2) HPAL Smelter - High Pressure Acid Leach smelter; 3) Integrated Refinery - sulphate and cathode refinery; 4) Finished products - Ni and Co in MHP and nickel cathode. A 'Watch progress' button links to a progress video.
2x2 photo grid; each quadrant has a blue header bar with the segment name and a numbered tab, above a large aerial or product photograph. The fourth quadrant splits into three product photos. Green 'Watch progress' call-to-action button top right.
RKEF results (80% indirect interest), Q2 2026 vs Q3 2026. Production: NPI production 245,601t to 239,959t (-2%); nickel grade 11.3% to 11.6%; total nickel production 27,864t to 27,822t (flat); cash costs US$12,595 to US$13,054/t Ni (+4%). Sales: sale price US$14,522 to US$14,408/t Ni (-1%); sales 27,961t to 26,837t (-4%); revenue US$407.8m to US$386.2m (-5%); Adjusted EBITDA US$60.3m to US$40.7m (-33%); Adjusted EBITDA/t US$2,157 to US$1,516 (-30%). Commentary: scheduled maintenance on the HNI RKEF line; higher costs from the Indonesian Government raising the nickel ore Mineral Benchmark Price plus HNI maintenance; resilient NPI pricing on strong stainless steel demand despite a falling LME nickel price.
Left 'RKEF quarterly performance' panel with three KPI cards (each with variance pill and explanation); right side holds Production and Sales tables with Q2 2026, Q3 2026 and Variance columns and shaded key rows.
Cash flow before growth and debt of (US$12.2m), driven mainly by working capital: higher RKEF and Mine receivables (Mine sales up 56% quarter-on-quarter), ANI inventory build on shipment timing, a June-quarter customer advance applied to an August shipment, and prepayment to HNC for July and August MHP; corporate costs include a US$4.4m advisor fee for Sphere's 10% ENC acquisition, recoverable from Shanghai Decent. Growth spend US$50.5m (ENC working capital loan and Sampala capex, partly offset by a US$15m ONI matte converter option refund). Net debt US$1,104m (US$450m syndicated loans and US$800m unsecured notes; US$245m ENC debt not consolidated). Waterfall: opening cash US$268.3m to ending cash US$145.9m, with items including cash from RKEF operations (7.3), PTHM operations 17.4, HPAL trading (27.4), corporate costs (7.3), HNC distributions 13.0, capex (0.6), E&E payments (12.5), investment payment returned 15.0, loan to related party (53.0), net finance expenses (42.8), OpCo minority dividends/loan (15.4) and FX (1.4). Reconciliation table: Adjusted EBITDA RKEF 40.7 / Mining 76.9 / HPAL 0.6; cash from operations (7.3) / 17.4 / (27.4) US$m.
Left 'Cash flow summary' panel with three large KPI blocks and explanatory paragraphs; upper right a waterfall bar chart (US$m) with a dashed box grouping operating items; lower right a reconciliation table from Adjusted EBITDA to cash from operations by segment (RKEF, Mining, HPAL).
YTD progress against the FY26 guidance midpoint: mine consolidated sales 73% (10.4M of 14.3M wmt; RKAB increase to 19M wmt sought); RKEF consolidated sales 81% (85.0kt of 100-110kt Ni; HNI overhaul and dry season); HPAL attributable sales 55% (5.8kt of 10-11kt Ni; ENC sales to start once IUI received); total capex 73% (US$51.0m of US$66-73m; Sampala haul road continues). Table of YTD Sep-26 vs FY26 outlook: Sampala development capex US$37.5m vs US$48-53m; maintenance capex US$13.5m vs US$18-20m; total capex US$51.0m vs US$66-73m. Footnotes cite a US$169m acquisition payment for the 17.5% interest in the TMI HPAL (ASX announcement, 24 June 2026) with an executed US$169m unsecured loan facility, and possible additional sales if the 2026 RKAB quota is increased. FY26 here aligns with calendar 2026 (YTD to September, 2026 RKAB quota).
Left panel with four stacked percentage KPI cards; right side a guidance table split into a capex block and a sales block with Units, YTD Sep-26 and FY26 outlook columns; dense numbered footnotes at the bottom.
Contact slide listing Justin Werner, Managing Director, and Andrew Coleman, Head of Investor Relations, with their company email addresses.
Mostly white slide with the title top left and two text blocks of contact details side by side; logo and page badge in the footer.
Common questions about this slide and the underlying presentation content.
It is the 11-slide quarterly update Nickel Industries Limited (ASX: NIC) lodged with the ASX on 21 October 2026 for the quarter ended 30 September 2026. It covers safety and ESG, a quarterly summary, Hengjaya Mine mining results, the Sampala and Siduarsi projects, HPAL and RKEF operations, cash flow and FY26 guidance progress.
Group Adjusted EBITDA was US$125.9m, up 4% on the June 2026 quarter. The Hengjaya Mine delivered a second consecutive record with US$76.9m Adjusted EBITDA on 4.5m wmt of ore sales, RKEF Adjusted EBITDA fell 33% to US$40.7m, and the ENC HPAL project produced its first MHP and Class 1 nickel cathode.
All financial figures are in US dollars (US$), which is how Nickel Industries reports, even though the company is listed on the Australian Securities Exchange. Ore volumes are in wet metric tonnes (wmt) and nickel output in tonnes or kilotonnes of contained nickel.
In this deck FY26 lines up with calendar year 2026: the guidance slide compares 'YTD Sep-26' (nine months) to the FY26 outlook and refers to the 2026 RKAB sales quota. YTD sales reached 73% of the mine guidance midpoint, 81% for RKEF and 55% for HPAL, with total capex at US$51.0m against US$66-73m guidance.
RKEF (rotary kiln electric furnace) lines produce nickel pig iron (NPI), mainly for stainless steel. HPAL (high pressure acid leach) plants process limonite ore into mixed hydroxide precipitate (MHP), a battery-grade feedstock that ENC further refines into nickel and cobalt cathode.
Cash flow before growth and debt was negative US$12.2m, mainly because of working capital (higher receivables and inventory). Growth spend was US$50.5m, net debt stood at US$1,104m, and the waterfall takes cash from US$268.3m at the start of the quarter to US$145.9m at the end.
Yes. The gallery page provides the original PDF and an editable PPTX version converted from it, so you can reuse the segment KPI tiles, quarter-on-quarter tables, waterfall chart and commissioning timeline as a template for your own quarterly report.
The presentation was lodged with the ASX as a company announcement by Nickel Industries Limited (ticker NIC) and is also available through the company's investor materials. The slides carry the standard ASX 'For personal use only' watermark.
Official company site with ASX announcements and investor materials

Create Your Own Slides
Turn your ideas into professional presentations in seconds with 2slides AI.
Reference professional designs, choose your style, and generate slides with perfect text rendering. Powered by Nano Banana—start creating your presentation now.
Your AI Agent for slides. Save time, shine faster with intelligent presentation creation.


© 2026 2slides. All rights reserved.