
Part of Investor presentation examples
Champion Iron Q2 FY2027 Results Presentation — the 22-slide webcast deck Champion Iron Limited (ASX: CIA, TSX: CIA, OTCQX: CIAFF) presented in Montréal on October 29, 2026 for the second quarter of its 2027 financial year, lodged with the ASX. Champion's financial year ends March 31, so FY2027 runs April 2026 to March 2027 and Q2 covers July to September 2026. All amounts are in Canadian dollars (C$) unless otherwise stated, with iron ore index prices and freight shown in US$. The deck covers consolidated production of 3,872,500 wmt and record sales of 4,494,100 dmt, revenues of $403.9M, adjusted EBITDA of $23.3M, segmented results for the Bloom Lake mine in Québec and the newly acquired Rana Gruber operation in Norway, the ramp-up of the $500M Direct Reduction Pellet Feed (DRPF) project, cash and liquidity, and a market update on freight rates and the DR pellet premium.
Uses this deck’s cover as a style reference for slides made from your own content. Or pick any page below to use its layout as the reference.
Quick Navigation
Tags
Share the slides
Champion Iron Q2 FY2027 Results Presentation — the 22-slide webcast deck Champion Iron Limited (ASX: CIA, TSX: CIA, OTCQX: CIAFF) presented in Montréal on October 29, 2026 for the second quarter of its 2027 financial year, lodged with the ASX. Champion's financial year ends March 31, so FY2027 runs April 2026 to March 2027 and Q2 covers July to September 2026. All amounts are in Canadian dollars (C$) unless otherwise stated, with iron ore index prices and freight shown in US$. The deck covers consolidated production of 3,872,500 wmt and record sales of 4,494,100 dmt, revenues of $403.9M, adjusted EBITDA of $23.3M, segmented results for the Bloom Lake mine in Québec and the newly acquired Rana Gruber operation in Norway, the ramp-up of the $500M Direct Reduction Pellet Feed (DRPF) project, cash and liquidity, and a market update on freight rates and the DR pellet premium.
Detailed view of each slide page, including layout, key content and visual elements.
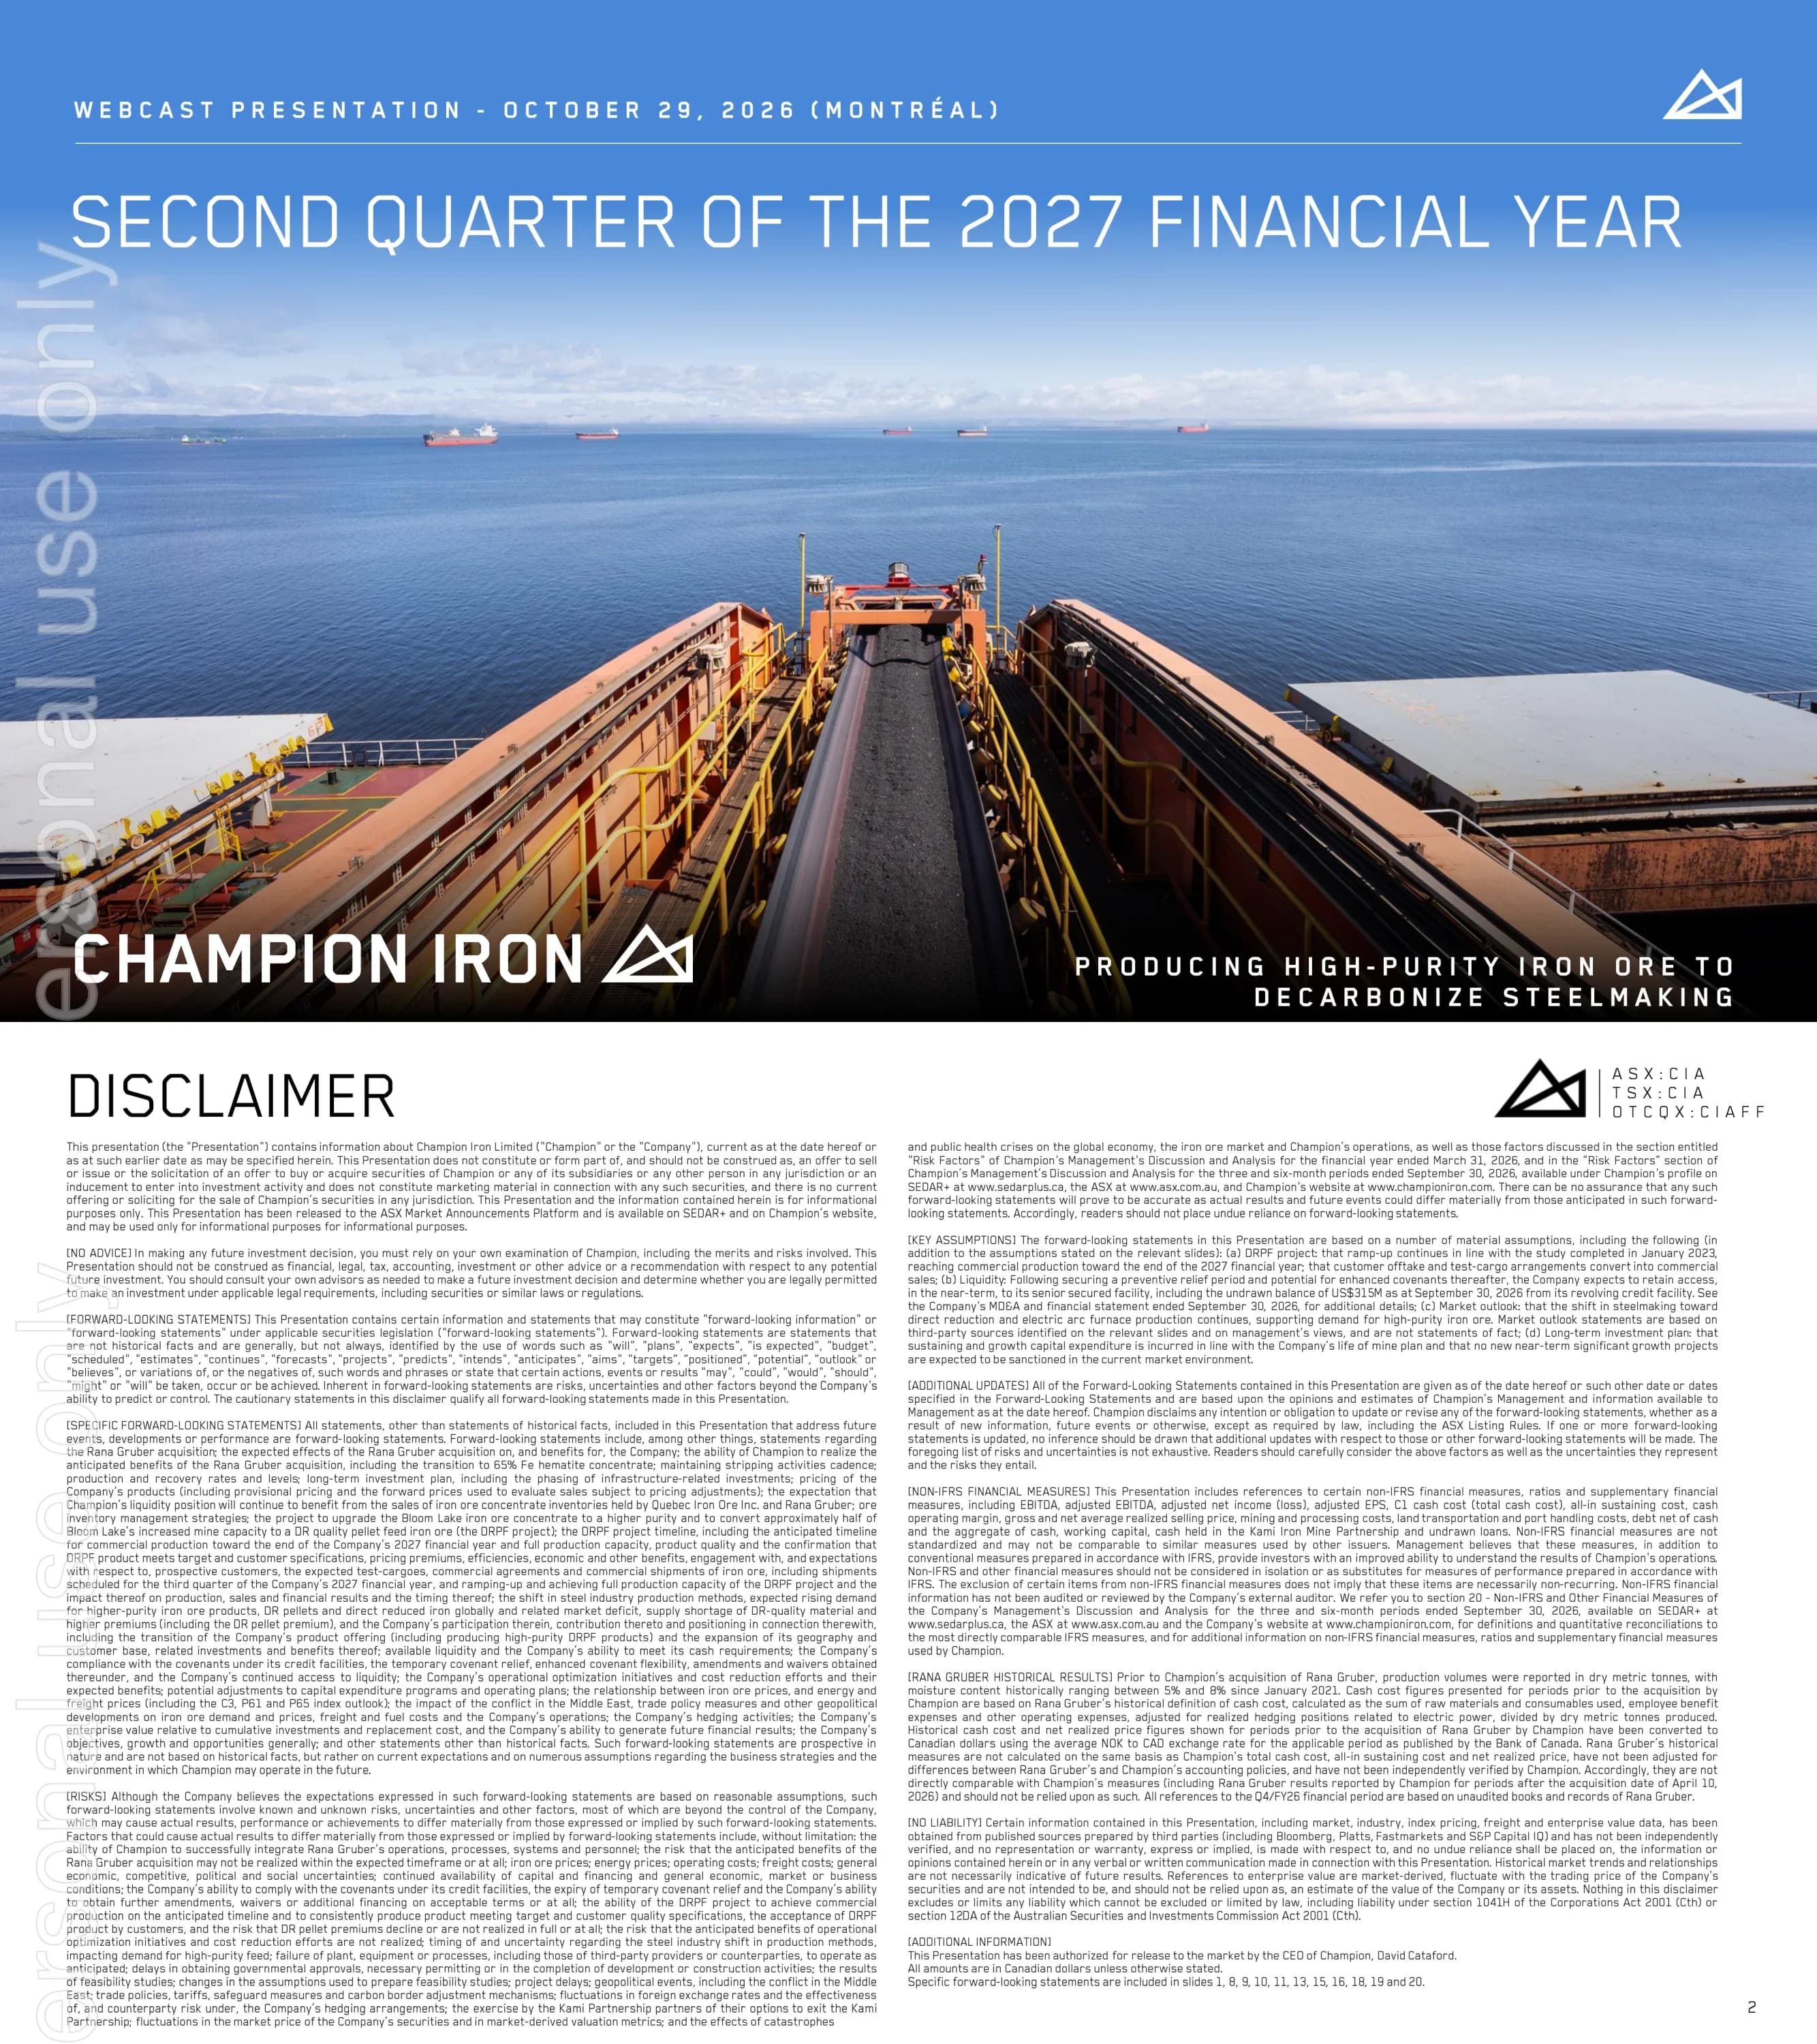
Title slide for the Champion Iron webcast presentation dated October 29, 2026 (Montréal) covering the second quarter of the 2027 financial year, with the tagline 'Producing high-purity iron ore to decarbonize steelmaking'.
Full-bleed photograph of a ship-loading conveyor at sea with bulk carriers on the horizon; spaced-out small caps header line at top, large thin sans-serif title, Champion Iron wordmark bottom left and tagline bottom right.
Two-column legal disclaimer: no offer or advice, forward-looking statements (Rana Gruber acquisition, DRPF ramp-up toward commercial production by the end of FY2027, test cargoes, DR pellet premium, liquidity and covenant relief), key assumptions, risk factors, non-IFRS measures (EBITDA, adjusted EBITDA, C1 cash cost, all-in sustaining cost, etc.), Rana Gruber historical-results basis and no-liability clauses. States the presentation was released to the ASX Market Announcements Platform, authorized for release by CEO David Cataford, and that all amounts are in Canadian dollars unless otherwise stated; it also references US$315M of undrawn revolving credit facility as at September 30, 2026.
Dense two-column body text in small type under a large 'DISCLAIMER' heading, with ticker block (ASX:CIA, TSX:CIA, OTCQX:CIAFF) next to the logo.
Introduces the four presenters: David Cataford (Chief Executive Officer), Michael O'Keeffe (Executive Chairman), Alexandre Belleau (Chief Operating Officer) and Michael Marcotte (Chief Financial Officer).
Four equal-width portrait photos on black backgrounds in a row, with names and titles in a light grey band below, separated by thin vertical rules.
KPI dashboard: 3,872,500 wmt concentrate produced and 4,494,100 dmt sold; total cash cost $82.9/dmt sold and all-in sustaining cost $97.9/dmt sold; revenues $403.9M, EBITDA / adjusted EBITDA $3.7M / $23.3M, EPS / adjusted EPS $(0.09) / $(0.06); cash $267.7M (including $214.4M cash and $53.3M held in the Kami Iron Mine Partnership), working capital $122.2M, short-term and long-term debt $1,303.1M and available loans $404.1M (including the US$315M revolving facility net of US$31.2M letters of credit). Banner: no significant environmental incidents reported since the recommissioning of Bloom Lake in 2018.
Four columns, each topped by a triangular textured-rock tile with a white line icon (haul truck, cycling dollar, banknote, bank), followed by stacked large figures with caption labels; black full-width banner near the bottom and footnotes.
Consolidated quarterly production of 3.9M wmt of high-purity iron ore concentrates, down 2% quarter-over-quarter due to DRPF commissioning inefficiencies and scheduled maintenance on both Bloom Lake plants; record consolidated quarterly sales of 4.5M dmt, up 35% quarter-over-quarter on strong Bloom Lake and Rana Gruber volumes, lowering inventories; inaugural commercial shipment of DRPF product completed during the quarter.
Arrow-bulleted text column on the left, large close-up photo of iron ore concentrate pouring into a ship hold on the right.
Activities in Montréal and Fermont for the National Day for Truth and Reconciliation; signing of the Land Guardians Agreement with Innu Takuaikan Uashat mak Mani-utenam (ITUM) to protect and monitor land across Nitassinan; community engagement in Québec and Norway through regional events, education and scholarships; first phase of the Escoumins River restoration project under the Fish Habitat Compensation Plan; workshop with Rana Gruber teams to share best practices.
Five arrow bullets on the left; photo collage of six images on the right (group photos, teepee with drone light show, Rana Gruber information booth, riverbank site visit, award ceremony).
Section break introducing the per-operation results for Bloom Lake and Rana Gruber.
Full-bleed darkened photograph of the Bloom Lake site with a conveyor gantry, translucent white triangle logo motif and large thin title at bottom left.
Quarterly concentrate production of 3.3M wmt (3.2M dmt), including 0.6M wmt through the DRPF plant, and sales of 3.9M dmt; DRPF commissioning progressing as planned with weighted average product grade up from 66.5% to 66.7% year-over-year; Fe recovery down to 78.2% from 79.6% year-over-year on higher tailings losses during commissioning. Table for Q3/26, Q4/26, Q1/27, Q2/27 and LTM: high-purity hematite produced 3.7 / 3.4 / 2.9 / 2.7 / 12.7 M wmt; DRPF production 0.0 / 0.0 / 0.6 / 0.6 / 1.2; total produced 3.7 / 3.4 / 3.5 / 3.3 / 14.0; sold 3.9 / 3.5 / 3.1 / 3.9 / 14.4 M dmt; waste mined 12.1 / 11.0 / 10.1 / 11.9 / 45.0; ore mined 10.5 / 9.9 / 9.7 / 9.8 / 40.0; strip ratio 1.1 / 1.1 / 1.0 / 1.2 / 1.1; head grade Fe 29.1 / 28.8 / 29.5 / 30.3 / 29.4%; Fe recovery 79.7 / 80.6 / 79.0 / 78.2 / 79.4%; product Fe 66.5 / 66.2 / 66.5 / 66.7 / 66.5%.
Bullets top left above a grey-header data table with the current quarter boxed in dashes and LTM in a separate box; four small bar charts on the right (concentrate produced stacked hematite/DRPF, concentrate sold, material mined stacked waste/ore, Fe recovery).
Land transport and port handling $24.1/dmt sold, comparable with the prior year; total cash cost $82.5/dmt sold, affected by elevated fuel prices, DRPF-related processing costs and lower volumes; all-in sustaining cost $94.4/dmt sold, in line year-over-year as lower sustaining capex offset higher cash costs. Tables (Q3/26, Q4/26, Q1/27, Q2/27, LTM): mining and processing costs 47.3 / 60.0 / 54.5 / 60.5 / 55.4 $/dmt produced; land transport and port handling 26.5 / 23.8 / 30.6 / 24.1 / 26.1; total cash cost 73.9 / 82.7 / 83.4 / 82.5 / 80.4; AISC 89.7 / 96.9 / 104.4 / 94.4 / 95.9; net realized price 121.3 / 120.0 / 106.4 / 89.5 / 109.1 $/dmt sold; revenues 472.3 / 414.5 / 333.0 / 349.6 / 1,569.4 $M; gross profit 140.3 / 85.6 / 27.4 / (27.3) / 226.0 $M.
Four bar charts in a 2x2 grid on the left (total cash cost, AISC, net realized price, revenues), arrow bullets and two grey-header tables on the right with dashed Q2/27 highlight.
The DRPF project was completed within its $500M budget (excluding ramp-up costs) and is ramping up toward commercial production by the end of the Company's 2027 financial year; volumes stayed comparable quarter-over-quarter despite planned maintenance; average product grade continued to move toward target specifications; additional test cargoes and commercial agreements secured for shipments scheduled for Q3 FY27, with discussions continuing with prospective customers.
Arrow bullets on the left; on the right a large captioned photo ('DRPF reclaiming') above two smaller captioned photos ('Flotation cell', 'General overview').
Operating: quarterly concentrate production of 0.5M wmt, up 40% quarter-over-quarter from a full period of Champion ownership, higher mill throughput, head grade and recovery; sales of 0.6M dmt, up 179% quarter-over-quarter on shipment timing and magnetite inventory reduction. Financial: total cash cost $85.3/dmt sold, helped by higher production and cost control but offset by higher diesel and explosives prices; AISC $97.1/dmt sold, lower than the prior quarter; net average realized price $92.5/dmt sold and revenues of $54.3M. Footnote: Q1 FY27 covers April 10, 2026 (acquisition date) to June 30, 2026; earlier quarters are Rana Gruber historical results.
Two text sections (Operating results, Financial results) on the left; 2x2 bar charts on the right (concentrate produced stacked hematite/magnetite, concentrate sold, total cash cost, net realized price) with a shaded pre-acquisition background on earlier quarters.
Section break introducing consolidated group results.
Full-bleed darkened photo of a line of site workers in high-visibility gear beside an ambulance, translucent triangle overlay and large title bottom left.
Q2/FY27 gross average realized selling price of US$105.5/t, below the P65 index average of US$112.8/t, due to short-term spot exposure and discounts during Bloom Lake's transition to DR-quality products, partly offset by backward-looking contracts; 3.4M dmt of sales remained subject to pricing adjustments at September 30, 2026, provisionally valued at an average forward price of US$103.4/t. Freight rose to US$40.4/t with the C3 index, driven by the Middle East conflict, tonne-mile demand and cost inflation, though the Company's costs rose more slowly thanks to its vessel booking strategy and fixed-price contracts. Waterfall: P61 index US$96.9, P65 index US$112.8, gross realized US$105.5, freight and other US$(40.4), provisional sales adjustment US$(1.1), FOB price US$64.0, FX conversion C$25.9, net realized price C$89.9 per dmt.
Two arrow-bulleted paragraphs with square sub-bullets across the top half; full-width waterfall chart below with blue increase, grey decrease and black total bars.
Quarterly revenues $403.9M, adjusted EBITDA $23.3M, EBITDA $3.7M, adjusted EPS $(0.06) and EPS $(0.09), hurt by lower iron ore prices, higher ocean freight and fuel, partly offset by higher sales volumes; total cash cost $82.9/t and AISC $97.9/t. Tables (Q3/26, Q4/26, Q1/27, Q2/27, LTM): total cash cost 73.9 / 82.7 / 83.7 / 82.9 / 80.7; AISC 89.7 / 96.9 / 111.3 / 97.9 / 98.5; cash operating margin 31.6 / 23.1 / -4.4 / -8.0 / 10.0 $/dmt and 26.1% / 19.3% / -4.1% / -8.9% / 9.2%; revenues 472.3 / 414.5 / 356.9 / 403.9 / 1,647.6 $M; EBITDA 152.4 / 114.3 / 32.8 / 3.7 / 303.2; adjusted EBITDA 158.3 / 105.2 / 78.3 / 23.3 / 365.1; operating cash flow 81.7 / 152.1 / 51.0 / 82.4 / 367.2; net income 65.0 / 23.2 / -41.5 / -48.4 / -1.7; adjusted net income 70.4 / 16.5 / -6.0 / -34.3 / 46.7; EPS 0.12 / 0.04 / -0.07 / -0.09 / 0.00; adjusted EPS 0.13 / 0.03 / -0.01 / -0.06 / 0.09.
Bullets top left, two grey-header tables below with dashed Q2/27 box and LTM box; two stacked bar charts on the right (revenues, adjusted EBITDA).
Cash of $214.4M excluding $53.3M held in the Kami Iron Mine Partnership; cash up $15.7M quarter-over-quarter on robust sales and a favorable working capital variance; sustaining capex focused on tailings and water infrastructure, mining equipment overhauls and mine development. Waterfall from cash at June 30, 2026 of $198.6M: operating cash flow before working capital +$27.5M, change in working capital +$54.9M, net new debt +$31.7M (includes $48.5M new debt and $(16.9)M repayments), sustaining and other capex $(80.4)M, DRPF capex $(3.2)M, dividend paid $(11.2)M, other $(3.4)M, to cash at September 30, 2026 of $214.4M.
Three arrow bullets across the top; full-width cash waterfall chart below with labelled bars and legend.
Balance sheet: $214.4M cash, $53.3M cash in Kami Iron Mine Partnership, $122.2M working capital, $1,303.1M short- and long-term debt. Liquidity: debt net of cash of $913.2M (including working capital and Kami cash) and $404.1M available loans. Total cash, working capital, Kami cash and undrawn loans of $794.0M. The Company expects liquidity to benefit from selling 1.3M wmt of concentrate inventories held by QIO and Rana Gruber (as at September 30, 2026), from cost reduction and the DRPF's impact on realized prices, and has amended the financial covenants under its senior secured credit facility for added flexibility.
Two grey panels at top (Balance Sheet, Liquidity Position) with black circular icons and bold figures; light-blue lower band with four text columns and a horizontal stacked bar (cash, restricted cash, working capital, available loans) on a 0–800 million axis.
Section break introducing the iron ore and freight market update.
Full-bleed muted photo of a bulk carrier on a fjord-like waterway with forested hills, translucent triangle overlay and large title.
Subtitle: freight rates and iron ore prices historically maintain a strong relationship. Chart from 2009 to 2026 plotting the P65 index (grey area) and C3 freight (blue area) in US$/t, with C3 as a percentage of P65 (black line, right axis up to 50%) against its long-run average (dotted line). Banner: the C3 freight index relative to P65 pricing recently reached abnormally elevated levels. Sources: Platts, Bloomberg, as of October 22, 2026.
Full-width dual-axis area-and-line chart with legend below and black takeaway banner at the bottom.
Subtitle: resilient DR pellet pricing despite a softer iron ore environment. Chart from Oct-25 to Sep-26 showing the P65 index (light-blue area, US$/dmt) and the DR pellet premium (step line, US$/dmt on a P65 basis, right axis) stepping up from roughly 38 to about 58 by September 2026 (values read from the chart axis). Banner: despite soft iron ore markets, the DR pellet premium has increased, which management views as reflecting a continued supply shortage of DR-quality material. Source: Bloomberg, Platts, Fastmarkets.
Full-width dual-axis chart with step line over shaded area, legend below and black takeaway banner.
Line chart of Champion Iron's market-derived enterprise value (C$M) from 2022 to 2026: $4.2B as at January 25, 2023 when Bloom Lake operated only the Phase I plant (7.4Mt) at 66.2%, versus $2.5B as at October 19, 2026 with two plants (15 Mt), capability to produce up to 69% Fe and the Rana Gruber acquisition (2 Mt). Callout: cumulative investments at Bloom Lake of approximately $6.7B (excluding Rana Gruber). Banner: the investment cycle is complete with DRPF construction finished (ramp-up ongoing) and average annual EBITDA of $588M (excluding Rana Gruber) over the last five full financial years; footnote lists FY2022–FY2026 EBITDA of $925.8M, $493.2M, $552.5M, $471.3M and $499.3M.
Line chart across the slide with green dashed callout box (past EV) and red dashed callout box (current EV) linked to circled points, grey callout box on the right, black banner at the bottom and dense footnotes.
Recognition slide under the theme 'Upholding our values for a sustainable future', presenting four company values — Transparency, Respect, Ingenuity and Pride — each paired with a photo of an employee in high-visibility gear.
Dark starry granite-texture background, four overlapping circular photos in a row with letter-spaced value labels and upward arrows below.
Closing slide with the Champion Iron wordmark and investor contact details (info@championiron.com and +1 514-316-4858).
Full-bleed night aerial photo of the Bloom Lake site in snow, large thin 'THANK YOU', wordmark between two hairlines, contact text below and translucent triangle overlay.
Common questions about this slide and the underlying presentation content.
It is the 22-slide webcast deck Champion Iron Limited presented in Montréal on October 29, 2026 for the second quarter of its 2027 financial year. It was lodged with the ASX (ticker CIA; the company is also listed on the TSX and quoted on OTCQX as CIAFF) and covers highlights, Bloom Lake and Rana Gruber segment results, consolidated financials, cash and liquidity, and a market update.
Champion Iron's financial year ends on March 31, not June 30 like many ASX companies. FY2027 therefore runs from April 1, 2026 to March 31, 2027, and Q2 FY2027 covers July to September 2026 (the quarter ended September 30, 2026).
The disclaimer states that all amounts are in Canadian dollars unless otherwise stated. Iron ore index prices, realized selling prices before FX conversion and freight are shown in US$, and the price waterfall converts the US$64.0 FOB price into a C$89.9/dmt net realized price.
Per the highlights slide: 3,872,500 wmt of concentrate produced, 4,494,100 dmt sold (a record), revenues of $403.9M, EBITDA of $3.7M and adjusted EBITDA of $23.3M, EPS of $(0.09) and adjusted EPS of $(0.06), total cash cost of $82.9/dmt sold and all-in sustaining cost of $97.9/dmt sold.
DRPF is Champion's Direct Reduction Pellet Feed project at Bloom Lake, which upgrades about half of the mine's capacity to DR-quality (up to 69% Fe) concentrate for direct-reduction steelmaking. The deck says it was completed within its $500M budget (excluding ramp-up costs), produced 0.6M wmt in the quarter, made its inaugural commercial shipment, and is targeting commercial production toward the end of FY2027.
Rana Gruber, the Norwegian producer acquired on April 10, 2026, produced 0.5M wmt (up 40% quarter-over-quarter) and sold 0.6M dmt (up 179%), with total cash cost of $85.3/dmt sold, AISC of $97.1/dmt sold, a net average realized price of $92.5/dmt sold and revenues of $54.3M.
Yes. The page offers the original PDF and an editable PPTX converted from it. The layouts — KPI tiles, quarter-over-quarter tables with a highlighted current column, segment chart grids and waterfall charts — work well as a template for any mining or commodity results presentation; replace Champion Iron's data and branding with your own.
The presentation was released to the ASX Market Announcements Platform and, according to its disclaimer, is also available on SEDAR+ and on Champion Iron's website, alongside the company's MD&A for the three and six months ended September 30, 2026.
Original deck lodged with the ASX Market Announcements Platform
Investor relations materials, MD&A and financial statements

Create Your Own Slides
Turn your ideas into professional presentations in seconds with 2slides AI.
Reference professional designs, choose your style, and generate slides with perfect text rendering. Powered by Nano Banana—start creating your presentation now.
Your AI Agent for slides. Save time, shine faster with intelligent presentation creation.


© 2026 2slides. All rights reserved.