
Part of Investor presentation examples
Greatland Resources September 2026 Quarter Presentation (26 October 2026): quarterly results for the ASX- and AIM-listed gold-copper producer operating Telfer and developing Havieron in Western Australia's Paterson Province. Lodged with the ASX alongside the September 2026 Quarterly Activities Report. The deck covers 70.1koz gold and 2.9kt copper produced at an AISC of A$2,925/oz (all amounts in Australian dollars), A$485m net revenue, A$289m operating cash flow, a A$1,314m cash balance with no debt, the formal start of Havieron construction, and FY27 guidance. The cover is titled 'A Leading Australian Gold-Copper Producer In Western Australia's Paterson Province'.
Uses this deck’s cover as a style reference for slides made from your own content. Or pick any page below to use its layout as the reference.
Quick Navigation
Tags
Share the slides
Greatland Resources September 2026 Quarter Presentation (26 October 2026): quarterly results for the ASX- and AIM-listed gold-copper producer operating Telfer and developing Havieron in Western Australia's Paterson Province. Lodged with the ASX alongside the September 2026 Quarterly Activities Report. The deck covers 70.1koz gold and 2.9kt copper produced at an AISC of A$2,925/oz (all amounts in Australian dollars), A$485m net revenue, A$289m operating cash flow, a A$1,314m cash balance with no debt, the formal start of Havieron construction, and FY27 guidance. The cover is titled 'A Leading Australian Gold-Copper Producer In Western Australia's Paterson Province'.
Detailed view of each slide page, including layout, key content and visual elements.
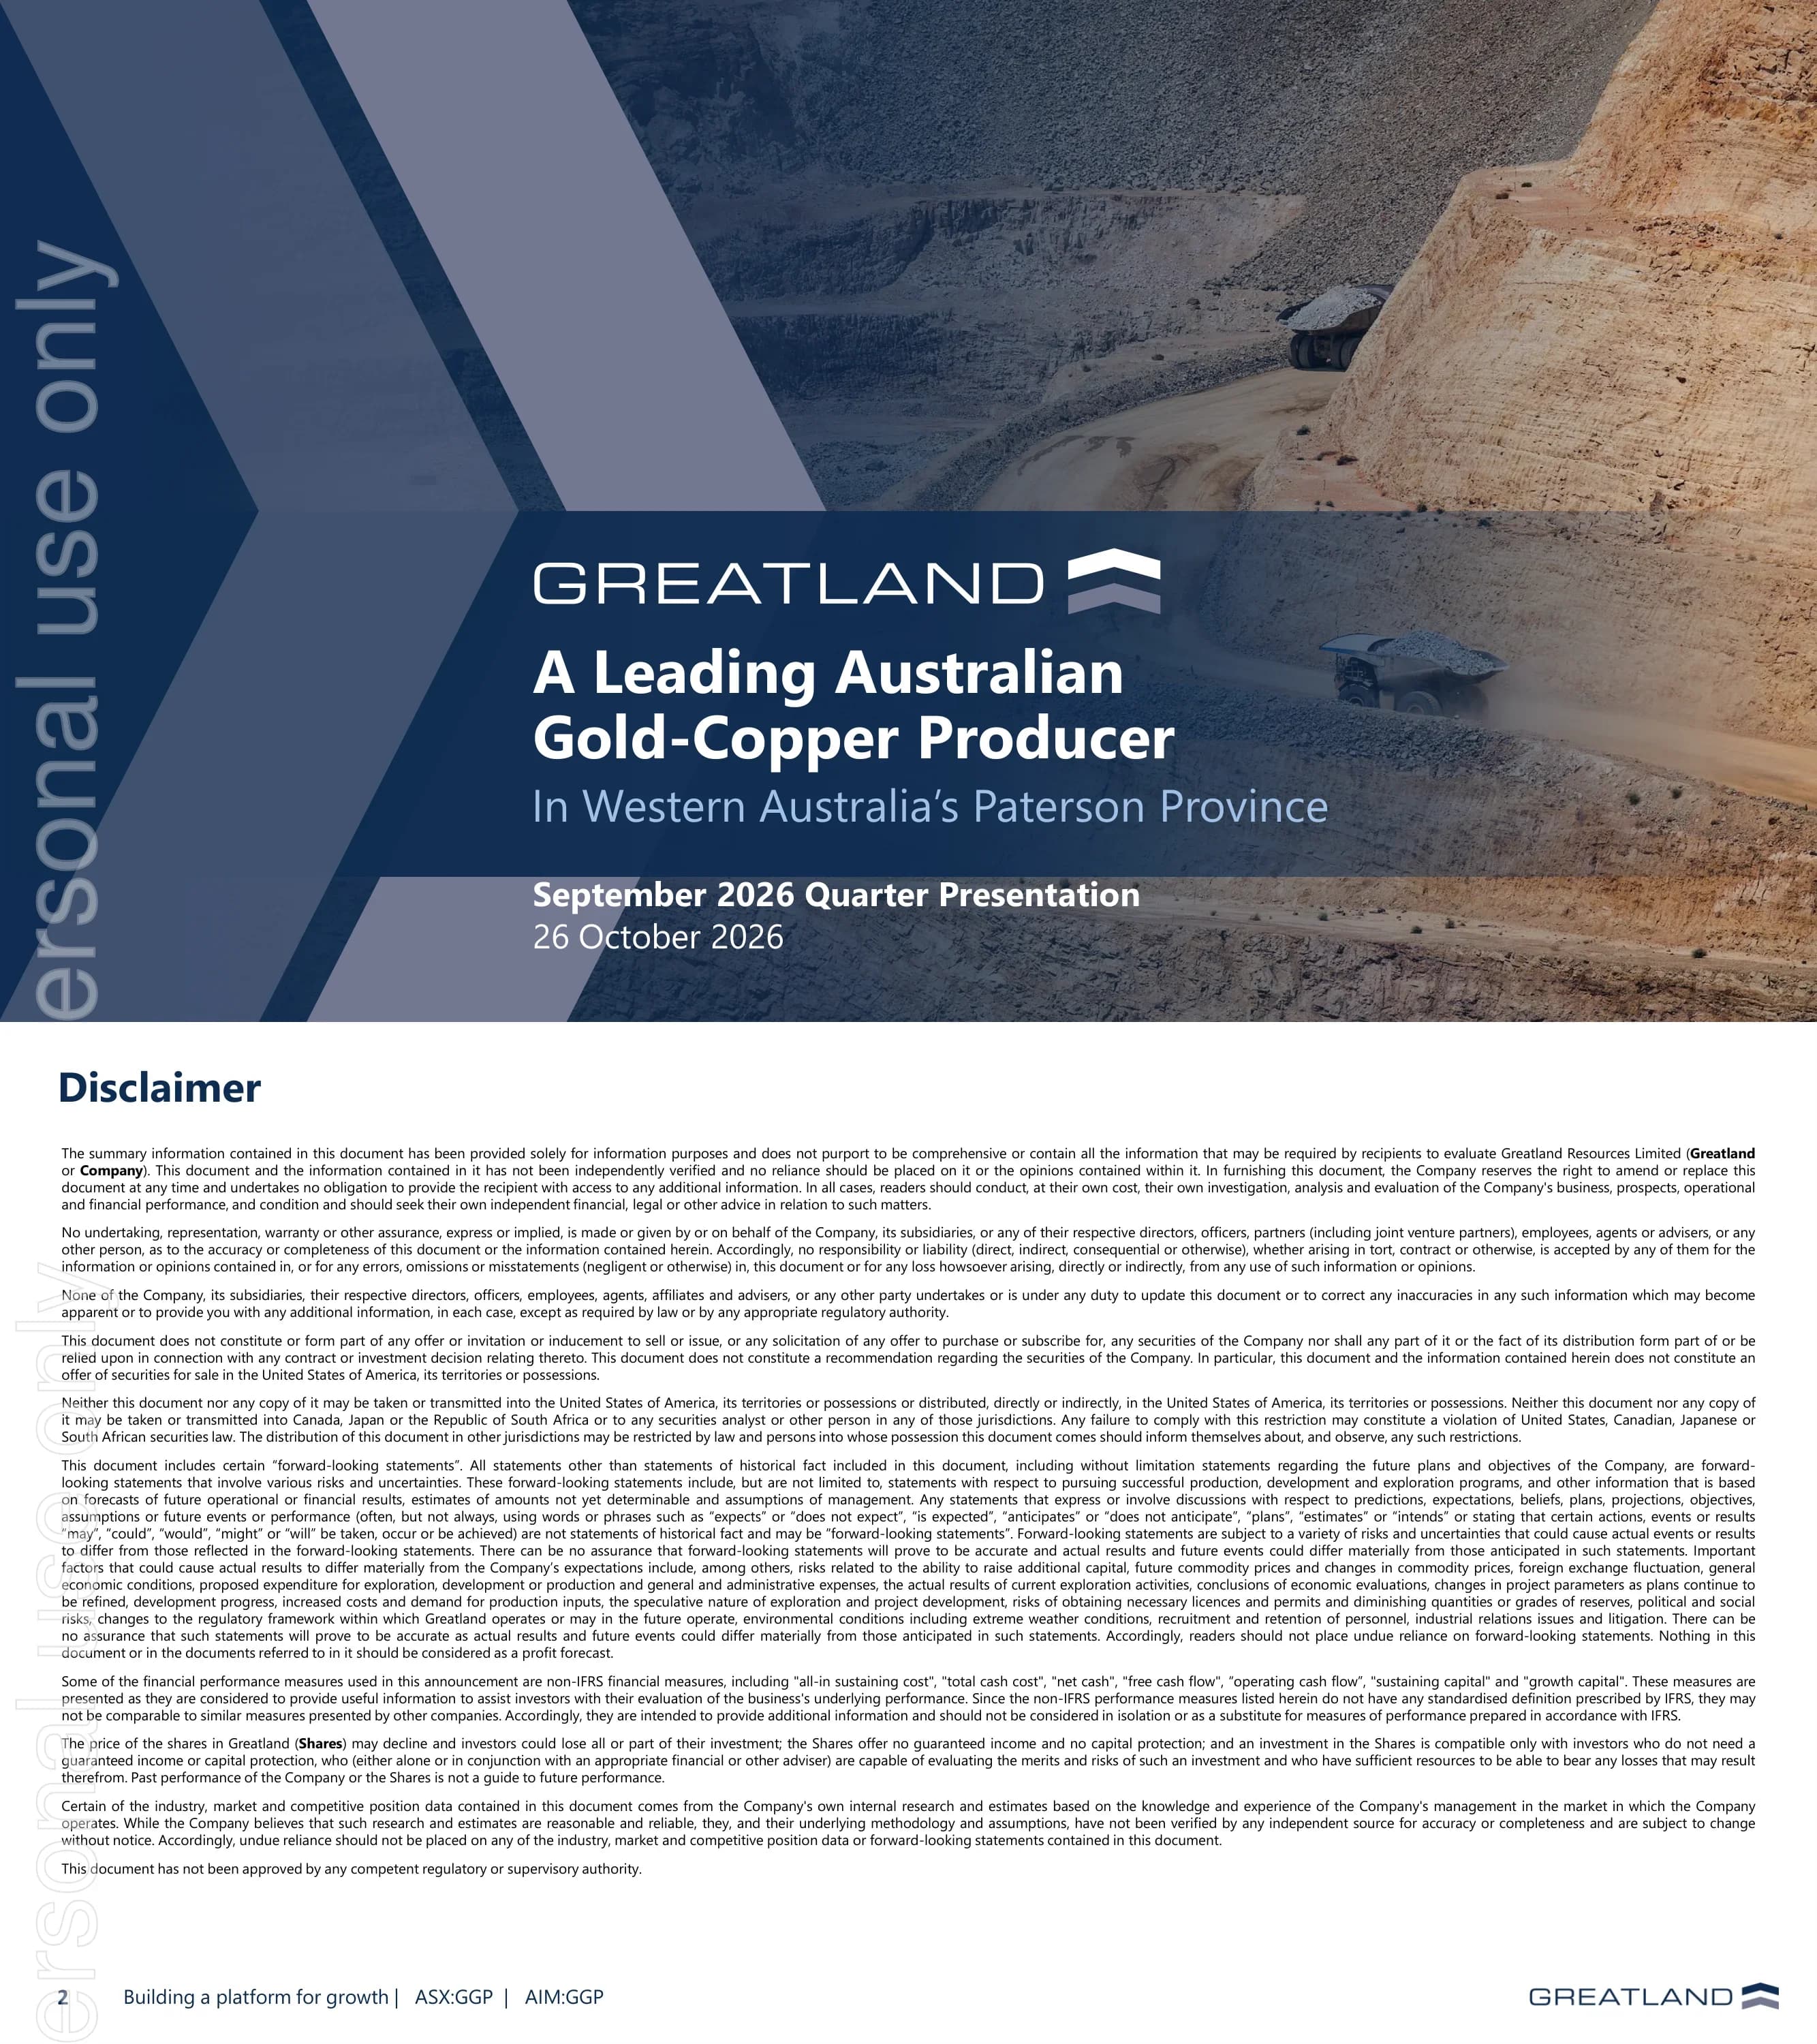
Cover with the Greatland wordmark, the title 'A Leading Australian Gold-Copper Producer In Western Australia's Paterson Province', the subtitle 'September 2026 Quarter Presentation' and the date 26 October 2026.
Full-bleed open pit photograph with haul trucks, overlaid by large navy and slate chevron shapes on the left and a translucent navy band carrying the logo and title text.
Standard legal disclaimer: information is a summary and not independently verified, no offer of securities, distribution restrictions (United States, Canada, Japan, South Africa), forward-looking statements, and use of non-IFRS measures such as all-in sustaining cost, net cash, free cash flow, sustaining and growth capital.
Navy heading at top left with a dense, justified block of small body text on white; footer strip with page number, tagline 'Building a platform for growth | ASX:GGP | AIM:GGP' and logo.
ASX Listing Rule 5.23 statement: Mineral Resource estimates come from the 30 March 2026 'December 2025 Group Mineral Resource Statement' and Ore Reserves from the 29 June 2026 'March 2026 Group Ore Reserve Statement'. The presentation is dated 26 October 2026 and was authorised for release by Managing Director Shaun Day.
Short text blocks under bold sub-headings in the upper part of a white slide, leaving most of the page empty; standard footer.
Section divider introducing the highlights section.
Navy background with a chevron-shaped photo cut-out of processing plant machinery on the left and large white title text on the right.
Six-panel summary: production of 70.1koz Au and 2.9kt Cu at AISC of $2,925/oz, on track for FY27 guidance of 260–300koz at $2,900–3,330/oz; sales of 71.9koz Au and 2.7kt Cu at $5,980/oz realised, net revenue $485m; operating cash flow $289m (June Q: $302m), cash build $25m, cash $1,314m and no debt; available liquidity $1,789m including an undrawn $475m revolving credit facility; Havieron construction phase commenced in September 2026; stockpiles of 27koz Au ROM and 209koz Au low grade. A note states all '$' values are Australian dollars.
Two rows of three columns over a dark navy-tinted mine photograph; each panel has a white line icon, a bold heading, a light-blue rule and text with key numbers enlarged in light blue.
Section divider for the detailed quarterly results.
Navy chevron layout with a night photograph of a lit conveyor gantry and white title text on the right.
Ore mined from open pit was 4.0Mt at 0.45g/t Au and 0.04% Cu (seventh consecutive lift in total material moved) and from underground 0.4Mt at 1.33g/t Au and 0.32% Cu, mainly from A-reef and ESC at Main Dome. Open pit total material moved reached 7,859kt, up 79% from 4,398kt in Mar Q '25. West Dome Stage 7 growth stripping moved 2.8Mt of waste.
Left half shows a 3D mine model titled 'Mining Areas for the Quarter' above a bulleted summary; right half stacks three seven-quarter bar charts (open pit ore with grade line, open pit total material moved, underground ore with grade line) under a 'Key operating metrics' navy header.
Production of 70.1koz Au and 2.9kt Cu. 4.9Mt was processed at 0.50g/t Au and 0.07% Cu, with throughput above the 20Mtpa nameplate run-rate after a planned 15-day maintenance shutdown. Recoveries were 85.1% gold and 82.5% copper. Quarter-end stockpiles were 1.4Mt ROM at 0.60g/t Au and 19.5Mt low grade at 0.33g/t Au; TSF8 Stage 4 is due in Q3 FY27.
Two stacked combo charts on the left (ore milled with head grade; gold produced with recovery) and a bulleted 'Summary' panel on the right under navy header bars.
AISC of A$2,925/oz with an AISC margin of over $3,000/oz. A stacked bar chart breaks AISC costs into mining, processing, site services, TC/RC and freight, royalties, sustaining capex, rehabilitation and by-product credits, totalling A$205.1m in Sep Q '26 against A$191.7m in Mar Q '25. An area chart shows realised price rising from $4,585/oz to a peak of $6,773/oz in Mar Q '26 and $5,980/oz in Sep Q '26, against AISC between $1,736 and $2,925/oz, labelled as a +100% AISC margin.
Two side-by-side chart panels with navy header bars: a stacked column chart with negative by-product credit bars on the left and a shaded area-between-lines chart on the right.
Cash waterfall from $1,289m opening cash (1 July 2026): +$289m operating cash flow, -$36m sustaining capital, -$9m corporate and finance, -$100m tax to $1,433m before growth capital, then -$58m Telfer growth, -$45m Havieron growth and -$17m resource development and exploration to $1,314m closing cash. Key figures: 71,901oz Au sold, 2,714t Cu sold, $485m net revenue, $5,980/oz Au and $16,653/t Cu realised, $1,789m total liquidity. A put option table covers 149,998oz at a weighted average strike of $4,850/oz through September 2027.
Waterfall chart on the left; on the right a grid of eight outlined KPI tiles above a put option table with a navy header row and grey total row.
Section divider for the growth section, subtitled 'Havieron development underway'.
Navy chevron layout with an underground photograph of a worker in high-visibility clothing beside a mining vehicle, white title and light-blue subtitle.
Quarterly commentary by initiative. Telfer: TSF8 Stage 4 due Q3 FY27, Stage 5 starting Q2 FY27; 2.8Mt pre-stripped at West Dome Stage 7; fleet renewal with refurbished trucks arriving over FY27; 674 metres of underground growth development and the West Dome Underground vent circuit completed. Havieron: all secondary approvals obtained, evaporation pond expansion on plan, blind bore pad completed, haul road and HV powerline packages tendered. Exploration: 73km of drilling and 12 rigs active.
Two-column table with icons: growth initiatives on the left, bulleted quarterly commentary on the right, grouped under grey band headers for Telfer, Havieron and exploration.
Telfer growth capital guidance of $315–335m for FY27. A matrix maps five investment areas (open pit fleet purchase and refurbishment, underground growth development, paste infrastructure and power station upgrades, underground project studies, TSF8 Stage 4 and 5 lifts) to the years FY27 to FY30+ in which partial or substantial benefit is expected.
Dotted-outline banner 'Investing in Telfer's multi-year life extension – key areas' above a heat-map style table with icons in the first column and shaded cells for each year, plus a two-colour legend.
Section divider for the guidance section.
Navy chevron layout with a photograph of terraced open pit walls and white title text.
FY27 guidance: gold production 260–300koz, modestly second-half weighted; AISC $2,900–3,330/oz, with Q1 FY27 slightly better than plan. Growth capex: Telfer $315–335m, Havieron $365–435m (first gold about 2.5 years from start of construction), exploration and resource development $70–80m.
Dark photo background with two upper guidance columns (production, AISC) with icons and three lower growth capex columns, each with a heading, rule, light-blue figure and italic commentary.
Five catalysts across H1 and H2 FY27: (1) drilling updates at Pinnacles and West Dome Underground, with 3 surface rigs testing the >1km WDU-Pinnacles trend from January 2027; (2) Telfer Mineral Resource update; (3) studies on West Dome Underground and the Vertical Stockwork Corridor; (4) Telfer Ore Reserve update, including potential to convert 42% more gold from Inferred Resources at West Dome open pit; (5) strategic review of the O'Callaghans tungsten deposit (spin-out/IPO, divestment or JV). Timing is indicative only.
Timeline with a dark navy H1 FY27 arrow and a long light-blue H2 FY27 arrow above five numbered dotted-outline headers, each followed by a column of bulleted text.
Section divider for the conclusion.
Navy chevron layout with a close-up photograph of an excavator bucket loading a haul truck and white title text.
Five themed columns: Strong quarter (production and AISC ahead of plan, mill shut completed, record open pit TMM and ore mined, on track for guidance); Havieron Underway (approvals obtained, evaporation pond, blind bore pad); Robust Treasury ($25m cash build despite higher Havieron capex and tax, $1.3b cash, no debt, $1.8b liquidity); Growth Pipeline (Havieron, West Dome Underground and Vertical Stockwork Corridor); FY27 Drilling (continuing record FY26 drill cadence and an extra rig for Pinnacles).
Five equal columns, each with a dotted-outline header box and bullets, over a faded plant photograph in the lower half.
Closing contact slide with info@greatland.com.au, the website https://greatland.com.au and X and LinkedIn icons.
Chevron layout mirroring the cover, using a daytime photograph of the Telfer processing plant and conveyors, with logo and contact details in a translucent navy band.
JORC 2012 tables. Mineral Resources: Greatland total 549Mt at 0.84g/t Au and 0.12% Cu for 14.9Moz Au and 644kt Cu (Havieron 131Mt at 1.65g/t for 7.0Moz; Telfer 417Mt at 0.59g/t for 7.9Moz). Ore Reserves: group total 157.2Mt at 0.99g/t Au and 0.12% Cu for 5.0Moz Au and 196kt Cu (Telfer 1.8Moz, Havieron 3.3Moz). Footnotes give estimate dates and the metal price assumptions used for cut-offs.
Two dense data tables stacked vertically with navy header rows and bold total rows, followed by several lines of small-print footnotes.
Common questions about this slide and the underlying presentation content.
It is Greatland Resources' 20-slide results deck for the quarter to 30 September 2026, lodged with the ASX on 26 October 2026 alongside its Quarterly Activities Report. It covers Telfer mining and processing, AISC and realised prices, cash flow, Havieron construction, FY27 guidance, catalysts and the Mineral Resource and Ore Reserve tables.
Greatland produced 70.1koz gold and 2.9kt copper at an AISC of A$2,925/oz, sold 71.9koz gold at an average A$5,980/oz for A$485m net revenue, generated A$289m operating cash flow and ended the quarter with A$1,314m cash, no debt and A$1,789m available liquidity.
All '$' amounts are Australian dollars unless stated otherwise. Greatland's fiscal year runs from July to June, so FY27 covers July 2026 to June 2027 and the September 2026 quarter is Q1 FY27.
Gold production of 260–300koz at an AISC of A$2,900–3,330/oz, with growth capital of A$315–335m for Telfer and A$365–435m for Havieron, plus A$70–80m for exploration and resource development.
Yes. Besides the original PDF, an editable PPTX converted from the PDF is available. Because it was converted from a PDF rather than exported from the original PowerPoint file, some charts and text boxes may need minor adjustment after editing.
Yes. It follows a full mining quarterly structure (highlights, mining, processing, costs, cash flow, growth projects, guidance, catalysts, resources and reserves) in a consistent navy and light-blue style with chevron photo dividers, which suits ASX-listed miners and other resources companies.
Telfer is Greatland's operating gold-copper mine and processing plant in the Paterson Province of Western Australia. Havieron is its nearby underground gold-copper development project, whose construction phase formally began in September 2026 with first gold expected about 2.5 years after construction started.
Official company site listed on the deck's closing slide, with ASX announcements and investor materials.

Create Your Own Slides
Turn your ideas into professional presentations in seconds with 2slides AI.
Reference professional designs, choose your style, and generate slides with perfect text rendering. Powered by Nano Banana—start creating your presentation now.
Your AI Agent for slides. Save time, shine faster with intelligent presentation creation.


© 2026 2slides. All rights reserved.