
Part of Investor presentation examples
Meridian Energy Investor Presentation October 2026 — Meridian Energy's 26-page "2026 Investor Presentation" (cover dated November 2026), lodged with the ASX on 26 October 2026. Meridian is a New Zealand renewable generator and retailer dual-listed on the NZX and ASX; all amounts are in New Zealand dollars (NZ$) unless stated otherwise. The deck covers New Zealand's electricity system, Meridian's 100% renewable hydro and wind portfolio, strategy, a 6,384 GWh wind and solar development pipeline, the Waitaki station upgrade, customers, pricing, the Climate Action Plan, FY26 outcomes (NZ$1.05B EBITDAF, NZ$810M operating cash flow, 22.5 cps dividend), five-year financials, risk management, funding and the Green Finance Programme.
Uses this deck’s cover as a style reference for slides made from your own content. Or pick any page below to use its layout as the reference.
Quick Navigation
Tags
Share the slides
Meridian Energy Investor Presentation October 2026 — Meridian Energy's 26-page "2026 Investor Presentation" (cover dated November 2026), lodged with the ASX on 26 October 2026. Meridian is a New Zealand renewable generator and retailer dual-listed on the NZX and ASX; all amounts are in New Zealand dollars (NZ$) unless stated otherwise. The deck covers New Zealand's electricity system, Meridian's 100% renewable hydro and wind portfolio, strategy, a 6,384 GWh wind and solar development pipeline, the Waitaki station upgrade, customers, pricing, the Climate Action Plan, FY26 outcomes (NZ$1.05B EBITDAF, NZ$810M operating cash flow, 22.5 cps dividend), five-year financials, risk management, funding and the Green Finance Programme.
Detailed view of each slide page, including layout, key content and visual elements.
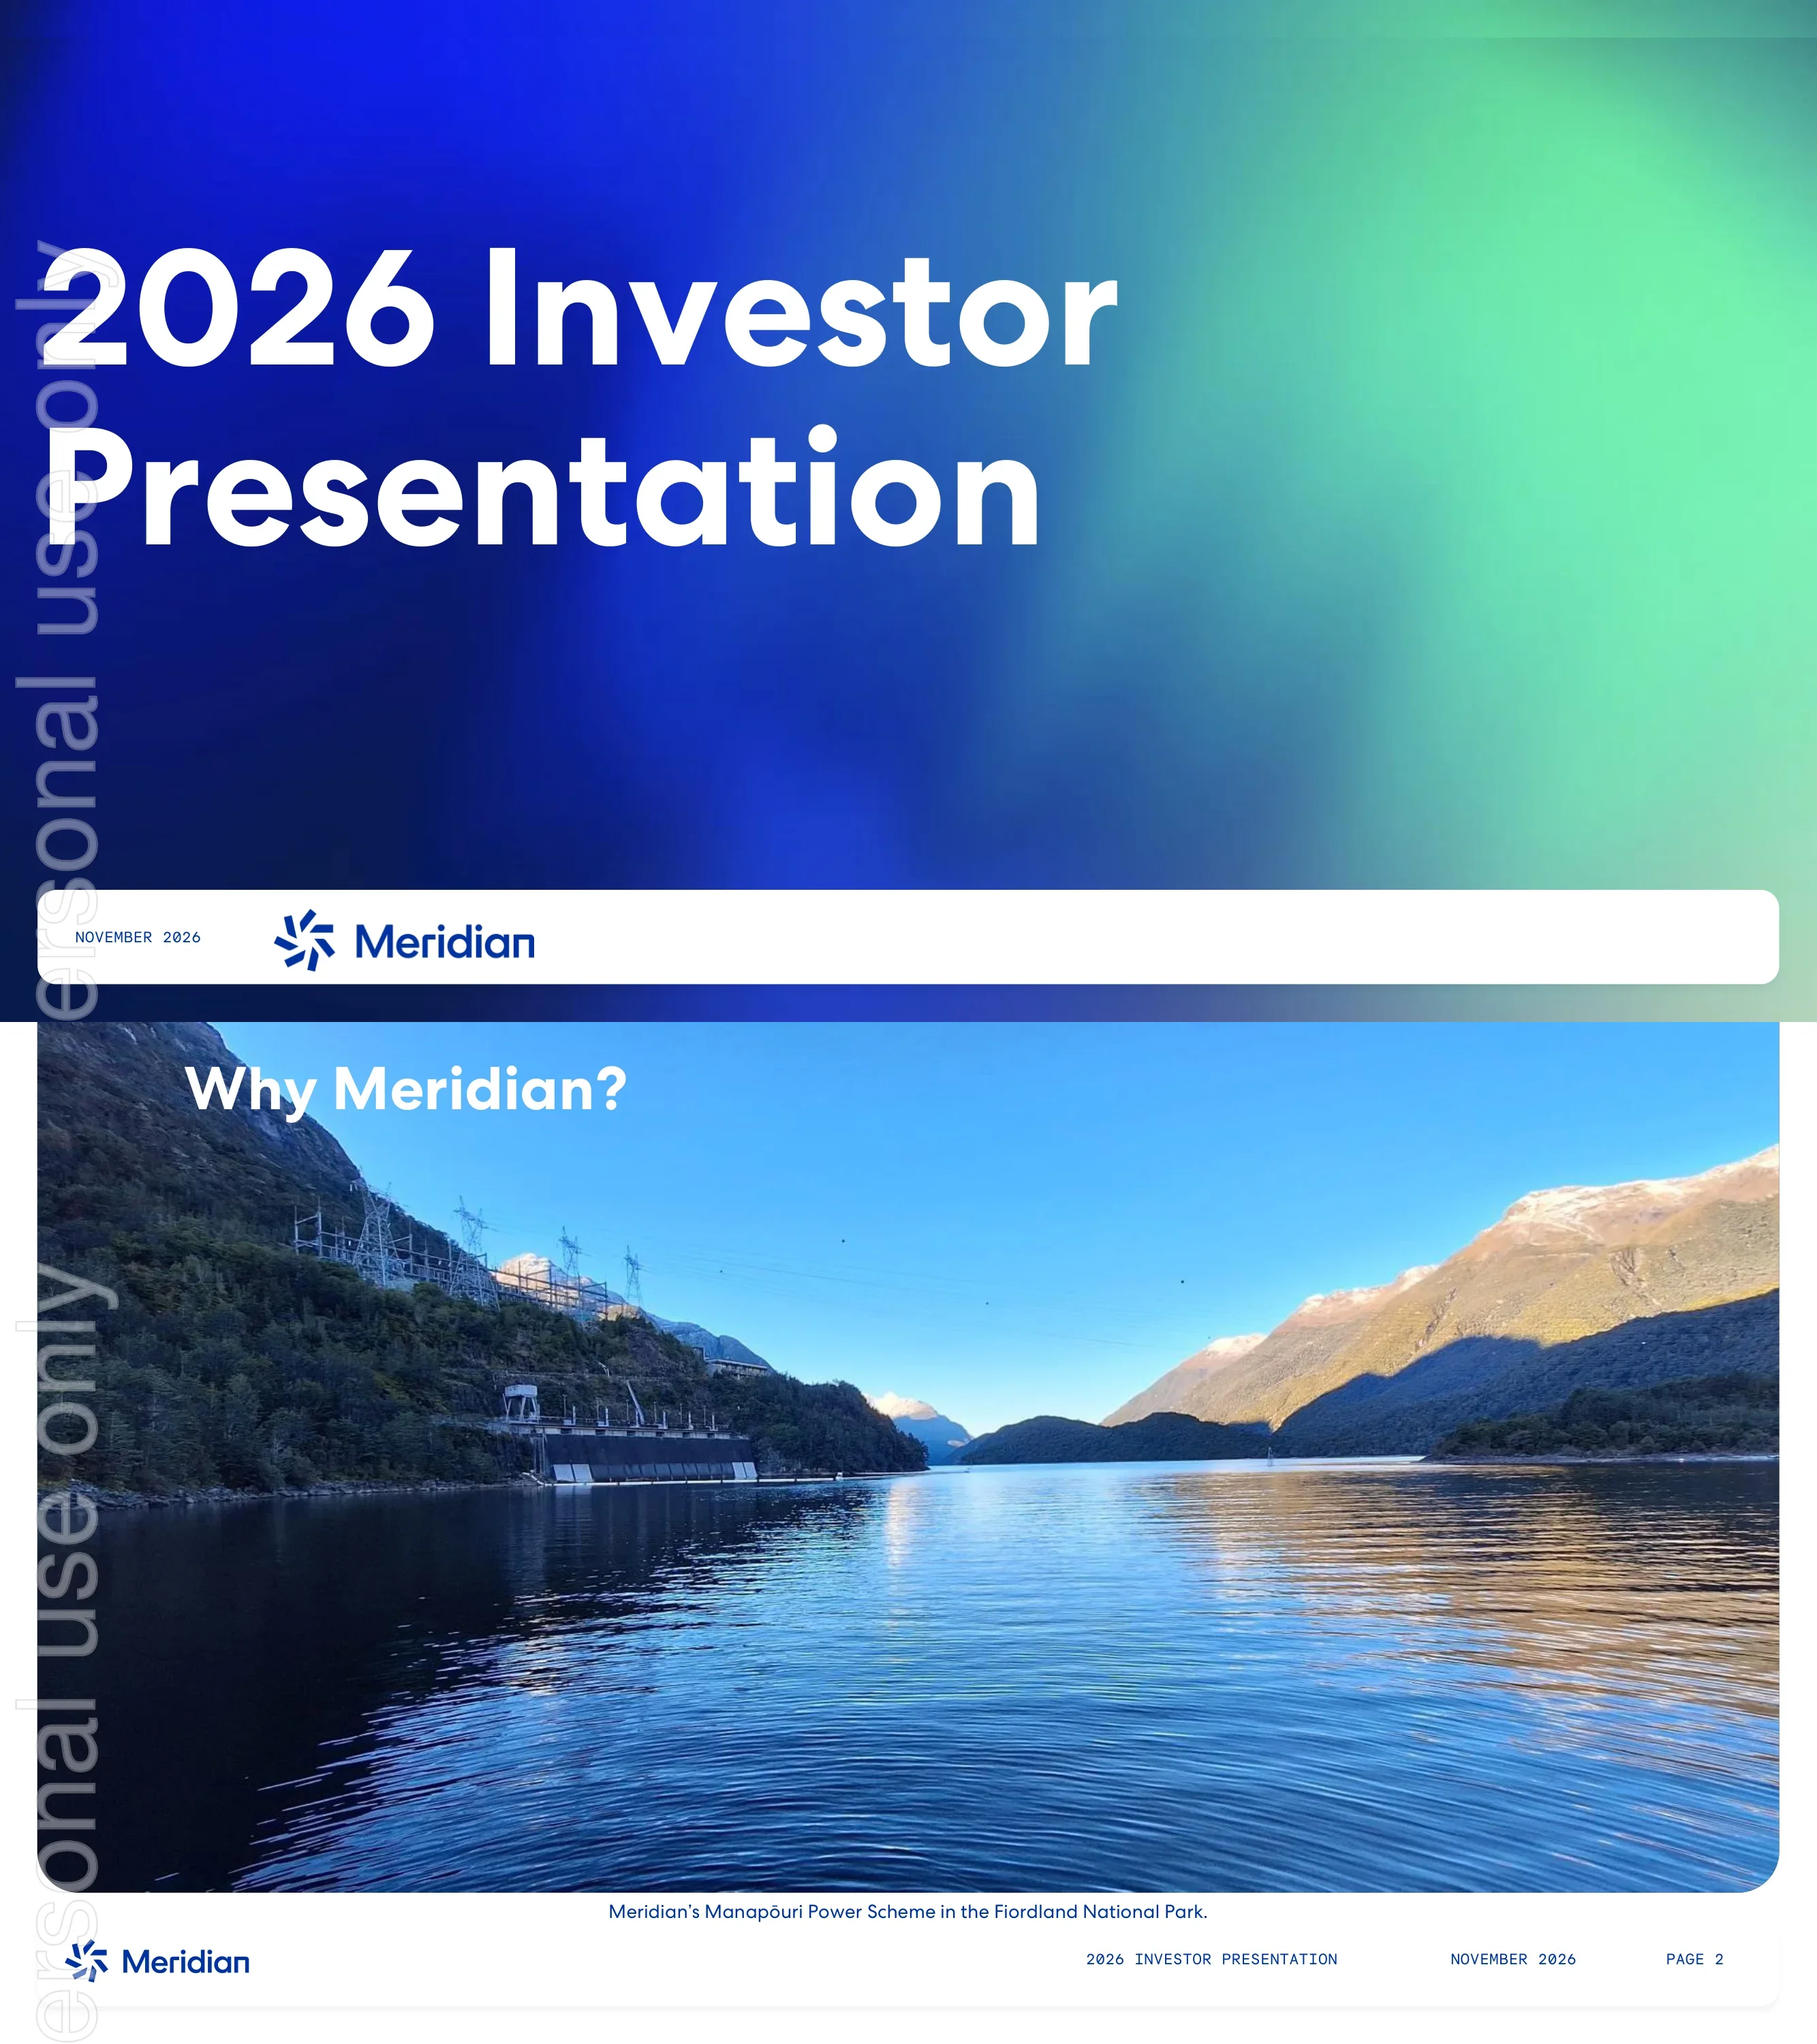
Cover slide titled "2026 Investor Presentation", dated November 2026, with the Meridian logo in a white footer bar.
Full-bleed gradient background (deep royal blue fading to mint green) with a very large two-line white title left-aligned; a rounded white footer strip holds the date and logo.
Section divider introducing the investment case, over a photo of Meridian's Manapōuri Power Scheme in Fiordland National Park.
Full-width rounded photo panel with white title text top-left, a caption line below the photo and the standard footer (logo, deck title, date, page number).
Six investment pillars — quality scale assets, high free cash flow, progressive ordinary dividend, balance sheet headroom, strong growth outlook and a deep renewable development pipeline — sit above a framework where sustainability underpins 'generation of renewable electricity' (new renewables, firming capacity) and 'deliver cleaner, cheaper energy' (customer participation, customer decarbonisation, new demand).
Row of six circular line icons connected by a horizontal line with labels beneath; lower half is a blue block diagram with a 'Sustainability' header bar, two text panels and side callout boxes linked by arrows.
Logo wall of sustainability frameworks and recognitions: UN Sustainable Development Goals, GRI, S&P Global Corporate Sustainability Assessment 2025 score in the top 10%, Science Based Targets, XRB Climate-related Disclosures (NZ CS 1–3), Green Finance Framework, UN Global Compact, Climate Action Plan and FTSE4Good.
White slide with a loose grid of third-party logos and badges of varying sizes, no body text.
Section divider over a photo of the large red penstocks at Meridian's Ōhau A Power Station in the Mackenzie Basin, South Canterbury.
Full-width rounded photo with blue title overlaid at top, caption and standard footer.
Value chain from generators to consumers: 4 major generators (all listed, 3 majority Government owned), 1 state-owned transmission grid owner, 28 distribution businesses, 39 retail brands and about 2.3 million consumers using 39 TWh a year. Donut charts as at 30 June 2026: national generation is 58% hydro, 22% geothermal, 9% wind, 5% gas, 2% coal, 2% solar, 1% wood and 1% biogas, with Meridian holding a 33% generation share; consumption is 34% residential, 32% industrial, 23% commercial, 7% agriculture and 4% other, with Meridian at a 25% share.
Royal-blue background; top half is a line-art infographic of generation, transmission, distribution, retail and end users connected by dashed lines with stat captions; bottom half has two outlined boxes each containing a donut chart with a legend.
New Zealand will need around NZ$30 billion of investment in new renewable generation by 2050; 5 TWh of annual renewable generation was commissioned in 2020–2025 (11% of 2025 generation) and a further 3.4 TWh is under construction or in final commissioning for delivery by 2028. New Planning and Environment Acts passed in 2026 improve consenting, and data-centre interest is growing, with potential compute capacity that could exceed 1 GW (citing BCG, August 2026). A line chart shows historical annual NZ demand for generation (about 36,000 to 44,000 GWh, 2000–2026) and projections to 2050 under Meridian's Evo and Revo scenarios, Climate Change Commission scenarios and four MBIE scenarios, rising to roughly 58,000–78,000 GWh.
Two-column: left column of large blue bullet statements with footnotes; right column a framed multi-line chart with a grey 'History' band and a navy 'projected' header bar.
Section divider over an aerial photo of the headwaters of Lake Pūkaki in the Mackenzie Basin, South Canterbury.
Full-width rounded aerial photo with white title bottom-right over turquoise lake water, caption and footer.
Meridian is New Zealand's largest generator, producing over 30% of the country's electricity, all from renewable sources, with seven large hydro stations, eight wind farms and its first solar farm under construction; it is the largest retailer by volume, rated BBB+ by S&P and 51% Government owned. FY2025/26 generation table: hydro 2,403 MW and 12,571 GWh (87%), wind 647 MW and 1,905 GWh (13%), batteries 100 MW (200 MWh) and 30 GWh, total 3,150 MW and 14,506 GWh. Meridian owns 43% of NZ's installed hydro capacity and produced 49% of the country's hydro generation in 2025/26. A map marks assets including the Waitaki and Manapōuri schemes, wind farms, Ruakākā BESS and solar, and consented projects.
Blue gradient background; left column has aqua headline, intro statement, bordered data table and asset-type icon key; right side is a mint-green map of New Zealand with icon pins and dotted zoom circles; three columns of white bullet text run along the bottom.
Strategy framework with Māori and English labels: purpose 'Clean energy for a fairer and healthier world'; strategy 'Expertly navigate the energy transition for Aotearoa New Zealand'; four priorities — grow renewable generation and firming capacity, deliver cleaner cheaper energy, deliver operational excellence, grow capability and culture — each with a focus statement and key initiatives such as delivering '7 in 7', securing long-term access to water, growing dispatchable MW, expanding digital and demand-flex products, modern data systems and a diverse, safe workforce.
Light grey matrix: left label column (Te Kaupapa / Our Purpose, Te Rautaki / Our Strategy, etc.), wide header rows for purpose and strategy, then four numbered columns with focus text and bulleted initiatives.
Line chart of annual price participation (GWAP/TWAP) from 2002 history through projections to 2050: the Waitaki Power Scheme rises to roughly 140–150% and Manapōuri to about 110%, while wind falls toward 60% and solar toward 40%, illustrating that flexible hydro storage captures higher prices as more intermittent renewables enter the market.
Pale blue background with a single large framed line chart, shaded 'History' region, and direct series labels on the right instead of a legend.
Stacked bar chart of cumulative GWh of new generation from full power date, FY27 to FY35, reaching a total of 6,384 GWh across wind (navy) and solar (grey) projects including Tauhei, Ruakākā, Te Rahui, Manawatū, Morrinsville, Swannanoa, Western Bays and Canterbury Solar and Mt Munro, Te Rere Hau, Waiinu and Manawatū Wind. Inset table: constructed 542 GWh wind; in construction 702 GWh solar; consented 1,110 wind and 617 solar (1,727); currently in consent 350 solar; consents to lodge in FY27 1,875 wind and 1,730 solar (3,605); total not constructed 2,985 wind, 3,399 solar, 6,384 GWh.
Framed chart filling the slide with a pink-tinted summary table inset top-left and project labels stacked to the right of the final bar.
Meridian has committed to upgrading the 92-year-old Waitaki hydro station with a NZ$440M–NZ$510M (nominal) investment over 10 years covering all seven generating units, connection assets and balance of plant — its first full mechanical and electrical hydro refurbishment — extending station life, improving flexibility and resilience and adding 15 MW of capacity. The station powers about 51,000 average New Zealand homes.
Split layout: blue text paragraphs on the left half, a large rounded aerial photo of the station on the right half with a caption beneath.
Customer connections (ICPs, thousands) for Meridian and Powershop: 365 (Jun-22), 363 (Jun-23), 370 (Jun-24), 405 (Jun-25) and 455 (Jun-26), with year-on-year growth of +11%, -1%, +2%, +10% and +12%; Jun-26 split is 303 Meridian and 152 Powershop. Highlights: 12% customer growth including ex-Flick customers, over 245,000 customers migrated to the Kraken platform, more than 30,900 Smart Hot Water users, 70 chargers (140 DC fast charge points) added in FY26 and 1,048 households supported through the Energy Wellbeing Programme.
Left column of large blue bullet statements; right column split into a framed stacked bar chart on top and a rounded EV charging photo below.
Retailers shield households from wholesale volatility, reflecting sustained cost changes without multiple price changes a year; residential customers have been shielded from coal and gas driven wholesale increases since 2018, and rising lines costs are moderated by the energy component. Charts compare residential bulk tariff energy (MBIE) with Otahuhu spot (rolling 3-year) and ASX futures (rolling average) in real 2026 c/kWh from 2006 to 2027, and show residential tariff, bulk energy and lines component indexed to 2015 with projected ranges to 2030.
Left column of four blue paragraphs; right column stacks two framed charts (line chart on top, indexed line chart with shaded projection bands below).
Reproduction of Meridian's Climate Action Plan, 'Our journey to a resilient, net zero future': three priorities — 100% renewable generation, customer decarbonisation, and managing emissions while building capability and resilience — each mapped to key initiatives and delivery actions on a 2026–2030 timeline, including '7 in 7' (seven new large-scale renewable projects underway by 2030), growing dispatchable capacity and hydro flexibility, re-consenting hydro, EV charging, hardship support, Forever Forests and climate risk assessments; 2050 goals are 20 new grid-scale renewable projects underway and net zero business emissions.
Royal-blue full-bleed poster: large aqua headline, purpose line, three horizontal bands separated by dotted rules, initiative labels in a middle column, dark pill-shaped action bars, and a pill timeline along the bottom ending at 2050.
FY26 scorecard across five priorities: financial performance — NZ$1.05B EBITDAF, 50% increase in energy margin on FY25, NZ$810M operating cash flow, 7.1% dividend growth, 14% growth in customer sales; grow generation and firming — 5 metres more Lake Pūkaki storage, Waitaki reconsenting approved for 35 years, Manawatū Energy Park consented, Waiinu Energy Park accepted into Fast-track; cleaner cheaper energy — 12% customer growth, 175,820 customers onto Kraken, 519 charge points; operational excellence — 30 MW extra hydro capacity, 116 annual outage days removed; culture — Dow Jones Best-in-Class World Index inclusion. A mini bar chart shows EBITDAF from 2012 to 2026.
Royal-blue five-column grid: row of photos (first cell is an EBITDAF bar chart), row of white column headings, row of bulleted outcomes, separated by thin vertical rules.
Section divider over a photo of the control structure and spillway at Lake Pūkaki, South Canterbury.
Full-bleed rounded landscape photo with a white title top-left, caption and footer.
Ordinary dividend policy: pay out 80%–100% of operating free cash flow on average over time, subject to working capital and investment needs, a sustainable structure consistent with a BBB+ S&P rating, and hydrology and market risks. Ordinary dividends declared: 17.40, 17.90, 21.00, 21.00 and 22.50 cps for FY22–FY26. Table (NZ$M, FY22–FY26): operating cash flow 461/509/667/318/810; stay-in-business capex 40/46/72/80/89; operating free cash flow 421/463/595/238/721; dividend declared 448/462/543/548/595; payout ratio 107%/100%/91%/230%/83% (tax expense basis 105%/103%/97%/165%/102%).
Left: solid royal-blue panel with white policy text and bullets; right: framed bar chart on top and a reconciliation table below with the latest year in bold.
Six-chart dashboard, FY22–FY26 (NZ$): EBITDAF 709, 783, 905, 611, 1,051 M; net profit after tax (continuing operations) 451, 95, 429, -452, 130 M; capital expenditure 175, 346, 349, 193, 261 M (FY26: 172 growth, 89 stay in business); operating cash flows 461, 509, 667, 318, 810 M; underlying NPAT 233, 315, 359, 56, 308 M; net debt 0.8, 1.2, 1.3, 1.5, 1.7 B. Footnotes define EBITDAF, underlying NPAT and net debt as non-GAAP measures.
2×3 grid of rounded framed bar charts with titles, units and value labels, footnotes beneath each row.
The hydro risk-management portfolio has been strengthened: multiple NZAS demand response options of 25, 50, 100 or 185 MW in total; the Huntly Strategic Energy Reserve gives Meridian up to a 75 MW call option; and additional Lake Pūkaki storage makes up to five more metres available to reduce dry-year risk. A stacked bar chart of the risk management book (annual GWh, FY24–FY28) grows from roughly 600 GWh to around 1,700 GWh, combining Pūkaki storage, Huntly reserve, NZAS DR options, retail DR, HFO and Contact and Nova swaptions.
Left column of four blue statements; right a framed multi-colour stacked bar chart with legend and 'option 2/3/4 incremental' labels.
Face value of debt NZ$1,916M at 30 June 2026; FY26 net debt NZ$1,665M, up 11% on FY25; net debt to EBITDAF 1.6x (FY25: 2.5x). Meridian replaced bilateral bank facilities with a committed NZ$1B syndicated facility (undrawn at 30 June 2026), issued NZ$350M of 6.5-year fixed-rate green bonds in September 2025 and A$400M green Australian Medium Term Notes in March 2026; all borrowings other than leases are green debt. Charts show the debt maturity profile FY27–FY34 split by NZD, USPP and AUD, and liquidity (drawn debt and undrawn facilities) with net debt/EBITDAF of 1.2, 1.6, 1.4, 2.5 and 1.6x for FY22–FY26.
Left column of blue bullet statements; right column two stacked framed charts — maturity bar chart and combo stacked bar plus line chart with secondary axis.
S&P BBB+ (stable) and MSCI ESG AAA ratings with an MSCI quote on water-stress risk. Five-year table FY22–FY26: free cash flow per share 16.3/17.9/23.0/9.1/27.2 cps; FCF payout ratio 106.5/99.8/91.2/230.3/82.5%; net dividend yield 3.7/3.2/3.3/3.6/3.9%; D&A NZ$293/294/334/447/535M; underlying EPS 9.0/12.2/13.9/2.1/11.6 cps; underlying PE 52/46/45/276/50x; EV/EBITDAF 18.2/20.0/19.4/27.7/16.3x; EBITDAF interest cover 9.1/11.3/10.6/6.6/11.1x; average ROE 4.3/5.5/5.0/0.7/3.3%; debt/(debt+equity) 18.6/17.4/14.3/15.0/17.0%.
Left: short blue text block with ratings and quote; right: large bordered table with royal-blue header row of years and grouped metric rows.
Meridian launched its Green Finance Programme in 2020 for existing and future green debt; its Green Finance Framework was updated in February 2026 and externally reviewed by DNV as aligned with the ICMA Green Bond Principles, APLMA Green Loan Principles and Climate Bonds Standard, and DNV verified alignment of eligibility criteria with the Australian Sustainable Finance Taxonomy's climate mitigation screening criteria (excluding DNSH and minimum safeguards).
Left two-thirds of blue paragraph text with footnote; right a portrait cover image of the Green Finance Framework (February 2026) with a wind turbine at dusk and a URL beneath.
The Renewable Energy and Energy Storage Pool currently consists of hydropower and energy storage assets meeting Australian Sustainable Finance Taxonomy criteria, and may later include solar and wind. Eligibility table covers renewable energy (wind, solar, hydropower meeting power density, run-of-river or <100 gCO2e/kWh criteria) and energy efficiency/storage (mechanical, thermal, pumped hydro and battery storage) mapped to SDG 7 and 13. Pool values: hydropower assets NZ$12.0b, energy storage assets NZ$0.2b, Green Debt Ratio 5.9x.
Intro paragraph across the top; three columns below — a blue-bordered eligibility criteria table with SDG icons, two stacked photos (hydro station, battery storage site), and a royal-blue value table with an italic note.
Standard disclaimer: summary information without warranty, forward-looking statements, not financial advice or an offer of securities, non-GAAP measures (Energy Margin, EBITDAF, Underlying NPAT, gearing), reference to the integrated report for the year ended 30 June 2026, and confirmation that all currency amounts are in New Zealand dollars unless stated otherwise.
Text-only white slide with blue title and six short paragraphs, standard footer.
Common questions about this slide and the underlying presentation content.
It is Meridian Energy's 26-page "2026 Investor Presentation" (the cover is dated November 2026), lodged with the ASX on 26 October 2026. It covers New Zealand's electricity market, Meridian's renewable assets and strategy, its development pipeline, FY26 outcomes, five years of financial metrics, funding and its Green Finance Programme.
Meridian is a New Zealand company dual-listed on the NZX and ASX, so amounts are in New Zealand dollars (NZ$) unless stated otherwise — the disclaimer says so explicitly. The one Australian-dollar figure is the A$400M green Australian Medium Term Notes issued in March 2026.
Meridian's financial year ends on 30 June, so FY26 (also written 2025/26) covers July 2025 to June 2026 — the same July–June year used by most Australian listed companies.
EBITDAF of NZ$1,051M (up from NZ$611M in FY25), operating cash flow of NZ$810M, underlying NPAT of NZ$308M, net profit after tax from continuing operations of NZ$130M, and an ordinary dividend of 22.5 cents per share (7.1% growth). Net debt was NZ$1,665M with net debt/EBITDAF of 1.6x.
Yes. Alongside the original PDF there is an editable PPTX that was converted from the PDF, so you can reuse slide layouts, tables and text. Because it is a conversion rather than Meridian's original source file, some charts may come through as images and fonts or spacing may need minor adjustment.
The New Zealand electricity system infographic (page 6), the asset map with generation table (page 9), the renewable pipeline stacked bar chart (page 12), the 2025/26 outcomes scorecard (page 17), the six-chart financial dashboard (page 20) and the funding capacity charts (page 22) are strong templates for energy and infrastructure companies.
The deck shows 6,384 GWh of wind and solar generation not yet constructed — 2,985 GWh wind and 3,399 GWh solar — spanning projects in construction, consented, in consent and consents to be lodged in FY27, phased in cumulatively from FY27 to FY35.
Meridian publishes its reports, including the integrated report for the year ended 30 June 2026 and its Green Finance Programme documents, on its investor centre at meridianenergy.co.nz/about-us/investors. The presentation itself is available through the ASX announcements platform under Meridian Energy.
Official investor centre referenced in the deck's disclaimer; hosts the FY26 integrated report and presentations.

Create Your Own Slides
Turn your ideas into professional presentations in seconds with 2slides AI.
Reference professional designs, choose your style, and generate slides with perfect text rendering. Powered by Nano Banana—start creating your presentation now.
Your AI Agent for slides. Save time, shine faster with intelligent presentation creation.


© 2026 2slides. All rights reserved.