
Part of Investor presentation examples
Alkane Resources Q1 FY2027 Earnings Presentation: the 25-slide earnings conference call deck for the quarter ended 30 September 2026, presented on 23 October 2026 by Managing Director & CEO Nic Earner and CFO James Carter and lodged with the ASX. Alkane (ASX: ALK, TSX: ALK, OTCQX: ALKRY) is a gold and antimony producer with three operating mines: Tomingley (NSW, Australia), Costerfield (Victoria, Australia) and Björkdal (Sweden). The deck reports Q1 FY2027 production of 40.7 koz gold equivalent (AuEq), A$102 million (Australian dollars; US$71 million) of operating cash flow, A$459 million (US$321 million) of cash, bullion and investments, and a maiden fully franked dividend of 2 cents per share. It then covers each mine's results against unchanged FY2027 guidance, group Mineral Resources and Ore Reserves at 30 June 2026, exploration at all three mines plus Boda-Kaiser and Nagambie, the financial highlights table, a cash flow waterfall, and an appendix of reserves and resources statements.
Uses this deck’s cover as a style reference for slides made from your own content. Or pick any page below to use its layout as the reference.
Quick Navigation
Tags
Share the slides
Alkane Resources Q1 FY2027 Earnings Presentation: the 25-slide earnings conference call deck for the quarter ended 30 September 2026, presented on 23 October 2026 by Managing Director & CEO Nic Earner and CFO James Carter and lodged with the ASX. Alkane (ASX: ALK, TSX: ALK, OTCQX: ALKRY) is a gold and antimony producer with three operating mines: Tomingley (NSW, Australia), Costerfield (Victoria, Australia) and Björkdal (Sweden). The deck reports Q1 FY2027 production of 40.7 koz gold equivalent (AuEq), A$102 million (Australian dollars; US$71 million) of operating cash flow, A$459 million (US$321 million) of cash, bullion and investments, and a maiden fully franked dividend of 2 cents per share. It then covers each mine's results against unchanged FY2027 guidance, group Mineral Resources and Ore Reserves at 30 June 2026, exploration at all three mines plus Boda-Kaiser and Nagambie, the financial highlights table, a cash flow waterfall, and an appendix of reserves and resources statements.
Detailed view of each slide page, including layout, key content and visual elements.
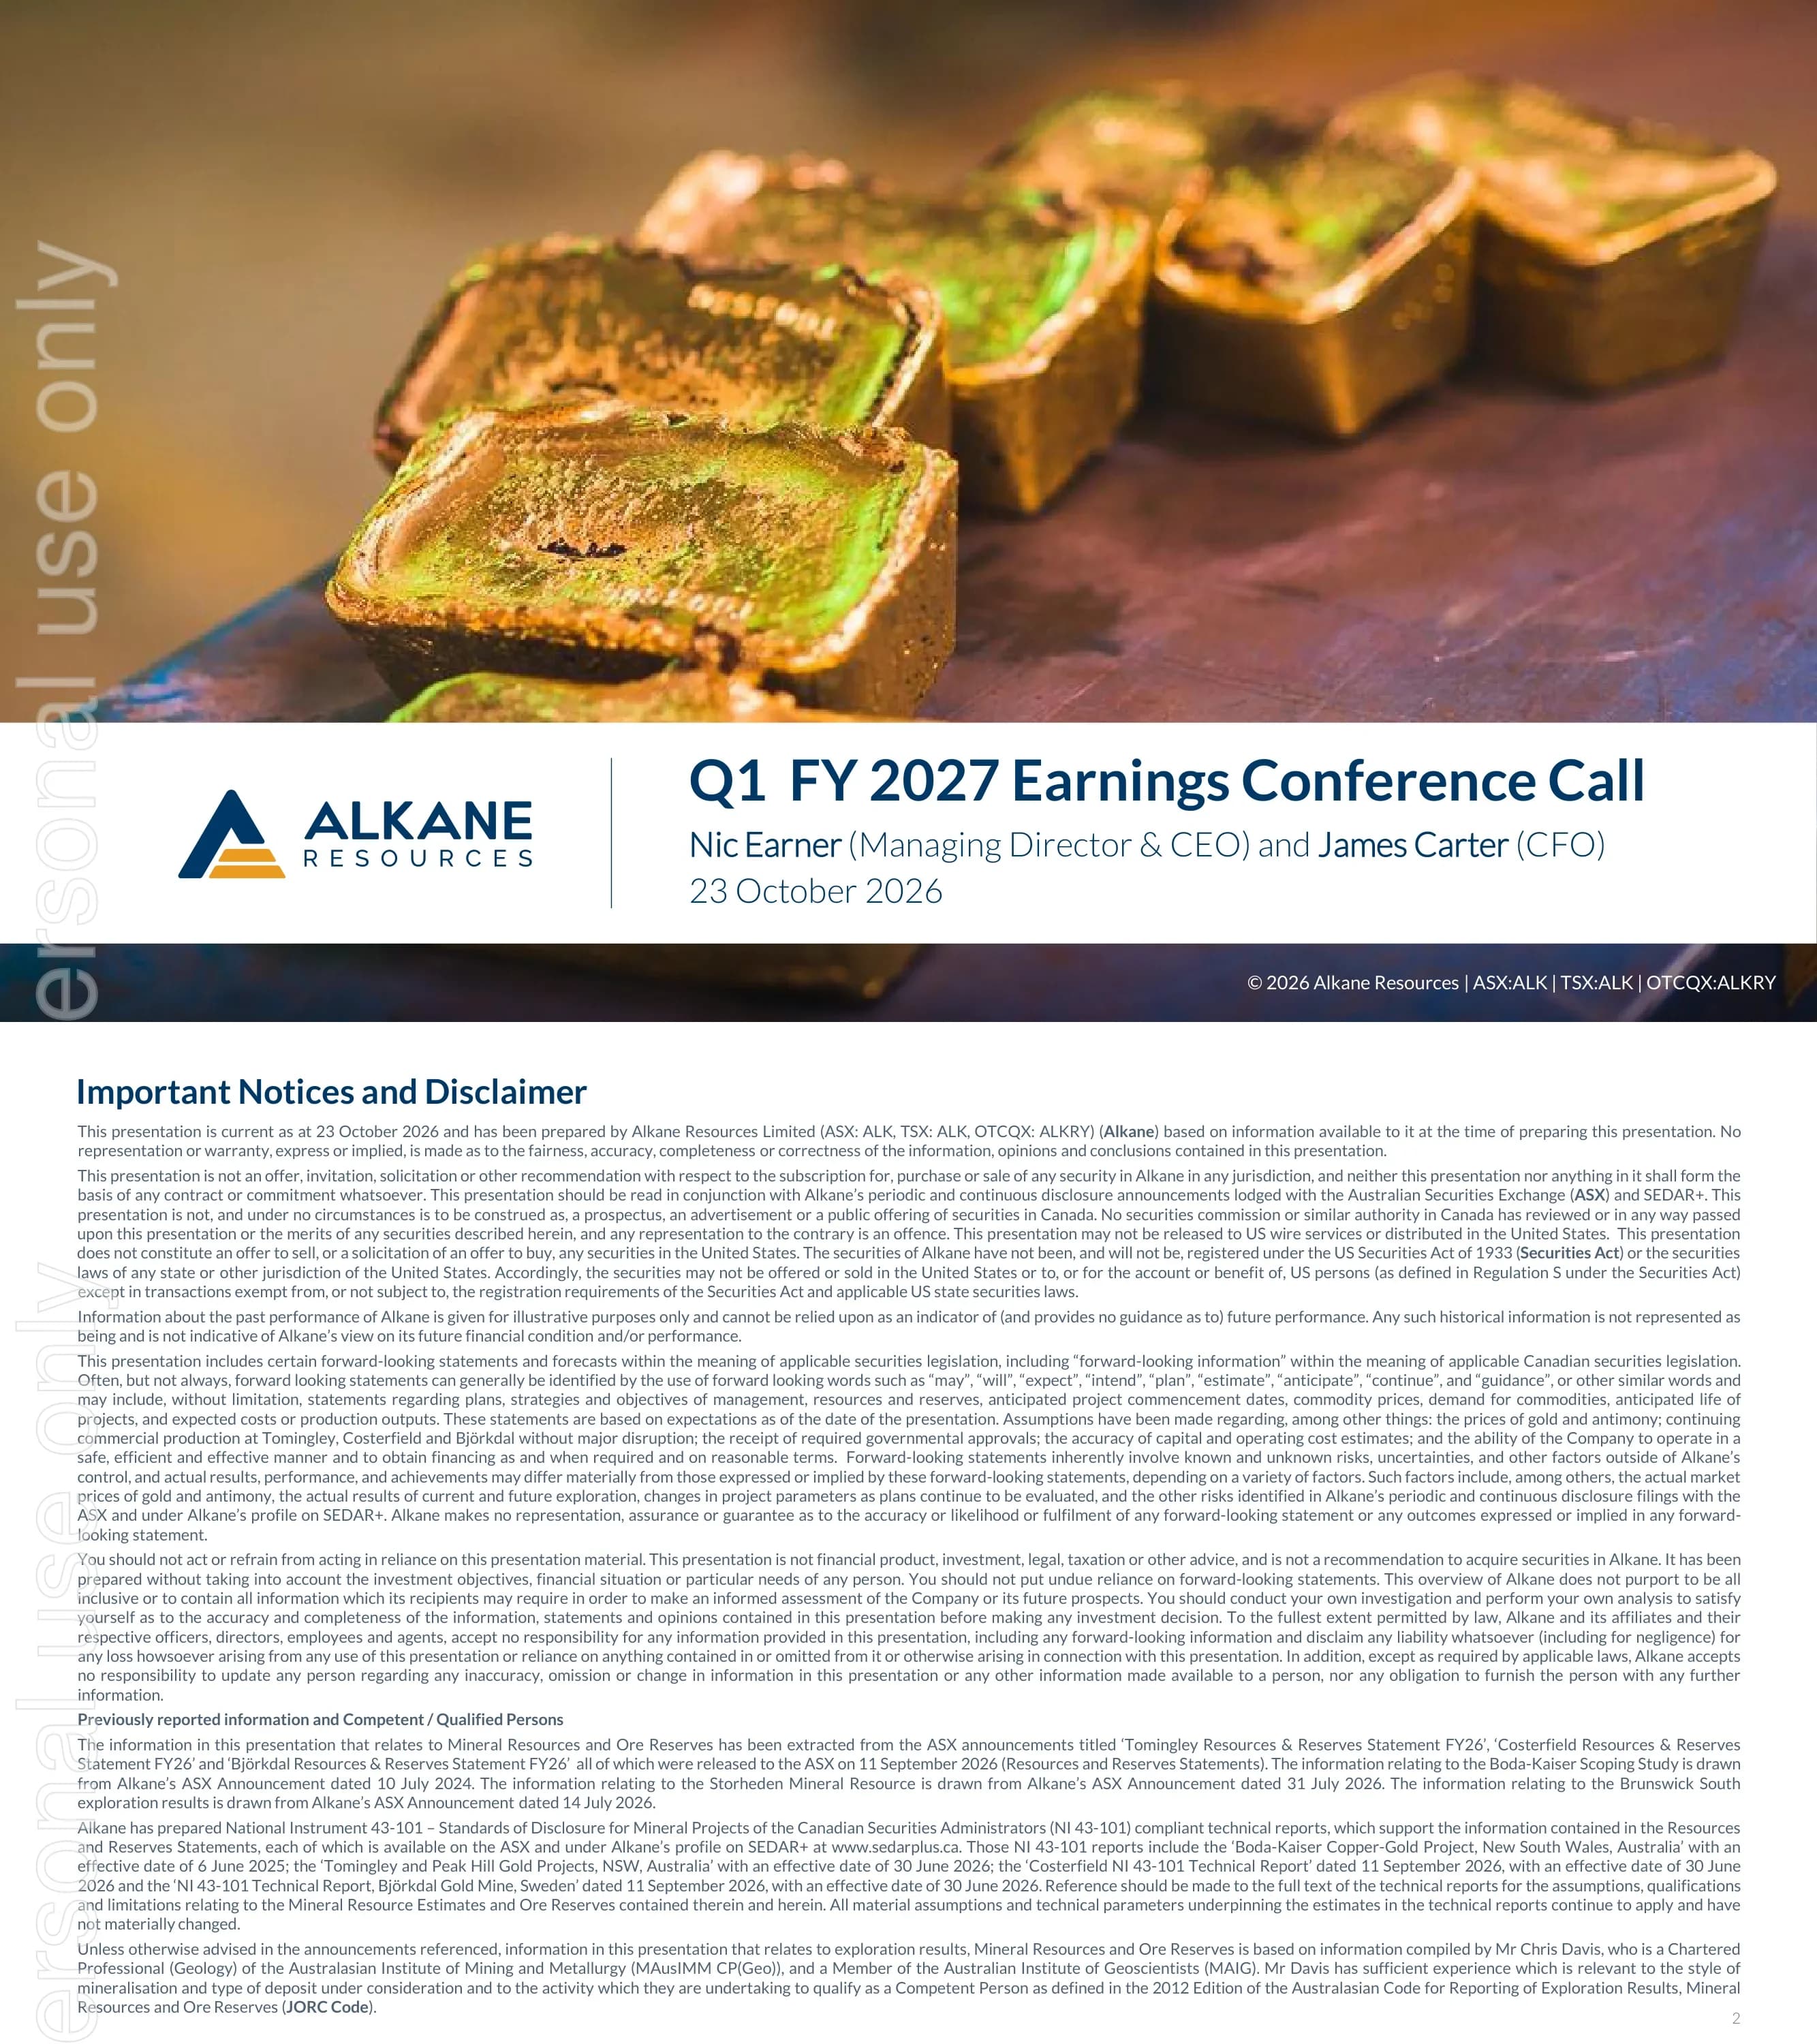
Cover slide: Alkane Resources Q1 FY 2027 Earnings Conference Call, presented by Nic Earner (Managing Director & CEO) and James Carter (CFO) on 23 October 2026; footer lists ASX:ALK, TSX:ALK and OTCQX:ALKRY.
Full-bleed photograph of gold bars with a white band across the lower third holding the logo on the left and the title, presenters and date on the right.
Legal disclaimer: the presentation is current as at 23 October 2026, is not an offer of securities, contains forward-looking statements, and draws Mineral Resource and Ore Reserve information from ASX announcements of 11 September 2026; it lists the NI 43-101 technical reports and names Chris Davis as Competent Person under the JORC Code.
Single dense full-width text block of justified paragraphs under a navy heading.
Continues the notices: NI 43-101 qualified person, non-IFRS measures such as all-in sustaining cost (AISC), the gold-equivalent (AuEq) formula using LBMA gold and Shanghai Metal Market antimony prices, Mineral Resource caveats, the Boda-Kaiser Scoping Study, Canadian continuous disclosure, and a note that all dollar figures are in Australian dollars (A$) unless stated.
Full-width text with bold sub-headings separating each notice topic.
Introduces the two speakers: Nic Earner, Managing Director and CEO, and Jim Carter, Chief Financial Officer.
Top half is a photo of a haul truck on a mine site with the word Speakers overlaid; bottom half has two circular headshots, each with name and title.
Four headline tiles: Q1 FY2027 production of 40.7 koz AuEq; maiden fully franked dividend of 2 cents per share paid; Q1 cash flows from operations of A$102 million (US$71 million); cash, bullion and investments of A$459 million (US$321 million). Footnotes give the AuEq formula with September 2026 quarter prices of A$6,035/oz gold and A$19,982/t antimony, and the 0.7000 A$:US$ rate used throughout.
2x2 grid of navy-tinted photo tiles, each with a label and a large figure, with footnotes underneath.
Group operating table for Q1 2027 (ended 30 September 2026): 654,577 t ore mined at 2.07 g/t gold and 1.12% antimony; 740,776 t processed at 1.83 g/t gold and 1.11% antimony; recoveries of 89.58% gold and 89.11% antimony; 40,740 oz gold-equivalent production. FY2027 guidance is unchanged.
Two-column table on the left with navy header; underground drilling photo on the right with footnotes.
Tomingley Q1 2027: 343,988 t processed at 2.16 g/t gold, 90.32% recovery, 21,506 oz gold, AISC A$2,340/oz (US$1,638/oz), operating cash flow A$52 million. FY2027 guidance: 78–84 koz gold at AISC of A$2,600–2,900/oz.
Data table top-left, guidance bullets top-right, aerial photo of the Newell Highway works below the table.
Björkdal Q1 2027: 355,260 t processed at 0.98 g/t gold, 85.54% recovery, 10,482 oz gold, AISC A$3,012/oz (US$2,108/oz), operating cash flow A$21 million. FY2027 guidance: 41–45 koz gold at AISC of A$3,300–3,700/oz.
Data table on the left, guidance bullets and an aerial photo of the open pit on the right.
Costerfield Q1 2027: 41,528 t processed at 6.47 g/t gold and 1.11% antimony; recoveries 92.88% gold and 89.11% antimony; production of 7,835 oz gold, 396 t antimony and 8,752 oz AuEq; AISC A$3,194/oz (US$2,236/oz); operating cash flow A$29 million. FY2027 guidance: 44–48 koz AuEq at AISC of A$2,700–3,000/oz.
Taller data table on the left; guidance bullets and an aerial site photo on the right.
Group tables: Measured & Indicated Resources total 578,796 kt at 0.46 g/t gold for 8,641 koz gold, 1.01 Mt copper and 42.0 kt antimony (Boda-Kaiser alone 537,000 kt, 5,573 koz); Inferred Resources total 275,614 kt for 3,757 koz gold; Ore Reserves total 25,488 kt at 1.7 g/t for 1,374 koz gold and 15.0 kt antimony (Björkdal 563 koz, Tomingley 641 koz, Costerfield 170 koz).
Three stacked tables (M&I Resources, Inferred Resources, Ore Reserves), each with a dark navy TOTAL row.
Extension testing continues at (1) Roswell–Wyoming, (2) Roswell North and (3) Macleans; (4) El Paso is a regional target; (5) at the historic Peak Hill mine, drilling shows substantial upside beneath the existing resource, with a further 6,600 metres of follow-up drilling planned.
Numbered target list on the left; geological map with matching numbered callouts and a lithology legend on the right.
North Zone infill and extension drilling included 31.5 g/t over 0.85 m; Eastern Zone results included 86.1 g/t over 1.25 m and 81.3 g/t over 4.4 m; Storheden resource depth-extension drilling was paused in Q1 and is set to recommence in Q2.
Numbered results list on the left; geological map with labelled zones (North Zone, Eastern Zone, Storheden Resource, Lake Zone Skarn, Norrberget) on the right.
Six targets: True Blue high-grade infill increased confidence in the veining system; Kendall extension drilling added resources; Brunswick South infill confirmed continuity between shallow historic and deeper mineralisation; a new high-grade domain was discovered at Cuffley; drilling recommenced at Northern Dykes and Browns.
Numbered narrative list on the left; Costerfield geological map with numbered targets, corridor callouts and stratigraphic legend on the right.
Northern Molong Porphyry Project (which encompasses Boda-Kaiser): a 178 km² exploration licence was acquired, doubling the project area, with transfer expected next quarter. Nagambie Project: initial drilling confirmed the high-grade epizonal gold-antimony system, including 3.3 g/t Au and 0.7% Sb over 10.6 m in the C3 zone and 1.2 g/t Au and 2.5% Sb over 9.7 m in the C2W zone.
Two bulleted sections on the left; Nagambie West Pit plan section (October 2026) with labelled drill intercepts on the right.
Q1 2027 in A$ unless noted: revenue A$205.9 million; realised gold price A$5,128/oz (US$3,590); realised antimony price A$23,842/t (US$16,689); AISC per oz AuEq A$2,805 (US$1,964); sustaining capex A$12.6 million; growth capex A$37.3 million; exploration expenses A$9.1 million.
Financial table on the left; close-up gold bar photo on the right.
Cash, bullion and liquid investments of A$459 million; available liquidity of A$569 million including an undrawn A$110 million revolving credit facility; the three mines generated A$102 million of operating cash flow. September 2026 YTD waterfall (A$M): opening 432, Tomingley +52, Costerfield +29, Björkdal +21, sustaining −13, growth −46, tax −13, rehab bonds +8, corporate & other −21, operating cash 449, dividend −24, closing 425.
Three bullet statements across the top; full-width waterfall chart below.
Q&A session slide featuring Nic Earner (Managing Director and CEO) and Jim Carter (Chief Financial Officer).
Same layout as the speakers slide: haul truck banner with large Q&A text, two circular headshots below.
Listings ASX: ALK, TSX: ALK and OTCQX: ALKRY; investor contact Natalie Chapman, Corporate Communications Manager, with phone, info@alkres.com, LinkedIn and X handles, and alkres.com.
Drill core tray photo at top and bottom with a white central band holding tickers on the left and contact details on the right.
Section divider introducing the appendix of reserves and resources statements.
Full-bleed photo of a geologist's hammer in a holster with a white band holding the Appendix title and an orange sub-label.
Tomingley Mineral Resources at 30 June 2026 by deposit (San Antonio, stockpiles, Wyoming One, Caloma Two, McLeans, Wyoming Three, Caloma One, Roswell): total Measured & Indicated 17,302 kt at 2.1 g/t for 1,184 koz gold; Inferred 3,539 kt at 1.7 g/t for 196 koz. Roswell is the largest deposit at 444 koz M&I.
Wide multi-level table (Measured, Indicated, Total M&I, Inferred) with cut-off sub-headers; notes column on the right.
Tomingley Ore Reserves at 30 June 2026: 11,401 kt at 1.7 g/t for 641 koz gold (open pit 229 koz, underground 412 koz, Roswell 333 koz). Peak Hill Gold Project Inferred Resource (Proprietary underground, 2 g/t cut-off): 1.02 Mt at 3.29 g/t for 108 koz gold and 0.15% copper. Notes state economic feasibility at a gold price of A$4,000/oz.
Ore Reserves table on top, Peak Hill resource table below, notes on the right.
Costerfield Mineral Resources at 30 June 2026: Measured + Indicated 1,993 kt at 6.0 g/t gold and 2.1% antimony for 387 koz gold and 42.0 kt antimony; Inferred 969 kt for 111 koz and 12.9 kt. Ore Reserves: Proved 270 kt for 58 koz, Probable 690 kt for 112 koz, total 960 kt at 5.5 g/t gold and 1.6% antimony for 170 koz gold and 15.0 kt antimony.
Resources table above an Ore Reserves table; long notes column on the right describing cut-offs and AuEq factors.
Björkdal Mineral Resources at 30 June 2026: Measured 1,278 kt at 2.48 g/t (102 koz); total Measured + Indicated including Norrberget 22,474 kt at 2.07 g/t for 1,497 koz; total Inferred 12,096 kt at 1.57 g/t for 611 koz. Notes cite a US$3,100/oz gold price and 10.00 SEK/US$.
Single table split by Measured, Indicated and Inferred bands with area rows (open pit, underground, Storheden, stockpile, Norrberget); notes on the right.
Björkdal Ore Reserves at 30 June 2026: Proven underground 1,155 kt at 1.63 g/t (61 koz; the Total Proven row prints the tonnage as '1.155'); Probable 11,966 kt at 1.30 g/t for 502 koz (underground 287 koz, open pit 184 koz, Norrberget 14 koz, stockpiles 17 koz); total Proven + Probable 13,121 kt at 1.33 g/t for 563 koz. Notes cite a US$2,600/oz long-term gold price.
Ore Reserves table on the left half; notes on the right; lower half of slide left blank.
Boda-Kaiser copper-gold porphyry resources (from the FY25 NSW statement): open-pittable 422 Mt and underground 374 Mt, for a total of 796 Mt at 0.58 g/t AuEq (0.33 g/t gold, 0.18% copper) containing 14.7 Moz AuEq, 8.28 Moz gold and 1.46 Mt copper; Indicated 537 Mt and Inferred 258 Mt.
Wide full-width table grouped into Indicated, Inferred, Total and Metal columns with open-pit and underground sections; AuEq formula in the footnote.
Common questions about this slide and the underlying presentation content.
It is the 25-slide deck from Alkane's earnings conference call on 23 October 2026, covering the quarter ended 30 September 2026. It includes headline results, consolidated and per-mine operating tables for Tomingley, Björkdal and Costerfield, group Mineral Resources and Ore Reserves, exploration updates, financial highlights, a cash flow waterfall and an appendix of reserves and resources statements.
Alkane's financial year runs from July to June, so FY2027 covers July 2026 to June 2027. Q1 FY2027 is the quarter from July to September 2026, ending 30 September 2026.
The deck reports 40.7 koz gold-equivalent production, A$102 million (US$71 million) of operating cash flow, A$459 million (US$321 million) of cash, bullion and investments, revenue of A$205.9 million, group AISC of A$2,805 per oz AuEq, and a maiden fully franked dividend of 2 cents per share. FY2027 guidance was unchanged.
Figures are in Australian dollars (A$) unless stated otherwise. Key metrics such as AISC, realised prices and cash are also shown in US dollars, converted at an A$:US$ rate of 0.7000.
Alkane Resources lodged the presentation with the Australian Securities Exchange (ASX) under ticker ALK. The company is also listed on the TSX (ALK) and quoted on OTCQX (ALKRY), and files Canadian disclosures on SEDAR+.
Gold and antimony production are each multiplied by their average market prices for the period, the values are added (antimony at 70% payability), and the total is divided by the average gold price. For the September 2026 quarter the deck uses A$6,035/oz gold and A$19,982/t antimony.
Yes. The gallery page offers the original PDF and a PPTX version converted from it. The PPTX is machine-converted, so tables, maps and photos may need some layout clean-up before you reuse them as a template for a mining company quarterly results presentation.
Yes. Its structure follows a common format for listed miners: KPI tiles, one slide per mine with guidance beside actuals, mapped exploration targets, a financial table, a cash flow waterfall and reserves tables in an appendix. That makes it a practical reference for gold, copper or battery-metal producers preparing quarterly calls.

Create Your Own Slides
Turn your ideas into professional presentations in seconds with 2slides AI.
Reference professional designs, choose your style, and generate slides with perfect text rendering. Powered by Nano Banana—start creating your presentation now.
Your AI Agent for slides. Save time, shine faster with intelligent presentation creation.


© 2026 2slides. All rights reserved.