
Part of Investor presentation examples
Regis Resources Investor Presentation October 2026 – "Regis Resources – The Golden Opportunity", the 34-slide deck Regis Resources Ltd (ASX: RRL), an unhedged Western Australian gold producer, presented at the Citi Australia / New Zealand Investment Conference and lodged with the ASX on 19 October 2026. Amounts are in Australian dollars (A$) unless stated. The deck covers the Duketon (100%) and Tropicana (30% JV) operations, Q1 FY27 results (83.0koz at AISC of A$3,617/oz, cash and bullion of A$1.28B), FY27 guidance of 360–400koz, sector-leading FY26 free cash flow per share of A$1.06, a 6.5% fully franked dividend yield, underground Reserve growth, the Beamish South discovery, and the 1.9Moz McPhillamys project in NSW following the Federal Court ruling on the Section 10 declaration.
Uses this deck’s cover as a style reference for slides made from your own content. Or pick any page below to use its layout as the reference.
Quick Navigation
Tags
Share the slides
Regis Resources Investor Presentation October 2026 – "Regis Resources – The Golden Opportunity", the 34-slide deck Regis Resources Ltd (ASX: RRL), an unhedged Western Australian gold producer, presented at the Citi Australia / New Zealand Investment Conference and lodged with the ASX on 19 October 2026. Amounts are in Australian dollars (A$) unless stated. The deck covers the Duketon (100%) and Tropicana (30% JV) operations, Q1 FY27 results (83.0koz at AISC of A$3,617/oz, cash and bullion of A$1.28B), FY27 guidance of 360–400koz, sector-leading FY26 free cash flow per share of A$1.06, a 6.5% fully franked dividend yield, underground Reserve growth, the Beamish South discovery, and the 1.9Moz McPhillamys project in NSW following the Federal Court ruling on the Section 10 declaration.
Detailed view of each slide page, including layout, key content and visual elements.
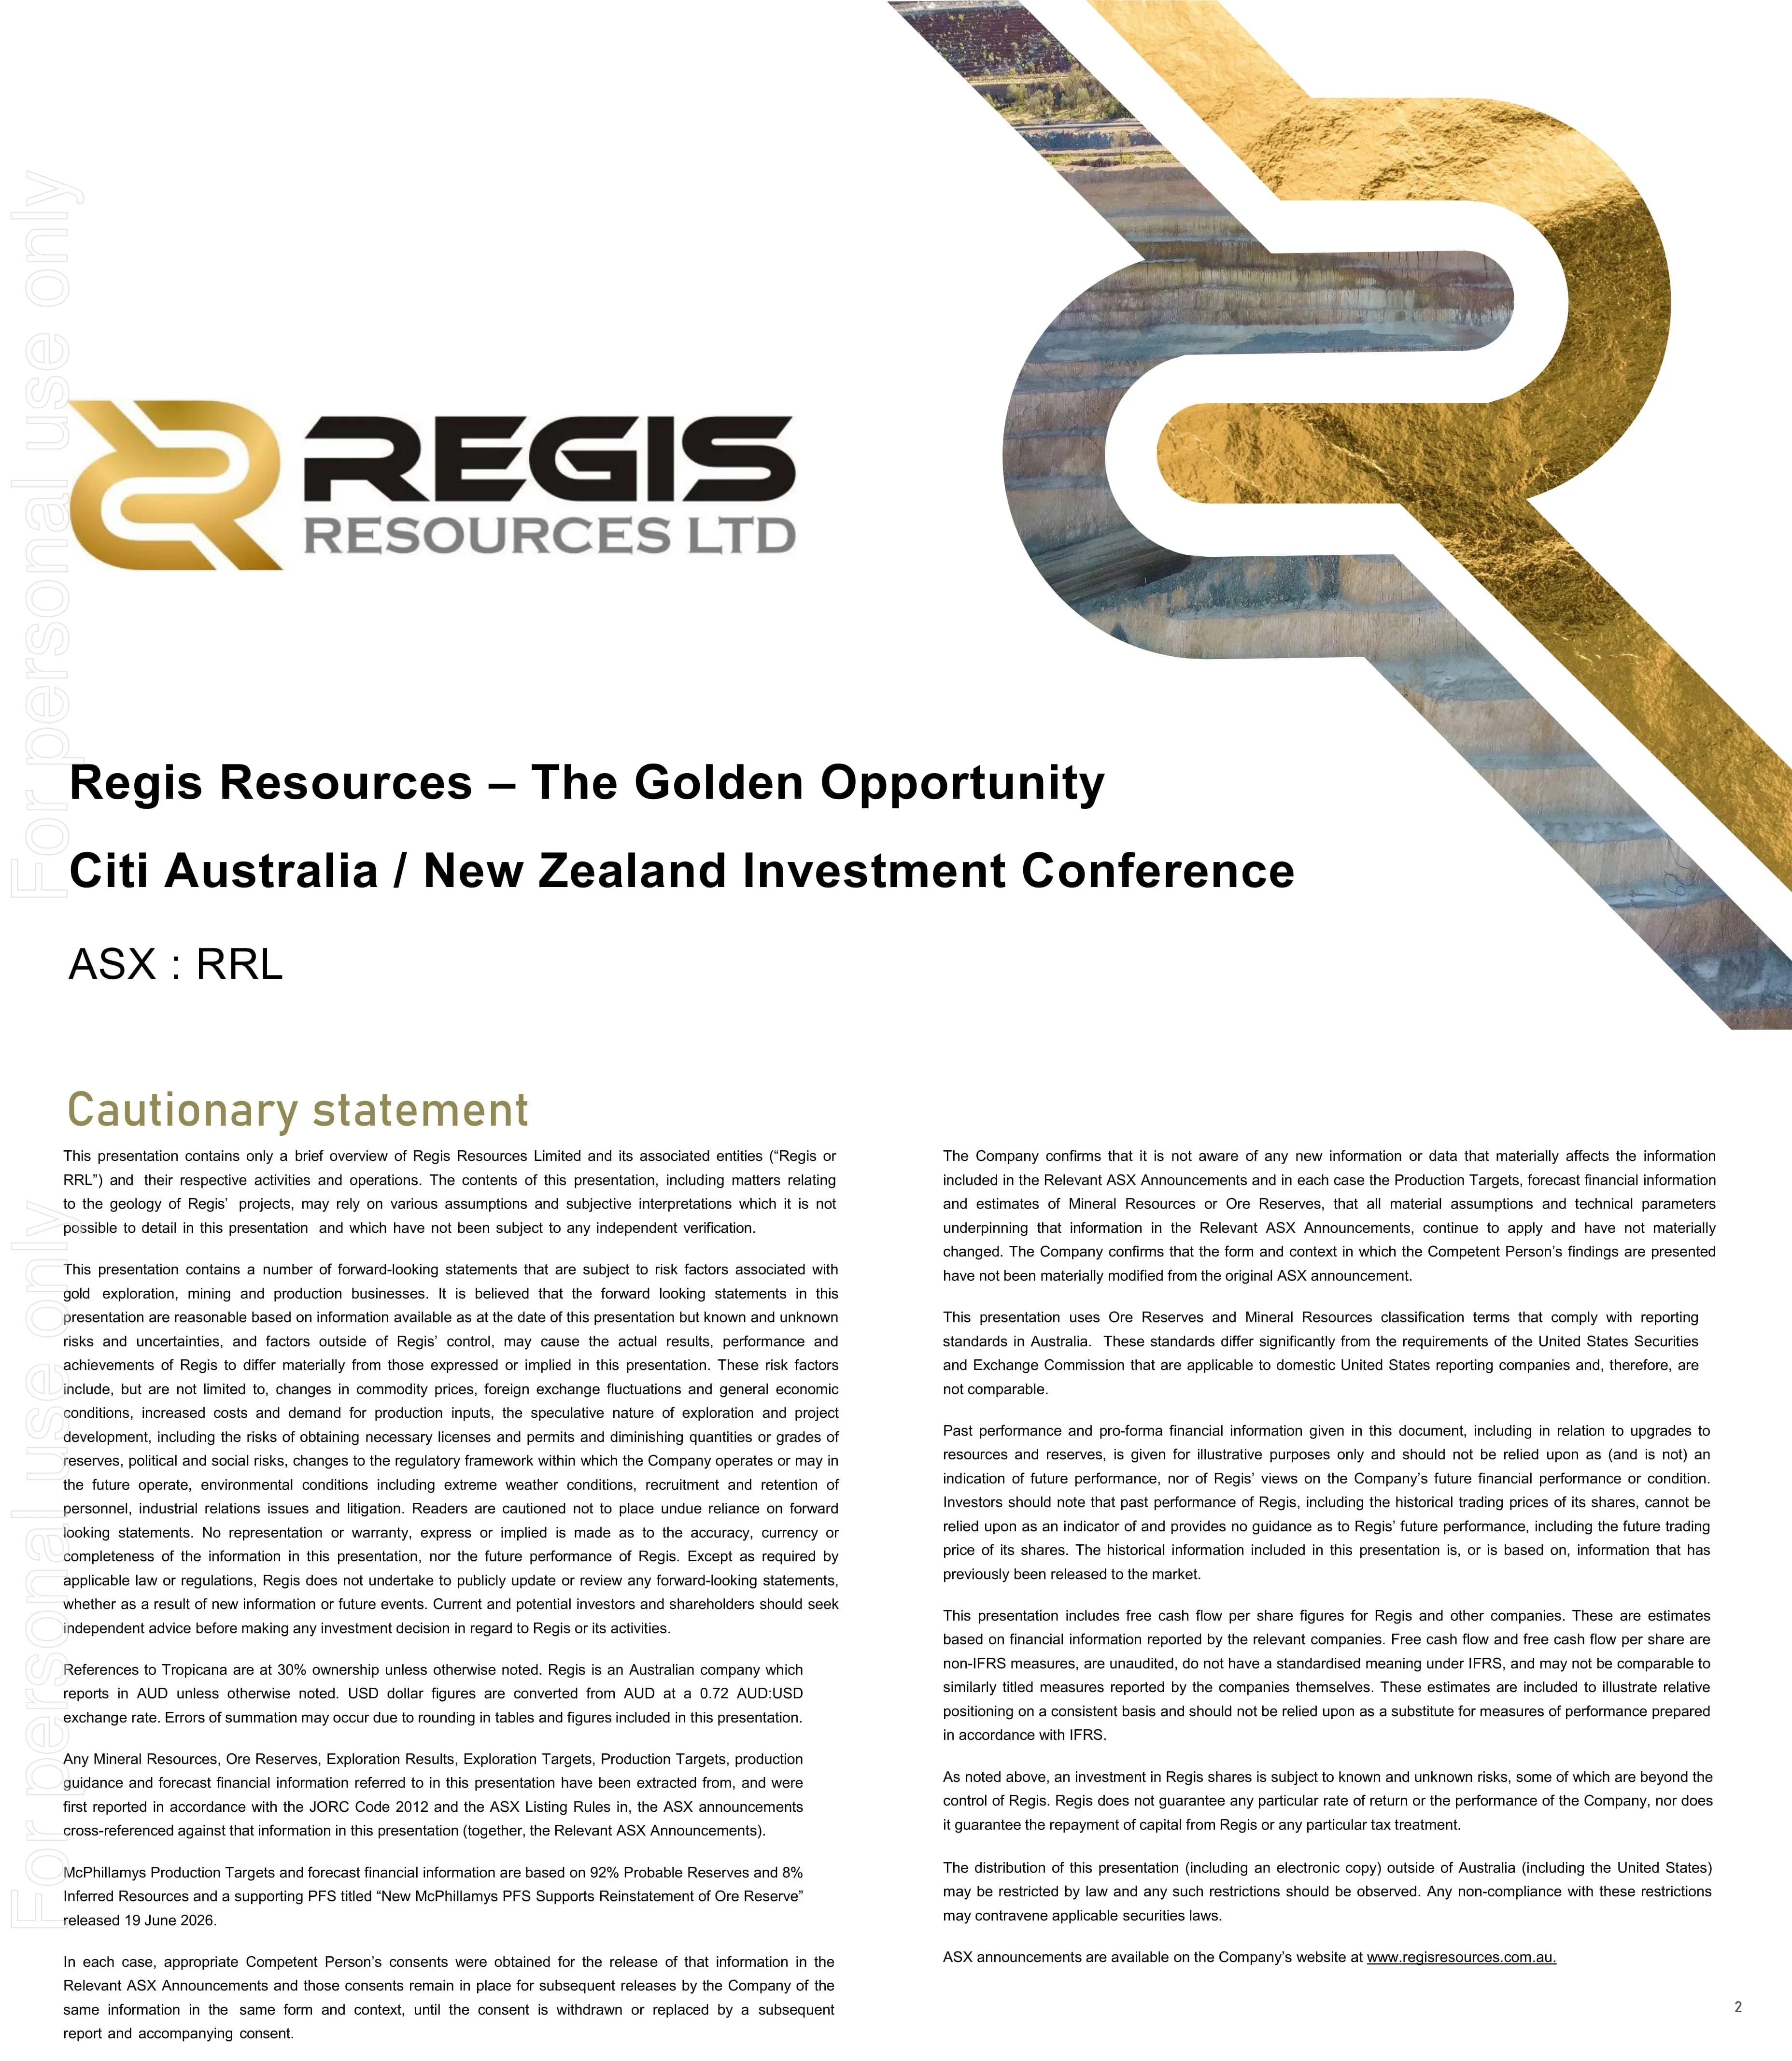
Cover slide naming the presentation "Regis Resources – The Golden Opportunity" for the Citi Australia / New Zealand Investment Conference, with the ticker ASX : RRL.
Regis Resources Ltd logo on the left over white space; a large stylised gold-leaf and open-pit-photo "R" brand mark sweeps diagonally across the right; title, conference name and ticker stacked bottom-left.
Legal disclaimer covering forward-looking statements and gold-sector risk factors; notes Tropicana figures are at Regis' 30% share, figures are in AUD with USD conversions at 0.72 AUD:USD, Resources and Reserves follow the JORC Code 2012, McPhillamys targets rest on 92% Probable Reserves and 8% Inferred Resources from the 19 June 2026 PFS, and FCF per share figures are non-IFRS estimates.
Two dense justified text columns under a gold heading; page number bottom-right.
Asset overview on a map of Australia: Duketon (producing, 100%) – 10Mtpa installed capacity, FY27 guidance 240–270koz, Resources 4.0Moz, Reserves 1.4Moz; Tropicana (producing, 30%) – 9Mtpa capacity (100% basis), FY27 guidance 120–130koz, Resources 1.6Moz, Reserves 0.6Moz; McPhillamys (growth, 100%, NSW) – Resources 2.3Moz, Reserves 1.9Moz at 1.1g/t, FID targeted H1 2028. Group Resources 8.3Moz and Group Reserves 3.9Moz.
Central map of Australia with WA and NSW highlighted in yellow; three asset callouts (Duketon top-left, Tropicana bottom-left, McPhillamys top-right) joined by dotted leader lines; group totals in large type bottom-right; footnotes along the bottom.
Section divider introducing the operating model section with the subtitle "Delivering Value Today".
Large olive-gold title and subtitle on the left over a faded watermark of the Regis "R" brand mark.
"Sustaining our assets, Harvesting cash flow, Investing for the future": a three-step cycle around Duketon's established, paid-for infrastructure – (1) low-cost ounce replacement at ~A$76/oz Duketon exploration and Resource definition cost (FY23–26), (2) generate strong free cash flows, (3) reinvest in exploration and mine development. Cash flow funds shareholder returns: +$300M declared dividends in the last 18 months and a 6.5% RRL dividend yield (grossed-up FY26 dividends incl. 15cps franking credits over a $7.72 share price on 11 September 2026).
Geological map of the Duketon belt (Moolart Well, Rosemont and Garden Well mills, satellite pits) on the left; on the right a three-segment donut cycle diagram labelled 1–3 with text boxes, a downward arrow to "Shareholder returns / Fully franked dividends" flanked by two large KPI figures.
Quarter to 30 September 2026: LTIFR 0.0 per million hours; cash and bullion up $93M QoQ to $1.28B, including the $51M Vault break fee and after $53M tax; post quarter paid the fully franked final FY26 dividend of 20c per share ($152M); group production 83.0koz at AISC of $3,617/oz (Duketon 56.1koz at $3,657/oz, Tropicana 27.0koz at $3,423/oz), with $114/oz non-cash stockpile charges and Q1 AISC inflated by second-half production weighting and weather; gold sales 74.5koz at $6,088/oz; post quarter the Federal Court ruled the McPhillamys Section 10 declaration legally invalid, while Regis progresses the alternative IWL (Integrated Waste Landform) option.
Single-column bullet list with bold key figures and indented sub-bullets for each operation; footnotes at bottom.
"Highest FCF per share of any dividend paying ASX gold producer (FY26)": FY26 free cash flow per fully diluted share – Greatland A$1.12, Regis A$1.06, Evolution Mining A$0.69, Westgold A$0.57, Genesis A$0.51, Vault A$0.50, Capricorn A$0.37, Northern Star A$0.33, Ramelius A$0.12. FCF defined as operating cash flow less capital expenditure; share counts as at 17 September 2026; FY26 = 1 July 2025 to 30 June 2026.
Horizontal bar chart ranked high to low with peer logos on the y-axis; Regis bar in gold inside a dashed highlight box, peers in grey; methodology footnote at bottom.
Dividend timeline: 2H FY25 5cps ($38M) marked the resumption of dividends; FY26 total 35cps ($265M) for a 6.5% yield; $850M total fully franked dividends declared since 2013, over $300M in the last 18 months. A FY26 dividend yield chart ranks RRL highest (about 4.5% cash plus franking credits to about 6.5%) ahead of EVN, NST, WGX, RMS, VAU, CMM, GMD, with GGP showing no bar.
Left: gold-pour photo with three stacked gold circles ($38M, $265M, $850M) linked by arrows and labelled text; right: horizontal stacked bar chart of FY26 dividend yield with solid bars for declared dividends and light grey dashed bars for embedded franking credit value, plus legend box.
"Solid fundamentals enable continued delivery into spot gold prices": quarterly cash and bullion of $80M (Sep-24), $229M (Dec-24), $367M (Mar-25), $517M (Jun-25), $675M (Sep-25), $930M (Dec-25), $1,128M (Mar-26), $1,184M (Jun-26) and $1,277M (Sep-26), with quarterly builds of +$149M, +$138M, +$150M, +$158M, +$255M, +$198M, +$56M and +$93M, after paying a $38M dividend and a $114M dividend along the way.
Nine-column bar chart in muted gold with value labels inside bars; curved arrows between bars show the quarterly increments; red arrows mark the two dividend payments.
"Reinvesting to extend profitable production across the business." FY27 guidance: Group production 360–400koz (Duketon 240–270koz, Tropicana 120–130koz); AISC $2,990–3,390/oz group (includes ~$88/oz non-cash stockpile adjustments), Duketon $3,100–3,550/oz, Tropicana $2,630–2,950/oz; growth capital $250–270M (Duketon $235–245M, Tropicana $15–25M); exploration $80–90M; McPhillamys $30–35M. Notes: Duketon production skewed to H2, growth capital skewed to H1, catch-up tax payment of ~$230M in the December quarter.
Three icon bullets across the top; guidance table with Group column boxed in gold and Duketon / Tropicana columns alongside; stacked bar on the right splitting 360–400koz into Duketon and Tropicana.
Section divider for the growth-of-operations section, subtitled "Optimising & Extending Operations".
Large title and subtitle on the left over the faded "R" watermark.
Repeat of the operating model slide as the section opener: Duketon's paid-for infrastructure at the centre of a cycle of ~A$76/oz ounce replacement, strong free cash flow and reinvestment, returning +$300M in declared dividends over 18 months and a 6.5% dividend yield.
Identical to page 5: Duketon geology map left, three-step donut cycle right, KPI callouts and arrows to shareholder returns below.
"BuckWell — delivering profitable tonnes & ounces": the Moolart mill (~2.5Mtpa) had been in care and maintenance and restarted treating historic stockpiles at record gold prices; BuckWell (Buckingham and Wellington pits) delivers a further ~223koz over ~5.7 years with $268M pre-tax NPV(5.6%) and 127% IRR at A$5,387/oz. Duketon combined mill throughput rose 10% from 7.4Mt in FY25 to 8.1Mt in FY26. Callout: the team keeps identifying new discovery ounces and exploiting opportunistic ounces.
Satellite image of the BuckWell area on the left with labelled callouts (Camp, All Weather Airstrip, Buckingham, Wellington, Processing Plant); bullet list top-right; FY25 vs FY26 throughput tiles with a +10% arrow; boxed statement at the bottom.
"~850% increase in underground Ore Reserves at Duketon including depletion of 475koz of gold since 2019": underground Ore Reserves of 123koz (2019), 220 (2020), 260 (2021), 330 (2022), 335 (2023), 441 (2024) and 714koz (2025), with cumulative underground depletion of 26, 92, 152, 256, 359 and 475koz from 2020 to 2025.
Stacked column chart (gold = UG Ore Reserves, blue = cumulative UG mining depletion) by year in koz Au, with a large outlined arrow and "Delivering production sustainability" label; headline banner at the top.
"Garden Well mineralisation confirmed 500m down plunge of current resources": a 3km long section shows GDW South at 121koz Reserve plus 170koz depletion (291koz) and GDW Main at 352koz Reserve plus 5koz depletion (357koz), as at 31 December 2025, with highlighted drill intercepts of 3.9m @ 4.0 and 10.4m @ 2.9 below the current designs.
Wide south–north long-section image of the Garden Well underground showing development, M+I and Inferred Resource blocks; two yellow outlines for GDW South and GDW Main with Reserve-plus-depletion text boxes; red circles around new intercepts; legend bottom-right.
"Rosemont Stage 3 intersections confirm host unit extends ~600m south of current designs": RMT Central and Main 19koz Reserve plus 200koz depletion (219koz); RMT South 49koz Reserve plus 105koz depletion (154koz); RMT Stage 3 Development 167koz Reserve. New intercepts to the south include 1.6m @ 8.8, 3.3m @ 3.7, 3.4m @ 2.4, 1.0m @ 2.8, 1.0m @ 2.2 and 1.0m @ 4.4 (reported 21 September 2026).
South–north long section beneath Rosemont South and Main pits with three yellow outlines for Stage 3, RMT South and RMT Central/Main; intercept labels on the left with a red arrow pointing south; legend bottom-right.
"New discovery only 4km Garden Well": a new discovery in the Garden Well hub with an initial 270koz Mineral Resource (200koz Indicated, 70koz Inferred) declared mid 2026; Reserve definition drilling completed with assays pending; exploration continues near built and paid-for infrastructure. Message: discovery close to established processing capacity remains the most capital-effective way to add ounces.
Satellite map on the left showing Garden Well, Tooheys Well, Erlistoun, Russell's Find and Beamish South with a yellow ~4km distance arrow; four icon bullets and a large italic statement on the right.
"Reserves grow through discovery and ongoing underground step-outs": Duketon Ore Reserves of 1,400koz (2021), 950 (2022), 798 (2023), 1,082 (2024) and 1,389koz (2025), with cumulative Duketon mining depletion of 371, 712, 1,002 and 1,265koz from 2022 to 2025. KPI tiles: A$76/oz Duketon Resource replacement (exploration + Resource development); +~480% Duketon UG Ore Reserve growth after depletion since 2019; +169% Tropicana UG Ore Reserve growth after depletion since 2018.
Stacked column chart (gold Reserves, navy cumulative depletion) across five years with legend; three bordered KPI tiles with large gold numbers below.
"Re-focus on greenfield exploration, utilising orebody knowledge built on operating experience, is delivering value": an exploration-to-development funnel with 32 prospects at Stage 1 Generation, 30 at Stage 2 Definition, 21 at Stage 3 Continuity, 9 projects at Stage 4 Inferred / Study and 7 projects at Stage 5 Indicated / Approval, alongside the A$76/oz Duketon Resource replacement figure.
Horizontal funnel narrowing left to right, divided into five stage columns by dashed lines, each with an oval count; two chevron headers (Exploration, Project Development) above; KPI tile bottom-right.
"169% increase in Tropicana underground Ore Reserves, excluding production of 808koz of gold, since 2018" (100% basis): UG Ore Reserves of 317koz (2018, the initial Boston Shaker UG Reserve), 313, 309, 333, 378, 661, 641 and 851koz (2025), with cumulative UG depletion rising from 42koz (2020) to 144, 273, 450, 648 and 808koz (2025). Sitewide cumulative UG production is now 2.5x and the sitewide UG Ore Reserve 2.7x the initial Boston Shaker UG Reserve. Regis acquired its 30% on 31 May 2021.
Stacked column chart 2018–2025 in koz gold with bold headline over the chart area and two supporting statements joined by "AND"; Regis logo marker above the 2021 bar.
"Drilling continues to demonstrate mineralisation outside Resource": Havana underground remains on track for first production in H1 CY2027; surface infill drilling at Havana South is testing higher-grade continuity as part of a study into another underground mining area; Boston Shaker 3 drilling began in the second half of FY26 to test mineralisation down plunge. The SW–NE long section across Havana South, Havana, Swizzler, Tropicana and Boston Shaker shows intercepts such as 4m @ 13.9, 22m @ 9.5, 7m @ 8.1, 14m @ 6.2 and 48m @ 2.3 (drilling November 2025 to May 2026). Next exploration update due late 2026.
Three icon bullets on the left; large 3D long-section image on the right with labelled intercept boxes and red circles around drilling clusters; legend inside the image; bold note bottom-right.
Close-up long sections of Tropicana and Boston Shaker showing drilling outside the Resource: Tropicana intercepts include 22m @ 9.5, 7m @ 8.1, 4m @ 6.7, 9m @ 6.5 and 29m @ 3.2; Boston Shaker deeper drilling about 500m below current workings includes 48m @ 2.3, 36m @ 2.9, 12m @ 5.2 and 18m @ 3.1.
Two side-by-side SW–NE section images, each with dense columns of intercept labels, red circles around new results, development and Resource shading, and legends; a 500m scale arrow on the Boston Shaker panel.
Long section of Havana South and Havana: Havana South intercepts include 4m @ 13.9, 12m @ 5.0, 14m @ 6.2, 4m @ 5.5 and 13m @ 3.8; Havana intercepts include 8m @ 7.6, 14m @ 3.5 and 7m @ 2.5, sitting beside M+I and Inferred Resource blocks.
Single centred SW–NE section image with intercept label stacks below each target, red circles around the drilling clusters, scale bar and legend.
Section divider for the organic growth section focused on McPhillamys, subtitled "Step changing production and cost".
Large title and subtitle on the left over the faded "R" watermark.
"PFS underscores the scale of the opportunity": the PFS (19 June 2026) outlines a permitting pathway avoiding Section 10, NPV(5.5%) of $1.1 billion and IRR of 21.8% after tax at A$4,000/oz, ~10 years of production averaging 190koz p.a. with a 239koz p.a. peak, and LOM AISC of A$1,718/oz (year 10 at 26koz @ $3,688/oz included in the average, to be optimised). A banner notes the Federal Court has ruled the Section 10 declaration invalid; while the Minister's redetermination is pending, Regis progresses the IWL alternative that avoids the declared area entirely.
Bullet list top-left, site layout aerial image top-right, combo chart below (gold columns for annual gold recovered by year 1–10, navy dots for AISC A$/oz on a secondary axis, dashed LOM average line), boxed italic banner at the bottom.
"Geology remains open at depth, mine design and schedule optimisation part of underway studies": more value to be found – open at depth; regional opportunities including Discovery Ridge (400koz); district upside including Kings Plains. The west–east section shows intercepts below the pit design such as 141m @ 1.9 g/t, 96m @ 1.9 g/t, 142m @ 1.1 g/t and 59m @ 2.2 g/t.
Bullet list on the left with a bold lead-in; cross-section image on the right showing drill holes, pit outline, mineralised zone and an "Open at Depth" arrow.
"Substantial footprint in prolific district": a project location map of central NSW places McPhillamys (1.9Moz Au) near Cadia (13.5Moz Au / 2.9Mt Cu), Cowal (5.1Moz Au), Northparkes (860koz Au / 500kt Cu) and Tomingley (620koz Au); a Discovery Ridge section shows intercepts such as 117m @ 2.5 g/t, 136m @ 1.8 g/t, 94m @ 2.6 g/t and 74m @ 2.2 g/t, open at depth; a Kings Plains section shows current drilling of 23m @ 0.5 and 35m @ 1.0 (announced 24 June 2026).
Three-panel composition: Discovery Ridge cross-section (red frame) top-left, Kings Plains cross-section (yellow frame) top-right, regional location map bottom-centre with coloured arrows linking each section to its location.
Investment summary: "A self-sustaining model, built on our substantial infrastructure base" – established infrastructure; a clean, debt-free balance sheet and $1.3 billion cash and bullion delivered in 24 months (before the $300M debt repayment in January 2025); significant value from low-cost incremental discovery; opportunistic ounces adding value now; sector-leading FCF per share; ~$850M fully franked dividends declared since 2013; a permitting pathway and timeline for the 1.9Moz McPhillamys project – "while continuing to assess value-accretive opportunities".
Boxed italic tagline at top, green-tick checklist of seven points in the middle, small operating-model cycle graphic top-right, boxed closing statement at the bottom.
Contact slide: Mathew Collings, Head of Investor Relations, +61 8 9442 2200, enquiries@regisresources.com.
Regis logo on the left, large gold-leaf and open-pit "R" brand mark in the centre, contact details on the right.
Section divider introducing the appendix of Resource and Reserve tables and peer source data.
Single large title on the left over the faded "R" watermark.
Attributable Ore Reserves at 31 December 2025: Duketon North 16Mt @ 0.8g/t for 433koz; Duketon South 22Mt @ 1.4g/t for 957koz (incl. underground 12Mt @ 1.8g/t for 714koz); Duketon total 38Mt @ 1.1g/t for 1,389koz; Tropicana (30%) 12Mt @ 1.5g/t for 576koz; Regis total 49Mt @ 1.2g/t for 1,965koz (Proved 351koz, Probable 1,614koz). McPhillamys Ore Reserve at 31 May 2026: 56Mt @ 1.1g/t for 1,890koz, all Probable.
Two tables (group Reserves by project and type; McPhillamys Reserve) with Proved, Probable and Total column groups of tonnes, grade and metal; subtotal rows shaded in progressively darker gold.
Attributable Mineral Resources at 31 December 2025 (inclusive of Reserves): Duketon North 49Mt @ 0.9g/t for 1,400koz; Duketon South 55Mt @ 1.5g/t for 2,590koz; Duketon total 104Mt @ 1.2g/t for 3,990koz; Tropicana (30%) 26Mt @ 1.9g/t for 1,620koz; McPhillamys 70Mt @ 1.0g/t for 2,260koz; Discovery Ridge 8Mt @ 1.5g/t for 400koz; NSW total 78Mt @ 1.1g/t for 2,660koz; Regis total 209Mt @ 1.2g/t for 8,280koz (Measured 790koz, Indicated 5,780koz, Inferred 1,700koz).
Single wide table with Measured, Indicated, Inferred and Total Resource column groups; subtotal rows shaded; footnote on rounding and inclusive reporting.
Peer dividend inputs used for the yield chart: FY26 declared dividends, franking and 11 September 2026 closing price – NST 55cps, 100%, $22.08; EVN 41cps, 100%, $14.00; CMM 10cps, 100%, $14.96; RMS 6cps, 100%, $3.74; WGX 10cps, 100%, $5.63; GMD 5cps, 100%, $7.65; VAU 7cps, 0%, $6.37 – each with its ASX announcement source and publication date.
Single bordered table with gold header row and six columns (company, dividend, franking, closing price, source, published date).
Inputs behind the FCF-per-share chart: for RRL, net cash from operating activities A$1,247M less net cash used in investing A$441M gives FCF of A$806M over 762M fully diluted shares = A$1.06/share. Peers: NST 471/1,432 = 0.33; EVN 1,143/2,063 = 0.69; CMM 168/459 = 0.37; RMS 230/1,898 = 0.12; WGX 539/953 = 0.57; GMD 608/1,199 = 0.51; VAU 523/1,053 = 0.50; GGP 783/700 = 1.12. Investing cash flow excludes PP&E disposal proceeds and asset acquisitions.
Wide ten-column table with gold header showing the calculation steps (A, B, C = A–B, D, C/D) plus source and publication-date columns.
Common questions about this slide and the underlying presentation content.
It is the 34-slide deck "Regis Resources – The Golden Opportunity" that Regis Resources Ltd (ASX: RRL) presented at the Citi Australia / New Zealand Investment Conference and lodged with the ASX on 19 October 2026. It covers the Duketon and Tropicana operations, Q1 FY27 results, FY27 guidance, dividends, Reserve growth and the McPhillamys project.
Figures are in Australian dollars (A$) unless stated otherwise; the disclaimer notes any USD figures are converted at 0.72 AUD:USD. Regis has a June year end, so FY26 covers July 2025 to June 2026 and FY27 covers July 2026 to June 2027. Q1 FY27 is the quarter to 30 September 2026.
Group production of 360–400koz (Duketon 240–270koz, Tropicana 120–130koz) at AISC of A$2,990–3,390/oz, with growth capital of A$250–270M, exploration of A$80–90M and A$30–35M for McPhillamys. Duketon production is weighted to the second half and a ~A$230M catch-up tax payment falls in the December quarter.
Group production of 83.0koz at AISC of A$3,617/oz, gold sales of 74.5koz at A$6,088/oz, cash and bullion up A$93M to A$1.28B (including the A$51M Vault break fee and after A$53M tax), and an LTIFR of 0.0. After the quarter Regis paid a fully franked 20c final FY26 dividend (A$152M).
The deck shows FY26 free cash flow per fully diluted share of A$1.06 for Regis, second only to Greatland (A$1.12) and the highest among dividend-paying producers, and a 6.5% grossed-up FY26 dividend yield (35cps fully franked) that tops the peer group. The appendix reproduces the peer source data.
McPhillamys in NSW has a 1.9Moz Ore Reserve at 1.1g/t. The June 2026 PFS shows NPV(5.5%) of A$1.1 billion and 21.8% IRR after tax at A$4,000/oz, ~10 years at an average 190koz a year and LOM AISC of A$1,718/oz, with FID targeted for H1 2028. The Federal Court ruled the Section 10 declaration invalid, and Regis is also progressing an IWL layout that avoids the declared area.
Group Reserves are about 3.9Moz (1,965koz attributable at 31 December 2025 plus 1,890koz at McPhillamys at 31 May 2026), and group Mineral Resources are 8,280koz (209Mt at 1.2g/t), with Tropicana reported at Regis' 30% share.
Yes. The page offers the original PDF and an editable PPTX converted from it. The structure (operating model, guidance table, peer bar charts, Reserve-plus-depletion stacked columns, long sections and appendix tables) works as a reference for any mining or resources investor presentation. The content and data remain Regis Resources' disclosures.
Company investor page cited in the deck itself (slide 18), hosting annual reports, quarterly reports and presentations.

Create Your Own Slides
Turn your ideas into professional presentations in seconds with 2slides AI.
Reference professional designs, choose your style, and generate slides with perfect text rendering. Powered by Nano Banana—start creating your presentation now.
Your AI Agent for slides. Save time, shine faster with intelligent presentation creation.


© 2026 2slides. All rights reserved.