
Part of Investor presentation examples
IMDEX Investor Strategy Day 2026 – the 95-slide presentation IMDEX Limited (ASX-listed mining technology company: drilling optimisation, rock knowledge sensors and software) gave investors in Sydney on 26 October 2026 and lodged with the ASX. Filed as the "IMD Investor Strategy Day Presentation", it covers the Capture / Analyse / Solve strategy, a guest EY view of mining and metals risks, the geoscience case that cost variance lives in the orebody, customer share-of-wallet growth, two customer case studies, market expansion, people and capital management. Amounts are in Australian dollars (A$); FY26 is the Australian fiscal year July 2025 to June 2026.
Uses this deck’s cover as a style reference for slides made from your own content. Or pick any page below to use its layout as the reference.
Quick Navigation
Tags
Share the slides
IMDEX Investor Strategy Day 2026 – the 95-slide presentation IMDEX Limited (ASX-listed mining technology company: drilling optimisation, rock knowledge sensors and software) gave investors in Sydney on 26 October 2026 and lodged with the ASX. Filed as the "IMD Investor Strategy Day Presentation", it covers the Capture / Analyse / Solve strategy, a guest EY view of mining and metals risks, the geoscience case that cost variance lives in the orebody, customer share-of-wallet growth, two customer case studies, market expansion, people and capital management. Amounts are in Australian dollars (A$); FY26 is the Australian fiscal year July 2025 to June 2026.
Detailed view of each slide page, including layout, key content and visual elements.
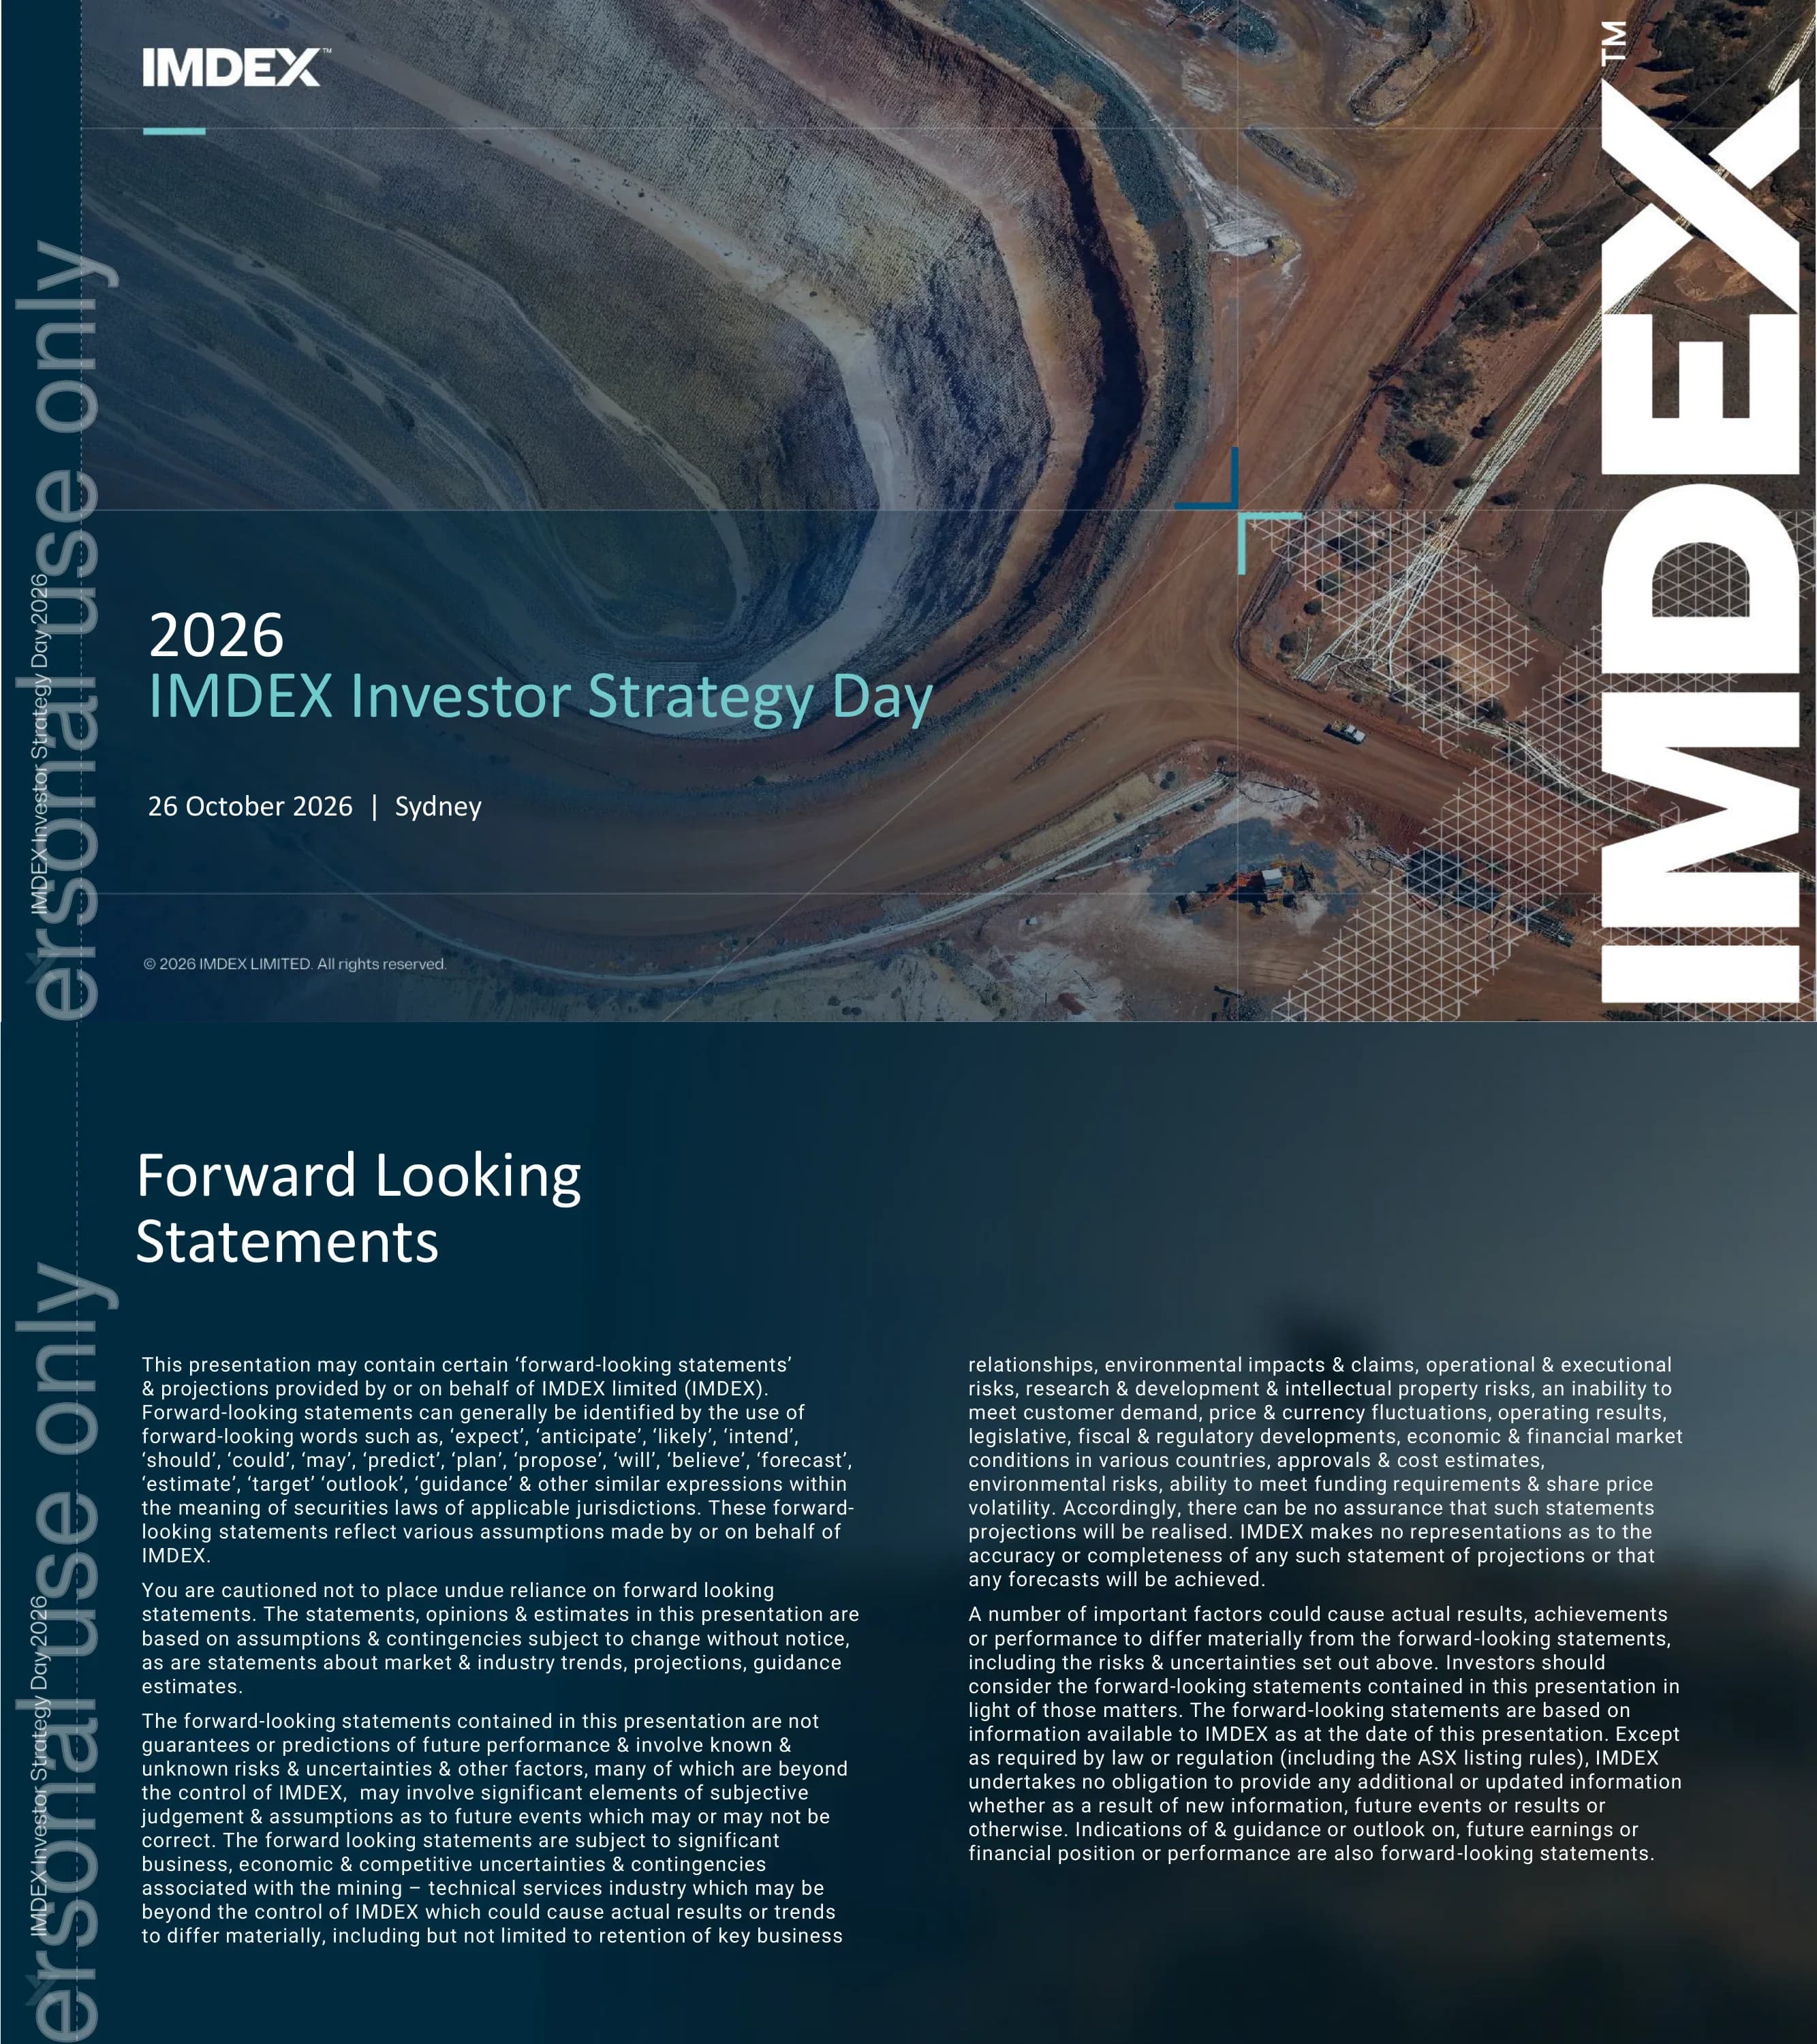
Cover slide for the 2026 IMDEX Investor Strategy Day, held 26 October 2026 in Sydney. Carries the IMDEX wordmark and a 2026 IMDEX Limited copyright line.
Full-bleed aerial photo of an open-pit mine with a dark navy-to-teal gradient overlay on the left; title block lower-left in white and teal; giant vertical white IMDEX wordmark down the right edge over a triangular wireframe mesh; thin grid lines and a teal crosshair accent.
Standard legal disclaimer warning that the presentation contains forward-looking statements, projections and guidance subject to risks such as commodity price and currency fluctuations, R&D and IP risk, and regulatory change. IMDEX undertakes no obligation to update except as required by law, including the ASX listing rules.
Large white title top-left over a blurred dark navy background; dense body text set in two equal columns across the lower two-thirds; dashed vertical rule and running deck name on the left margin.
Section opener for the first session, presented by Paul House (IMDEX CEO), covering the introduction, business and strategy overview.
Navy-tinted photo of a technician unpacking IMDEX downhole instruments from a foam-lined case; three-line white title upper-left; portrait headshot centre-bottom with a 'Presenter' pill label and name; vertical IMDEX wordmark and mesh on the right.
Agenda for 26 October 2026 in Sydney running from 12:15pm arrival and lunch to 4:30pm networking drinks, with sessions by Paul House, Paul Mitchell (EY), Dave Lawie, Shaun Southwell & Michelle Carey, Erlend Olsø, Antonio Sardo, Tom Carmichael and Linda Lim. Sessions are grouped into three themes: The Market Need, The Solution and The Delivery, with three Q&A blocks.
Four-column table (Time, Presenter, Topic, Duration) with teal column headers and a teal rule; zebra-like row bands; left-side shaded labels group rows into The Market Need, The Solution and The Delivery.
IMDEX's vision: 'To be the most advanced system enabling the world's most consequential subsurface decisions.' Supporting line says the strategy builds on IMDEX's leadership in mining technology and earth sciences.
Full-bleed aerial photo of green forested hills under a navy gradient; small teal 'Our vision' kicker, large white vision statement mid-left, teal supporting statement below; vertical IMDEX wordmark with mesh on the right.
The strategy connects technology, data and expertise to help customers find, define and optimise the subsurface with confidence and speed. Three steps: Capture high-quality rock data at the source, Analyse to turn rock data into insights at scale, and Solve to turn insights into confident decisions.
Dark navy background; headline top-left; three large words 'Capture / Analyse / Solve' in a horizontal row with small icons (sensor fan, rock sample, 3D orebody point cloud) and teal captions; stacked isometric line-art layers (helicopter, drill rigs, mine site, plant) on the right edge.
US$150bn+ of potential mineral exploration investment over the next decade (CY26–CY35, based on CY25 S&P Global budgets of US$12.4bn compounding at ~6% a year). Societal need, declining reserves and a harder discovery challenge leave IMDEX positioned to help, and the deck promises to show how strategy connects customer value to shareholder value.
Left column holds the headline; right side has a wide navy hero box with the large teal US$150bn+ figure, a 2x2 grid of navy cards (Societal need, Supply, Discovery challenge) with the IMDEX's advantage card in bright blue; outlined call-out bar along the bottom and a footnote.
IMDEX growth strategy built on one integrated platform with four levers: 01 Market Share (next-generation technology, directional drilling, acquired technologies), 02 Share of wallet (broader portfolio, integrated on-site solutions, recurring revenue), 03 Structural Market Shift (productivity, supply chains, rising exploration demand) and 04 Market Expansion (into mining production and civil, infrastructure, water and energy markets).
Central ring diagram split into four photo-filled quadrants numbered 01–04 around a navy hub reading 'One Integrated platform – Enabling multiple growth pathways'; dashed leader lines connect each quadrant to text blocks on the left (02, 03) and right (01, 04); mountain photo faded in the background.
Five-step chain of results: platform-enabled rental revenue up 170% vs FY21; platform revenue rising from 33% to 47% of group revenue vs FY21; exploration revenue per $100 of exploration spend from $1.40 to $2.40 vs FY21; normalised EBITDA margin from 18% to 31% vs FY17; and consistently >80% cash conversion.
Headline and teal subhead on the left; five tall navy columns on the right, each with a numbered teal circle, bold heading, short description, divider and a large teal KPI with caption; arrow chevrons link the columns left to right.
Revenue grew from A$176m in FY17 to A$520m in FY26 (3.0x, ~13% CAGR), while normalised EBITDA rose from A$32m to A$163m (5.1x, ~20% CAGR). Normalised EBITDA margin expanded from 18% to 31% (+13 points), showing operating leverage.
Headline top-left with teal takeaway bottom-left; centre clustered column chart comparing FY17 (blue) and FY26 (teal) for Revenue and Normalised EBITDA with value labels; three stacked navy stat boxes on the right; outlined conclusion banner at the bottom.
Platform revenue rose from 33% of revenue in FY21 to 47% in FY26, with equipment, sales and services falling from 67% to 53%. IMDEX is diversifying by geography, customers (no customer above 1% of revenue), end markets and relationships with geoscientists and resource companies.
Headline and teal takeaway on the left; two 100% stacked columns (FY21, FY26) in blue and teal in the centre with a legend; four white dashed-border cards on the right listing diversification dimensions.
From/To matrix: product leadership to integrated solutions, drillers to drillers plus geoscientists and resource companies, and mining exploration to exploration, production and adjacent earth-science markets. A 45+ year timeline runs from 'Build the foundation' (1980s–2000s) to 'Connect the fleet' (2010s) to 'Expand decision intelligence' (2025 and beyond), noting recent acquisitions amplify the offer.
Headline left; upper right is a three-row From→To table with white label tiles, navy 'from' boxes, teal arrows and blue 'to' boxes; below, a three-chevron horizontal timeline (navy, navy, teal) with era captions; outlined banner at the bottom.
IMDEX currently earns $2.40 per $100 of exploration spend, with potential to grow to $10–$18 and $15–$20+ within existing customers on a ~$12bn exploration spend. Growing wider, exploration spend could reach ~US$20bn+ by FY35 (CY25 US$12.4bn compounding ~6% a year), plus larger markets in mining production, infrastructure and energy.
Two nested dashed-ellipse bubble diagrams side by side: left shows a white $2.40 bubble with arrows to $10–$18 and $15–$20+ inside the $12bn exploration spend; right shows current $12bn, future ~$20bn+ and future opportunities rings; two blue boxes 'Grow deeper' and 'Grow wider' below; teal closing line and footnote.
Indexed to 2021, IMDEX exploration revenue (A$) is up ~90% by CY26, versus +26% for S&P exploration budgets (US$) and -11% for inflation- and non-drilling-adjusted exploration activity. The three takeaways: well ahead of underlying activity, resilient through the cycle, and an industry productivity challenge.
Headline and teal subtext on the left; white-panel line chart (CY21–CY26, -20% to 100%) with a solid dark line for IMDEX, dashed blue for budgets and dotted teal for activity, end-point labels; three numbered navy takeaway boxes beneath; methodology footnotes.
Electrification and energy security need more minerals, while new supply is harder to deliver due to supply imbalance, the discovery challenge, and rising capital and time requirements. With US$150bn+ of potential exploration investment over the next decade, IMDEX aims to capture more value per unit of activity through adoption, share of wallet and a more complete offering.
Headline left with teal tagline 'A structural need, not a short-term market call'; right side stacked full-width navy rows with teal labels and white descriptions, the US$150bn+ row highlighted in a lighter blue; teal-outlined 'Our opportunity' box at bottom; page number 15.
Speaker line-up for the day under the theme that better customer decisions support deeper adoption, higher-quality growth and sustainable shareholder returns. Nine presenters: Paul House (Strategy), Paul Mitchell and Dave Lawie (The Market Need), Michelle Carey, Shaun Southwell and Erlend Olsø (The Solution), and Antonio Sardo, Tom Carmichael and Linda Lim (The Delivery).
Title and teal subtitle top-left; photo grid with one tall portrait card on the left and two rows of four portrait cards, each fading to navy at the bottom with name, teal theme label and topic.
Guest section cover from EY, 'Top business risks and opportunities for mining and metals', dated September 2026, presented by Paul Mitchell. Includes EY's tagline and 'Shape the future with confidence' logo lockup.
Full-bleed night photo of an illuminated bridge reflected in water; angled yellow-to-magenta-to-cyan gradient frame enclosing a white bold title; EY logo with yellow beam bottom-right; tagline at bottom.
EY indexed average monthly prices from January 2024 to September 2026 (Jan 2024 = 100) for base and precious metals, iron ore and coal, and battery minerals. Gold and platinum peaked around 240–260 in early 2026, copper climbed to about 170, while cobalt surged to roughly 195 and lithium carbonate rebounded to about 175 in 2026.
Black EY-style background with gradient rule under the title; three side-by-side dark chart panels each containing a multi-series line chart with coloured legends (aluminium/copper/gold/platinum; iron ore/thermal coal/met coal; nickel/lithium carbonate/cobalt); source line and EY logo at bottom.
EY's 2026 risk radar ranks operational complexity first (new for 2026), followed by rising costs and productivity, capital, resources/reserves, licence to operate, workforce, geopolitics, digital and innovation, sustainability and changing business models. Commentary notes geopolitics dominated discussion but was not top, costs are structurally higher and capital is constrained and selective.
Left dark panel with gradient top border and yellow-highlighted bullet keywords; right a fan-shaped radar of ten coloured concentric arcs (teal, magenta, blue, purple) ranked 1–10 with 2026 and 2025 rank markers and arrow/star icons showing movement; legend below.
EY previews its 2027 report: reserve depletion drives operational complexity, disruption forces short-term focus, supply chains grow more complex, capital is more selective but miners who switch to build will win, productivity pressure rises, and innovation including AI is critical to solving complexity.
Black background with warm yellow-orange glow top-right; white title with gradient rule; single column of yellow-arrow bullets with two indented sub-bullets; EY logo bottom-right.
EY survey on which complexities most impact value: regulatory compliance delays 31%, labour availability 30%, processing plant capacity 28%, transport/logistics 28%, down to lack of ore body knowledge 22% and approval delays 19%. Commentary argues innovation is the real solution and miners must invest capital in brownfield operations.
Left column of yellow-arrow bullets with yellow keyword highlights; right horizontal bar chart of twelve complexity factors, top four bars in green and the rest in yellow, with percentage labels; black background with colourful glow at bottom.
EY survey (n=500) shows miners expect lower-risk and ESG-related innovation to have the greatest impact by 2030: supply chain 31%, end-to-end optimisation 27%, energy sources 25%, waste & water 24%, down to market 16% and people 15%. Bullets highlight lower ore grades, AI for reserve replacement, deeper mines, automation and cleaner beneficiation.
Left dark panel with gradient top border and yellow square bullets; right dashed-border panel with a white header box and a yellow horizontal bar chart of 14 innovation areas with percentage labels; base n=500 and survey source note.
Supply or value-chain risk is exposing critical dependencies: 53% of respondents invest in procurement visibility and 51% are strengthening traceability. Cybersecurity is a key exposure, with only 18% reporting full visibility over SCADA/industrial controls and 67% of assets in a 'vulnerability zone'; below the radar are digital & innovation, workforce and productivity.
Black background; left column with two yellow subheadings and white square-bullet lists; right yellow-outlined box with yellow heading and three larger bullets; EY logo bottom-right.
Repeat of the speaker line-up divider (identical to page 16), returning to the IMDEX sessions after the EY guest section. Lists the nine presenters and their Market Need, Solution and Delivery topics.
Identical to page 16: title and teal subtitle top-left; tall CEO portrait card plus a two-row grid of eight portrait cards with navy gradient name and topic overlays.
Section opener for Dave Lawie's industry update, 'Variability as the cost of not knowing'.
Navy-tinted photo of hands holding a rugged IMDEX handheld showing the SURVEY-IQ app; teal kicker and large white title upper-left; presenter headshot with 'Presenter' pill; vertical IMDEX wordmark and mesh on the right.
Critical minerals have moved from geology reports to cabinet rooms, defence plans and industrial strategy. Source credited to Vikramaditya G. Yadav (UBC).
Dark navy overlay on a photo of a politician speaking at an outdoor podium on the right; very large white headline top-left; statement mid-left with 'geology reports' highlighted in teal; thin grid lines and teal crosshair.
Animated dumbbell chart (shown at 1994) plotting twelve commodities from gold to uranium on a -5 USA-aligned to +5 China-aligned scale, comparing mined versus refined alignment and the value-chain gap between them. Post-2024 values are projected and directional; sources USGS, ICSG, UNCTAD and IEA (2023).
Embedded dark dashboard screenshot with a year slider and STOP button; dumbbell plot with blue (USA-aligned) left half and dark red (China-aligned) right half; coloured dots per commodity linked by lines; legend on the right explaining mined/refined markers and the scale.
Technology companies are weighing equity in miners to secure data-centre metals: Anglo Teck would hold ~5% of world copper pending Beijing clearance; AI data centres need 35 t/MW of copper vs 27 t/MW conventionally, with capacity growing from 84 GW in 2025 to about 600 GW by 2040. Anglo American has held talks on tech-company equity stakes, so strategic buyers are pricing supply security, not the commodity cycle.
Title and teal subtitle top-left; three equal navy cards in a row, each with a large teal headline figure (~5%, 35 t/MW, Equity), a short caption and an explanatory paragraph; teal takeaway sentence below; sources footer.
KPMG waterfall from a single operation (David Rose, IMARC 2015) bridges budget $/t shipped of 87.02 to actual of 81.83, splitting variance into IoG spatial and orebody factors (stripping ratio, haul routes) and IoT activity cost drivers. The orebody items such as cutback ratio (17.70) and in-pit ore benefits (13.57) are far larger than activity items like drill and blast (1.87).
Teal kicker and white title; full-width waterfall chart with white total bars and green/red variance bars; purple dashed box marks 'IoG / Spatial & Orebody Factors', teal dashed box marks 'IoT / Activity Cost Drivers'; sub-brackets for Stripping Ratio and Haul Routes; KPMG logo and source.
In one operation's budget-to-actual bridge, spatial and orebody factors (IoG) drove ~68 $/t of gross cost variance versus ~12 for activity cost drivers (IoT), a ~5:1 ratio. The message: the industry instruments activities, but the money is lost in the orebody.
Teal kicker 'The Rocks Speak', white title and subtitle; left navy panel with a two-bar horizontal chart (teal ~68, blue ~12) with large bold labels; right blue panel with giant teal '~5:1' and explanatory text; KPMG logo and source footnote.
Over the last 10 years there were 289 impairment charges totalling US$129b; 33% were technical (mine plan updates, process recovery, operational performance) and 67% external factors, mostly commodity prices (47% of all charges). The technical third is the part better ground knowledge can influence (source: Haruna Grema, UBC, 2026).
Title and teal subtitle top-left; central donut chart with blue 67% and bright yellow 33% segments and centre labels '289 charges' and 'US$129b Impairment'; dashed leader lines to External Factors (left) and Technical (right) text blocks.
Eight primary causes of performance issues at TSX-listed miners in 2015–2024: geotechnical leads with 389 events, then other geological factors 215, metallurgical 125, data quality/insufficiency 49, ore variability/hardness 25, operation/mining 18, block model discrepancy 16 and exploration result 8. Only 18% of all cases led to write-downs.
Title and teal subtitle top-left; horizontal bar chart of eight causes with blue bars and the geotechnical bar highlighted in bright yellow, x-axis 0–400 'number of events'; two-line conclusion below with 18% in blue; source footnote.
Mining project outcomes miss plan, citing Haruna Grema's 2026 University of British Columbia (UBC) study 'Mapping Value Creation and Destruction in the Mining Industry'. Median deviations: production -12.0% (n=321), head grade -11.8%, metallurgical recovery -8.0%, throughput -15.6%, reserve/resource revision -25.0%. Costs overshoot: operating cost (incl. AISC, all-in sustaining cost) +16.3%, capital cost actual vs plan +20.8%, and capital cost estimate revision +225%.
Dark navy slide with a white title and a teal subtitle. A full-width ridgeline (joy) plot has eight stacked density curves with jittered dot strips, on a relative-deviation axis from -100% to +150% with a zero reference line. Output metrics are pale blue-grey and cost metrics are red. The median and n values sit in right-hand columns, with cost medians in red.
Asks 'What is the cost of the technical errors?' and charts impairment costs for technical failures in $ millions (2015 CAD) by cause: Resource/Reserve Estimation (n=12), Geological model (n=12), Geotechnical/Water (n=7), Metallurgy/Recovery (n=5) and Other (n=8). The Geotechnical/Water box is highlighted, with a whisker reaching roughly 600m. Source: Dr Shaun Barker, UBC 2026.
Box-and-whisker chart with a broken y-axis: a lower panel from 0 to 600 and an upper panel from 1,000 to 3,000 for outliers. Each category has a dark box with a white median band. The geotech box is outlined in bright yellow with a teal fill, inside a dashed highlight frame. An aerial river/mine landscape photo bleeds in on the right, with teal corner-bracket graphics.
IMDEX Decision Science Research models geotech impairment costs as a log-normal distribution: P50 US$170m, mean US$234.9m and P90 US$500m, capped at US$1b. The mitigant (option) costs US$4m and is not 'perfect'. Takeaway: impairment risk is dominated by rare but catastrophic losses, which is what Value of Information (VoI) is designed to mitigate.
A thick yellow probability-density curve on a dark chart panel, with dashed vertical markers for P50, mean and P90 and a 'max cap 1.8%' spike at 1,000. A translucent grey callout box on the right lists six key assumptions with teal US$ figures. A dark band across the bottom carries the takeaway, over an aerial landscape photo background.
A US$4 million investment in geotech data cuts the probability of a US$100 million impairment from 22% to 2.2%. Geotech data compresses the tail, so extreme-loss exceedance falls by an order of magnitude. Source: IMDEX Decision Science Research, 2026.
Two-line exceedance chart: probability (0–30%) against impairment cost (US$0–500m). A teal 'No Geotech data gathering' curve sits far above a yellow 'Gather Geotech data' curve, with dashed guides marking 22% and 2.2% at US$100m. A stacked column of product logos (IMDEX, Datarock, ALT, WellCAD) and a legend sit on the right, with a bottom takeaway band over an aerial photo.
Lists McKinsey's five areas of action for mining in 2026: operations value creation (>US$300bn), capital excellence (US$75–125bn), procurement excellence (>US$75bn), and commercial excellence and technology & AI (both cross-cutting). Of the four physical-AI tools in the operations area, only real-time drilling data integration is 'ioG: reads the rock'. Autonomous haulage, autonomous reagent dosing and digital furnace control loops are 'ioT: runs the activity'. 'ioG' and 'ioT' are IMDEX's own labels.
Two-part layout. On the left is a numbered list of five rows, with row 1 boxed in yellow and joined by a teal connector line to the right-hand panel. On the right are four white tool cards with line icons. The first card is teal-filled with a yellow border, and the others carry red 'ioT' labels. A bold two-tone statement sits underneath.
Shows how reducing orebody knowledge uncertainty pays off on an actual Canadian drilling program: a 300K oz Au resource defined with half the planned drilling, ~CA$8m in drilling cost savings against the original plan, and ~CA$76m NPV uplift from bringing production forward. The cost and NPV figures are estimates only.
Left column of three oversized stat callouts (white and teal) separated by dashed rules. On the right is a large black-background 3D render of an orebody heat-map body intersected by teal drill-hole traces, captioned 'each drill hole is planned with precision'. A row of acquired-brand logos sits along the bottom (Datarock, ALT, Earth Science Analytics, Mount Sopris, Krux).
Sums up the market need: the geology has not changed, value and policy focus have moved to the orebody, and new resources are more capital-intensive. It sets out two value pools: McKinsey's US$450–750bn productivity prize, which real-time drill data integration speeds up, and a comparable pool in avoiding asymmetric downside risk through a Value of Information framework. Measuring and controlling subsurface uncertainty unlocks both, through organic R&D and acquisitions.
Stacked header block of a 'So what?' title and three teal lines. Below it a large white heading introduces two side-by-side translucent navy panels with body text. Two closing statement lines and a small footnote sit at the bottom, over a blurred dark background.
A Q&A break led by presenter Paul House after the market-need section.
Branded divider: the IMDEX logo top-left, a large white 'Audience Q&A' heading, a 'Presenter' pill tag with a name and a framed headshot. A full-bleed photo of a worker in safety glasses and a hi-vis vest has a navy overlay, with giant vertical IMDEX lettering and a triangular mesh pattern on the right.
An agenda slide (the speaker roster, shown again on page 56) under the line 'Better customer decisions support deeper adoption, higher-quality growth and sustainable shareholder returns.' It lists nine presenters by section: Paul House (Strategy); Paul Mitchell and Dave Lawie (The Market Need); Shaun Southwell, Michelle Carey and Erlend Olsø (The Solution); and Tom Carmichael, Antonio Sardo and Linda Lim (The Delivery: knowledge advantage, commercial value, capital management).
A tall portrait tile of the CEO on the left, next to a 4×2 grid of square headshot tiles. Each tile has a gradient fade to navy at the bottom, with a name, a teal section label and the talk title. A white title and a teal subtitle sit at the top.
Section divider for the growth-strategy-by-customer section, presented by Shaun Southwell and Michelle Carey.
Branded divider template: the IMDEX logo, a large three-line white title, a presenter pill and two side-by-side headshots. A close-up photo of a diamond core drill bit sits behind a navy gradient, with giant vertical IMDEX lettering and a mesh pattern on the right.
Opens the growth story under the line 'Growing value within our customers'.
Minimal statement slide: wide-tracked white headline, teal second line and a small white subline on the left. A dusk photo of a drill rig and pipe racks fades in from the right behind a navy gradient.
Under 'Proven track record', it names four foundations connected around the customer workflow: customer access, technology, data and expertise.
Four equal cards in a row, numbered /1–/4. Each has a coloured top rule and coloured title (blue, teal, coral, amber) on a white upper half, with a photo or visual below: a worker in hi-vis, a glowing sensor tool, drill-hole traces, and a 3D geology point cloud. A teal caption runs along the bottom.
IMDEX's share of wallet rose from $1.40 'then' to $2.40 'today', defined as IMDEX exploration revenue relative to estimated FY26 global exploration spend. The growth levers are build, buy and expand.
Large white '$1.40' and teal '$2.40' figures joined by a thick teal arrow. A progress bar below is filled partway. Three numbered white cards (Build in blue, Buy in orange, Expand in teal) and a fine-print methodology footnote sit underneath.
This build of the previous slide extends share of wallet from $1.40 then and $2.40 today to $10–$18 of opportunity headroom. That headroom is unlocked through four levers: capabilities, workflow, data reuse and decisions.
Three-step number sequence ($1.40 white → $2.40 teal → $10–$18 orange) joined by teal arrows above a progress bar. A row of four numbered cards has blue, orange, teal and dark-teal top rules, with a methodology footnote below.
One connected system, built on positions IMDEX holds today, in three stages. Capture covers drill optimisation, directional core drilling, borehole direction, rock orientation, the data foundation and field expertise. Analyse covers drill productivity, automated logging, mineralogy, analytics and modelling inputs. Solve covers exploration targeting, near-mine vectoring, resource confidence, geotech support and closure planning. A strip of acquired capabilities runs along the bottom: Krux, Datarock, aiSIRIS, Earth Science Analytics, ALT, WellCAD and Devico.
Three columns headed 'Capture / Analyse / Solve' in large white type, each with a small 3D thumbnail and tagline. Below are three white list boxes with teal, blue and orange left borders. A white logo band labelled 'Acquired capability' runs across the bottom.
Capture stage: for customers, more productive drilling and more value from every metre, through optimisation at the rig, a trusted advisor on site and connected capture. Progression: today 'embedded at the drill site', next 'connected decision loops', leading to share of wallet: 'more solutions per drill site'. Product lines: Drilling Optimisation, Structural Solutions, Navigation and Geophysics.
Breadcrumb title with 'Capture' enlarged and underlined in teal. Four outlined pill tags for the product lines sit top-right. Three image cards have coloured titles (blue, orange, teal): a KruxLog app screen, an IMDEX ute at an open pit, and a gloved hand scanning core. A dashed timeline runs along the bottom with Today → Next → Share of wallet.
Analyse stage: faster, more consistent orebody knowledge from a common, growing data estate, through automated extraction, one connected rock view and AI-ready insight. Progression: today 'leading analytics by workflow', next 'one reusable orebody view', leading to stickiness: 'embedded in workflows'. Brands shown: ioGAS, Datarock Chip, Datarock Core, Earth Science Analytics, aiSIRIS and ALT.
Same template as the Capture slide, with 'Analyse' enlarged and a blue underline. A brand logo row sits top-right. Three cards show a chip-tray illustration with chart call-outs and two laptop mockups of analytics software, with a Today → Next → Stickiness timeline at the bottom.
Solve stage: lower-risk decisions where capital is on the line, across exploration & targeting, resource & development, and orebody-driven mine optimisation. Progression: today 'defined technical decisions', next 'more decisions, for longer', leading to duration: 'relevant beyond the rig'.
Same template, with 'Solve' enlarged and an orange underline. Three cards with blue, orange and teal titles show a prospectivity heat map, an open pit with a translucent 3D orebody overlay, and a multicoloured 3D domain point cloud. A dashed Today → Next → Duration timeline runs along the bottom.
Shows the IMDEX structural solution in practice. ACTx measures how the rock sits as it's drilled (Capture), combines it with imaging into one clear picture (Analyse), and helps plan the mine, keep it safe and blast better (Solve). That drives share of wallet (more capability), stickiness (embedded) and duration (beyond the rig) across the ACTx, LOGRx, Televiewer, WellCAD, HUB-IQ, ioGAS and Datarock Core products.
Split layout: navy left half with a vertical numbered three-step list (teal, grey-teal and orange circles joined by a dashed line). Three outlined outcome boxes are chained with chevrons, above two rows of product pills (ACTx filled teal). The right half is a full-height photo of a field technician in hi-vis handling an ACTx tool at a rig.
Under 'In practice', a flywheel runs from solving a customer problem to embedding in the workflow, connecting more data, supporting more decisions and delivering more value, all around a 'Deeper partnership' core.
Large two-tone headline (white then teal) on the left. On the right is a circular cycle diagram: a white central circle surrounded by five rounded pill nodes on a dashed ring, outlined in teal, grey-teal, navy and orange.
Under 'Data that keeps working', data serves three mine-life phases: in situ (understand the orebody), in motion (drill, blast, haul, process) and back in situ (recover, rehabilitate, close). Data is captured once and applied across more decisions, which drives duration: 'relevant for longer'.
Three photo cards in a row (exploration rig at sunrise, open-pit blast-hole drill, rehabilitated site with a worker holding a tablet), each with a navy caption panel and coloured left accent, linked by teal chevrons. Below is a matching row of pills, two white and the last blue ('Duration').
What it means for IMDEX: on average, platform-connected customers bring in about 2x revenue, and platform-enabled customers have more than 2x tenure. Share of wallet is $2.40 captured today, with $10–$18 of opportunity headroom for the future.
Three equal navy KPI cards with coloured top borders (teal, grey-teal, orange). Each has a title, a small caps label, a huge stat ('~2x revenue', '>2x tenure', '$2.40 → $10–$18' with the future figure in orange) and a supporting caption.
Closes the growth-strategy section by naming how progress will show up: share of wallet, recurring revenue, customer duration and lifecycle reach.
Three stacked large statement lines (white, teal, white) on the left. Below a dashed rule is a 2×2 grid of metric labels with coloured left bars (teal, grey-teal, orange, navy). A night-time aerial photo of a mine fades in on the right.
A repeat of the page 41 agenda/speaker roster, shown again before the case-study section. It lists the same nine presenters by section: Strategy, The Market Need, The Solution and The Delivery.
Identical to page 41: a tall lead-presenter portrait tile beside a 4×2 headshot grid with gradient name overlays, under a white title and teal subtitle.
Section divider for the customer case studies, presented by Erlend Olsø.
Branded divider template: IMDEX logo, three-line white title, presenter pill and headshot. A close-up of a gloved hand holding a sensor tool with a glowing green LED ring sits on the right, with giant vertical IMDEX lettering, a mesh texture and teal/amber circle accents.
Case study 1 is a mid-tier operator defining a high-grade gold resource in Europe, where no metre could be wasted. The resource starts 900m below surface, needs a 50 × 50m drill-hole grid, and must go from discovery to production in under 3 years.
Letter-spaced teal kicker and grey context line at the top. A large two-tone headline (white / teal) and three big stats with teal vertical bars sit in a row. A darkened photo of a drill rig, IMDEX container and core trays fills the right, framed by thin grid lines and a teal crosshair.
Capture ('right data, first time') used ACTx, OMNIx38, drilling fluids + SRU, DeviAligner, Televiewer, LOGRx and NOVAxG. Analyse ('geology read as it's drilled') used Wavelet Tessellation, ioGAS, HUB-IQ QA/QC and Datarock Core. Solve ('confident drilling calls') delivered programme optimisation, with Directional Core Drilling next. The engagement progressed from tools to drillers, to partnership with the owner, to 17 rigs on one standard, with DCD as the next stage.
Three navy cards with blue, teal and coral top bars and matching round icons (crosshair, nodes, check), joined by teal chevrons. A row of four pills sits underneath (two outlined, one teal-filled, one coral-filled). The background is a desert mesa landscape at dusk.
Customer value: the project is positioned for H1 2029 production, with confident targeting below 900m and fewer wasted metres. IMDEX value: revenue rose from $53 to $73 per metre, with 17 rigs on one IMDEX standard. Repeatable: a land → expand → standardise playbook now rolling out to other resource companies.
Three-column layout, each with a large round icon (teal hard hat, amber trend chart, coral refresh), a coloured letter-spaced label, a large white headline and a short caption, over the desert mesa background.
Case study 2 is a Tier 1 major at the feasibility stage of a South American copper-gold project. A billion-dollar ($Bn) capital decision and decades of mine life were about to be locked in, while the block-cave design was in question.
Same problem-slide template as case study 1: a teal kicker, a two-tone headline and three stat callouts with teal bars ('$Bn', 'Decades', 'Block cave?'). A dark underground tunnel photo with a lit vehicle and worker sits on the right.
Capture used 50 km of already-drilled core from a historical core photo archive. Analyse produced deposit-scale geotech data with the Datarock Core Geotech suite. Solve delivered a mining-method answer through a geotechnical domain model. IMDEX did it in ~6 weeks using existing data, against $20–30m+ and 12+ months to re-drill.
Three navy cards with blue, teal and coral top bars and round icons, joined by chevrons. Two wide teal pill bars at the bottom compare '~6 weeks' and '$20-30m+' with 'vs' between them. The background is a desert mesa landscape.
Customer value: the mining method was changed before capital was locked in, with no new drilling. IMDEX value: high-margin platform revenue that opened the door to the owner's global portfolio. Repeatable: every major has a core archive, so the approach is capital-light and delivered in weeks, not years.
Same three-column takeaway template as case study 1: teal hard-hat, amber chart and coral refresh icons, letter-spaced coloured labels, large white headlines and short captions over the desert background.
Case study 1 shows workflow expansion driving share of wallet, and case study 2 shows decision impact driving stickiness plus new revenue. Both feed one flywheel: more workflow → more decisions → deeper adoption → repeatable growth.
Two large outlined navy panels side by side (a teal-accented layers icon for case 1, a coral target icon for case 2). Below them a row of four pills is linked by teal chevrons, ending in a filled amber 'Repeatable growth' pill. The background is a desert landscape.
Section slide opening an audience Q&A session hosted by presenter Paul House (Managing Director and CEO). It closes the earlier block of presentations before the agenda is shown again.
Full-bleed photo of a smiling worker in safety glasses and a hi-vis vest, overlaid with a navy gradient on the left. Large white 'Audience Q&A' title at top left, a square presenter headshot with a 'Presenter' pill label and name below, and a giant vertical white IMDEX wordmark with a triangular lattice pattern down the right edge.
Repeated agenda slide listing the nine presenters and their topics under the theme 'Better customer decisions support deeper adoption, higher-quality growth and sustainable shareholder returns'. Paul House (Strategy); Paul Mitchell and Dave Lawie (The Market Need); Michelle Carey, Shaun Southwell and Erlend Olsø (The Solution); Antonio Sardo, Tom Carmichael and Linda Lim (The Delivery).
Dark navy background with a white title and teal subtitle at top left. Below is a photo grid: one tall portrait of Paul House on the left and two rows of four headshot tiles on the right. Each tile fades to navy at the bottom, where the name, a teal section label and the talk topic sit.
Section divider opening Antonio Sardo's talk on how IMDEX compounds commercial value across its core exploration market and adjacent markets.
Full-bleed aerial photo of a turquoise mine pit lake with a floating dredge and conveyors, under a navy overlay on the left. White two-line title at top left, presenter headshot with 'Presenter' pill, and a vertical IMDEX wordmark with a lattice pattern on the right.
The drilling contractor (pays for rig productivity site by site) and the resource company (pays for decision confidence, increasingly at head office) meet at the drill site and form 'one IMDEX account'. A four-step compounding loop runs Sites and meters → Data captured → Decisions made → More sites and more metres. Against 3 years ago: 22% more sites serviced, 23% more HUB-IQ-enabled tools, and 56% more sites using 5 or more IMDEX products (from 89 to 139).
A white arrow-shaped band runs across the middle. On its left are two stacked photo cards (drilling contractor, resource company) linked by dashed lines to a 'Drill Site' photo card; on its right are four numbered photo cards (/01-/04) under a dashed 'A compounding loop' label. Below, an 'one IMDEX account' logo lockup sits beside three KPI rows, each with a teal up-arrow and a large percentage, separated by thin rules.
Mining exploration, where IMDEX plays today, was a US$12.4bn market in 2025, and IMDEX's role there is reducing geological uncertainty to speed up discovery and resource definition. A bar chart shows S&P exploration budgets from 2009 to 2025, peaking around US$20bn in 2012 and falling to about US$7bn in 2016, then a projected 2035 bar of about US$23bn. An arrow marks the ~6% p.a. growth, based on the 2016-2025 10-year CAGR with CY25 as the starting point.
Left: a dark teal text panel with the 'Mining Exploration' heading in teal, a white rule, the 'US$12.4bn in 2025' figure and a descriptor. Right: a vertical bar chart (y-axis 0-24, US$bn) in mid-blue for 2009-2025 and a lighter blue 2035 projection bar, with a grey trend arrow and a '~6% p.a.' pill label. Source footnotes at the bottom.
Three adjacent markets sized for 2025: Mining Production US$0.4tn (extending orebody knowledge from defining the resource to optimising its extraction), Infrastructure & Construction US$13.6tn (reducing geological uncertainty where infrastructure is built), and Utilities & Energy US$2.0tn (positioning IMDEX upstream of energy generation, electrification, oil & gas and AI). The takeaway: where subsurface uncertainty influences major capital and operational decisions, IMDEX has a reason to play.
Three equal dark-teal cards side by side, each with a teal heading, a thin divider, a bold white market-size figure with a footnote number, and a short descriptor. A one-line conclusion runs across the bottom, followed by three italic source footnotes (S&P Capital IQ Pro, GlobalData).
IMDEX's market intelligence puts potential demand growth to 2035 at 29% in Mining Production, 34% in Infrastructure Construction and 48% in the Energy Sector, each listed with its drivers: critical-mineral demand, larger project scale, grid expansion, AI data centres and others. Growth is to come from a combination of organic extensions and acquisitions, with IMDEX's Capture / Analyse / Solve capabilities letting it become a relevant advisor in adjacent markets.
A faint left sidebar lists Capture, Analyse and Solve with small rock and sensor icons. The main area is a dashed-outline 'Market Opportunity' box with three columns, each holding a teal heading, a large percentage with a 'Potential growth demand to 2035' label, a white underline and a 'Sustained by' bullet list. A teal banner along the bottom of the box carries the organic-plus-acquisitions message; a summary sentence and source note sit below.
A matrix of IMDEX credentials across four markets with 2025 global spend. Mining Exploration (~$12.4bn): ~1,500 sites serviced, ~2,800 customers and 350,000+ holes surveyed since FY23. Mining Production (~$400bn): 58 deployed sites, 125 customers and 52,000+ blast holes logged. Infrastructure Construction (~$13,600bn): ~10% of IMDEX revenue pa, ~1,800 customers, 36 countries over 15 years. Energy Sector (~$2,000bn): 40,000+ O&G wells processed, 47 customers, 17 countries over 10 years.
A four-column table of coloured blocks (mid blue, dark teal, navy blue, darkest navy), with row labels on the left ('Global spend [2025]' and an IMDEX 'Credentials' logo). Dashed horizontal dividers separate the large figures into rows. Small logos of IMDEX, Krux and acquired businesses carry customer-share splits (for example 30% / 48% / 22% in Infrastructure). A bottom conclusion line and four source footnotes follow.
Case study of a Tier 1 resource company at an underground production mine in a major mining region. The customer needed geophysical data to optimise the drill and blast process by better understanding ore position and grade. IMDEX OMNIxBOLT plus a Mount Sopris geophysical sensor equals a novel solution.
A letter-spaced teal kicker line sits above a large two-line title. Below, three photos are arranged as a visual equation: the OMNIxBOLT tool, a '+' sign, the yellow Mount Sopris winch unit and probe, an '=' sign, and underground miners in orange hi-vis. A 'Customer need' block with a teal left bar sits at the bottom.
Summary of the commercial-value section in four points. 01: more value from every site and metre drilled in a growing exploration market. 02: transferable capabilities provide the right to play and a credible growth path beyond minerals exploration. 03: growing demand in adjacent markets provides significant commercial growth opportunities. 04: existing and acquired capabilities combine to create novel solutions that accelerate growth.
Background aerial photo of a straight road through misty forest, fading into navy on the left. White title at top left; four numbered statements (01-04) stacked in rows below and separated by thin horizontal rules.
Repeated agenda slide, identical to page 66: nine presenters and their Strategy / Market Need / Solution / Delivery topics. Shown here as the transition into Tom Carmichael's 'knowledge advantage' section.
Dark navy background with title and teal subtitle at top left, one tall portrait of Paul House on the left and two rows of four headshot tiles. Each tile has a name, a teal section label and the topic over a gradient fade.
Section divider for Tom Carmichael's presentation on how IMDEX's people and technology build the industry's knowledge advantage.
Full-bleed photo of IMDEX staff in branded polos presenting downhole tools on a table, with a navy overlay on the left. Three-line white title at top left, presenter headshot with 'Presenter' pill, and a vertical IMDEX wordmark with a lattice pattern on the right.
Customers need experienced people to do more with the information available today. Drilling and site teams provide experienced crews, safe productive execution and practical support when conditions change. Project teams of geologists and technical specialists interpret complex information and deliver knowledge in time for the next decision. The opportunity is to make scarce expertise more productive at the point of decision.
Navy background with a faint topographic mountain texture on the right and a teal corner bracket. Title and teal subtitle at top left. Two light panels side by side, each with a narrow photo strip on its left (a drill rig, then colourful 3D drill-hole traces), a large blue heading and three lines of text. A teal 'The opportunity' line sits at the bottom.
Complementary expertise turns technology into a useful customer solution through four teams. /1 Drilling & field: understand operating conditions and support safe, productive work. /2 Engineering & Digital: build reliable instruments, software and analysis tools. /3 Technical advisory: give the information meaning and connect it to a decision. /4 Customer facing teams: help customers use and get value from IMDEX technology.
Navy background with a faded hi-vis worker photo. Title and teal subtitle at top left. Four light cards in a row, each with a colour-coded top border and heading (blue, teal, coral, gold), a number, a short description, and a photo below: field crew, a rugged tablet, an analyst, and a trade-show conversation.
Specialist knowledge can be applied consistently across customer workflows. /1 Instruments and software put specialist customer knowledge to work. /2 Focused applications address specific customer problems. /3 Our people's knowledge can be applied across more customers, sites and markets.
Dark blue background with an abstract swirling texture and a teal corner bracket. Title and teal subtitle at top left; three equal light cards in a row with colour-coded top borders and text (blue, teal, coral), numbered /1 to /3.
Good decisions depend on reliable measurements and sound interpretation, set out in four steps. /1 Get the measurement right: reliable tools, correct usage and quality checks. /2 Preserve its meaning: where, when and how it was captured. /3 Test the interpretation: experts check results against geological and operational context. /4 Know when to act: explain what the evidence supports and know what remains uncertain.
Navy background with a faint mountain wireframe texture and a teal corner bracket. Title and teal subtitle at top left; four equal light cards in a row along the lower half, each with a number, a dark teal heading and a short description.
Demonstrated benefit gives customers reasons to adopt more technology. Drilling contractors get safer, more productive and predictable work; resource companies get a clearer understanding of the ground and better-informed project decisions. For IMDEX this means more solutions per site and a greater share of wallet.
Navy background with title and teal subtitle at top left and a teal corner bracket. Three equal photo tiles in a row (an underground drill rig operator, an engineer at a monitor, aerial green terrain with a white IMDEX logo), each with a white heading and two lines of caption over a dark gradient at the bottom.
Repeated agenda slide, identical to pages 66 and 75, listing the nine presenters and their topics. It introduces the final Delivery section on capital management by Linda Lim (CFO).
Dark navy background with title and teal subtitle, one tall portrait of Paul House on the left and two rows of four headshot tiles with names, teal section labels and topics.
Section divider for Linda Lim's capital management presentation covering investment, margins, cash generation, leverage, dividends and M&A.
Full-bleed aerial photo of red-earth terrain under a heavy navy overlay. White title at top left, presenter headshot with 'Presenter' pill, and a vertical IMDEX wordmark with a lattice pattern on the right.
IMDEX's capital management framework. Organic and innovation-led growth (R&D investment ~10% of revenue), operating efficiency and capital productivity generate net operating cash flow. That cash first maintains a strong balance sheet (target leverage 1.0-1.5x, with the ability to go above it for a short period for strategic M&A) and funds sustainable dividends (25% to 35% payout ratio of NPATA). Excess cash flow then goes to business investment, disciplined M&A and capital management, all to maximise shareholder value and returns.
Top-down flow diagram on a dark background. Three teal rounded boxes at the top feed a pale funnel-shaped chevron labelled 'Net Operating Cash Flow', then two full-width dark navy pill bars (balance sheet, dividends), a second chevron ('Excess Cash Flow'), three dark boxes, and finally a teal double-headed arrow banner reading 'Maximise Shareholder Value and Returns'. A leverage footnote sits at the bottom left.
Two coordinated mechanisms build the connected offering. R&D maintains technical leadership: new technologies reinforce leadership and move customers from products to solutions. M&A accelerates capabilities, customers and markets: acquired technologies and channels broaden reach from drillers to geoscientists, resource companies and new markets. Both feed the Capture / Analyse / Solve value chain.
Left column: a large white headline and a teal sub-statement at the bottom left. Right: two white header boxes (R&D, M&A) with blue down-arrows into outlined description boxes, which converge through a large chevron into a dark band showing Capture → Analyse → Solve with small rock and point-cloud icons and teal captions.
R&D investment rose steadily from $33m in FY22 to $36m, $37m, $41m and $43m in FY26, at 8-10% of revenue and sustained through the cycle. Capital expenditure went $38m, $27m, $34m, $57m and $69m (FY22-FY26), at ~10-15% of revenue for capital-efficient scaling. Outlook points: innovation through the cycle, capital efficiency, and moving from building to scaling through the global network.
Three-column layout. Left: a teal vertical bar chart of R&D ($m) with a KPI box below ('8-10%'). Middle: a blue vertical bar chart of capex ($m) with a KPI box below ('~10-15%'). Right: a teal-outlined 'What this means for our future' panel with three bold headings, each marked by a teal vertical bar.
Normalised EBITDA margin rose from 18% in FY17 to 31% in FY26. Revenue grew at a ~13% CAGR ($176m to $520m) and normalised EBITDA at a ~20% CAGR ($32m to $163m) over FY17-FY26. The FY26 incremental EBITDA margin was ~40%, meaning each additional revenue dollar delivered ~40 cents of EBITDA. Platform revenue is now 47% of Group revenue.
Left: a two-bar teal chart (FY17 18%, FY26 31%). Centre: two stacked KPI boxes with large teal CAGR figures, plus a wide KPI strip below for '~40%'. Right: a teal-outlined 'What this means for our future' panel with three headings (revenue mix, operating leverage, acquisition scaling).
Normalised cash conversion rose from 66% in FY17 to 83% in FY26. FY26 normalised operating cash flow was a record $135m, and revenue growth of +21% was supported by working capital investment. Operating cash flow funds R&D, capex and dividends, with acquisitions funded from cash and existing facilities.
Same template as the previous financial slides. Left: a two-bar teal cash-conversion chart (66% → 83%). Centre: KPI boxes for '$135m' and '+21%' and a wide 'Funds growth and returns' strip. Right: a teal-outlined 'What this means for our future' panel with three headings. A definition footnote sits at the bottom.
Leverage moved 0.5x (FY23), 0.3x (FY24), 0.1x (FY25) and 1.3x (FY26), against a 1.0-1.5x pre-IFRS 16 target range. Five businesses were acquired in FY26, funded from cash and existing facilities, leaving FY26 leverage at 1.3x after an active M&A year. Rising EBITDA and cash generation are expected to bring leverage down; the range is a guardrail that may be exceeded for strategic M&A with a clear de-leveraging pathway.
Left: a teal line chart of leverage FY23-FY26 with dashed horizontal lines marking the 1.0x and 1.5x band and data labels at each point. Centre: KPI boxes for '1.0-1.5x' and '5' and a wide '1.3x' strip. Right: a teal-outlined 'What this means for our future' panel with three headings.
Dividend per share was 2.8cps in FY24, 2.5cps in FY25 and 3.4cps in FY26 (fully franked, up ~36%). The FY26 payout was 30% of normalised NPAT, maintained through an acquisition year. From FY27 a refreshed policy targets a 25-35% payout of NPATA (NPAT normalised before amortisation of acquired intangibles).
Left: a three-bar teal chart of dividend per share (cps). Centre: KPI boxes for '30%' and '25-35%' and a wide '3.4cps' strip. Right: a teal-outlined 'What this means for our future' panel with three headings (earnings participation, NPATA basis, balanced with investment). NPATA definition footnote at the bottom.
FY26 M&A: Earth Science Analytics (Aug 2025, 80.5%, AI-driven EarthNET platform, Analyse); ALT and MSI (Feb-Mar 2026, 100%, downhole sensors and WellCAD software, Capture/Analyse); Datarock (Feb 2026, 51% → 100%, AI core imagery analytics, Analyse/Solve); Krux Analytics (Apr 2026, 40% → 100%, real-time drilling analytics, Capture), adding ~200 FTE in total. ~$180m cash was invested in five businesses (four transactions), adding ~$51m of annualised revenue, with leverage of 1.3x at 30 June within the 1.0-1.5x target. The M&A test has four parts: technical fit, market leadership, scale and discipline.
Upper left: a six-column table with a teal header row (Business, Completed, Stake, What it adds, Fits, FTE) and dark navy rows, with a merged FTE cell. Upper right: three stacked KPI boxes (~$180m, ~$51m, 1.3x). Below: an 'Our M&A test' heading and four solid blue tiles in a row. Footnote at the bottom.
Capital allocation scorecard. 1 Invest in the business: $43m R&D, $69m capex and five acquisitions in FY26; next, scale and sustain R&D. 2 Grow earnings and margin: 31% EBITDA margin and 83% cash conversion. 3 Strong balance sheet: 1.3x leverage after five acquisitions. 4 Sustainable dividends: 3.4cps at a 30% payout, moving to 25-35% of NPATA. 5 Surplus capital: deployed into strategic M&A, with integration first.
A full-width three-column table (Priority / What we delivered (FY26) / What comes next) with a teal header row and five dark navy rows separated by thin lines. Bold numbered priorities in the first column and teal text in the 'What comes next' column. Small teal kicker 'Capital allocation' above the two-line title.
Section divider for the closing remarks by Managing Director and CEO Paul House.
Full-bleed macro photo of mineral-rich rock in teal, rust and purple tones, with a navy overlay on the left. White title at top left, presenter headshot with 'Presenter' pill, and a vertical IMDEX wordmark with a lattice pattern on the right.
Four closing messages: the industry challenge is growing, as minerals demand comes from a wider group of participants; IMDEX will continue to control its own destiny, with growth driven by execution and increasingly decoupled from the exploration cycle; larger earth-science end-markets are attractive, with the technology stack applicable and early-stage entry established; and IMDEX's competitive edge is that its people, culture and global network give its platform and technologies the number one leadership position.
Dark navy background with a teal 'Closing remarks' kicker and white title at top left. Four equal dark-teal outlined cards in a row, each with a large bold teal heading and white body text below.
Repeated Q&A slide, identical to page 65: the final audience Q&A with presenter Paul House, closing the Investor Strategy Day deck.
Full-bleed photo of a worker in safety glasses and a hi-vis vest with a navy overlay on the left. Large white 'Audience Q&A' title, presenter headshot with 'Presenter' pill, and a vertical IMDEX wordmark with a lattice pattern on the right.
Common questions about this slide and the underlying presentation content.
It is the 95-slide deck IMDEX Limited presented to investors in Sydney on 26 October 2026 and lodged with the ASX as the "IMD Investor Strategy Day Presentation". It runs from the company's vision and Capture / Analyse / Solve strategy through an EY industry risk view, geoscience economics, customer growth strategy, case studies, market expansion, people and capital management to closing remarks.
The agenda on slide 4 lists Paul House (introduction, Q&A and closing remarks), Paul Mitchell of EY (top risks and opportunities for mining and metals), Dave Lawie (industry update: variability as the cost of not knowing), Shaun Southwell and Michelle Carey (growth strategy by customer), Erlend Olsø (technology and customer value case study), Antonio Sardo (how IMDEX compounds commercial value), Tom Carmichael (building the industry's knowledge advantage) and Linda Lim (capital management).
Revenue grew from A$176m in FY17 to A$520m in FY26 (about 3.0x, ~13% CAGR) and normalised EBITDA from A$32m to A$163m (about 5.1x), lifting the margin from 18% to 31%. FY26 normalised operating cash flow was a record A$135m with 83% cash conversion, leverage was 1.3x after about A$180m was invested in five businesses, and the full-year dividend was 3.4 cents per share, fully franked. All amounts are Australian dollars.
IMDEX reports on the Australian fiscal year, which starts in July. FY26 covers July 2025 to June 2026, so the FY26 figures in this deck relate to the year ended 30 June 2026.
Slide 91 lists the FY26 deals: Earth Science Analytics (80.5%, AI-driven EarthNET platform), ALT and MSI (100%, downhole sensors and WellCAD software), Datarock (51% to 100%, AI core imagery analytics) and Krux Analytics (40% to 100%, real-time drilling analytics), together about A$51m of annualised revenue acquired.
No. This gallery entry provides the original PDF lodged with the ASX plus page images. The source file was too large to convert, so there is no PPTX download. You can use its structure and layouts as a reference when building your own investor day deck in 2Slides.
Dark navy backgrounds with teal headings and accents, full-bleed aerial mine photography, a large vertical IMDEX wordmark over a triangular mesh on section dividers, speaker headshot dividers, KPI boxes and teal bar charts. The guest EY section uses EY's own black and yellow styling.
The presentation was released through the ASX market announcements platform under IMDEX's code and is also available from the investors section of the IMDEX website.
Company investor relations page with ASX announcements and presentations
ASX listing page for IMDEX with market announcements

Create Your Own Slides
Turn your ideas into professional presentations in seconds with 2slides AI.
Reference professional designs, choose your style, and generate slides with perfect text rendering. Powered by Nano Banana—start creating your presentation now.
Your AI Agent for slides. Save time, shine faster with intelligent presentation creation.


© 2026 2slides. All rights reserved.