
Part of Investor presentation examples
Westgold Resources September 2026 Quarterly Webcast presentation: the Western Australian gold miner's Q1 FY27 results (July–September 2026), lodged with the ASX and dated 21 October 2026. All amounts are in Australian dollars (A$) unless stated. The quarter delivered 98.4koz of gold at an AISC of A$2,912/oz, a A$251M underlying treasury build, and A$1,040M in cash, bullion and liquid investments, with the company debt free and unhedged.
Uses this deck’s cover as a style reference for slides made from your own content. Or pick any page below to use its layout as the reference.
Quick Navigation
Tags
Share the slides
Westgold Resources September 2026 Quarterly Webcast presentation: the Western Australian gold miner's Q1 FY27 results (July–September 2026), lodged with the ASX and dated 21 October 2026. All amounts are in Australian dollars (A$) unless stated. The quarter delivered 98.4koz of gold at an AISC of A$2,912/oz, a A$251M underlying treasury build, and A$1,040M in cash, bullion and liquid investments, with the company debt free and unhedged.
Detailed view of each slide page, including layout, key content and visual elements.
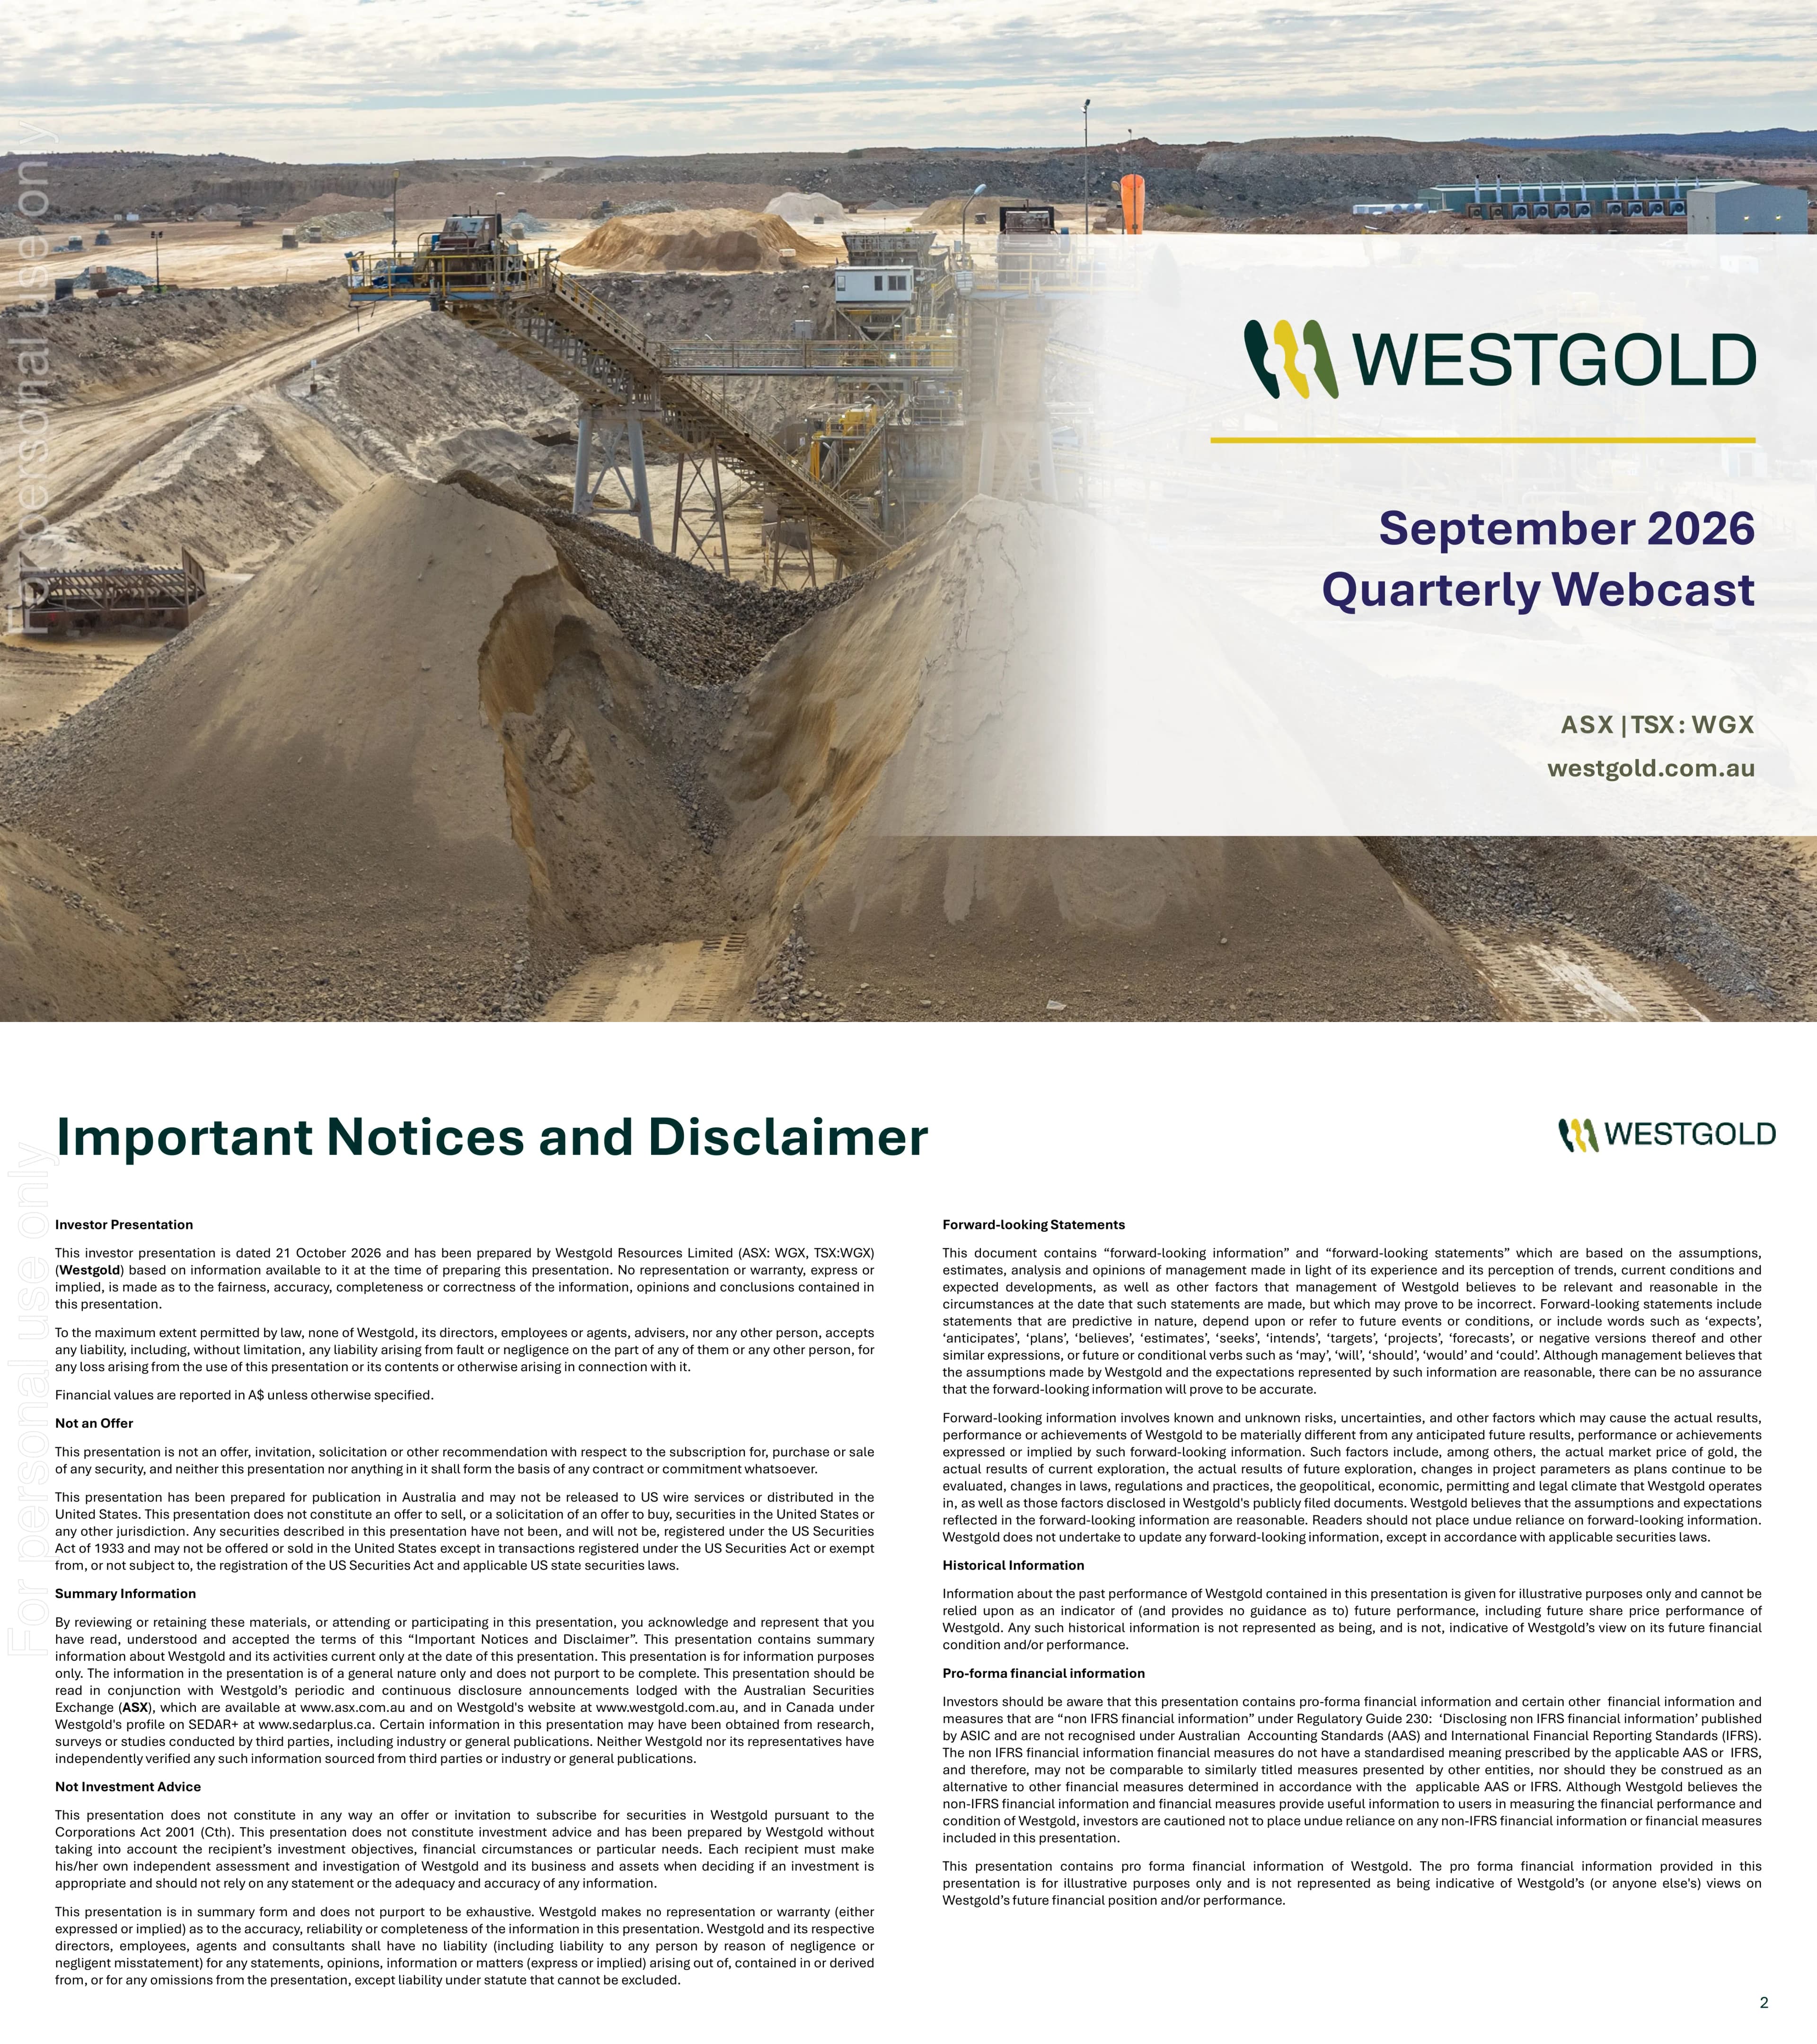
Cover slide with the Westgold logo, the title 'September 2026 Quarterly Webcast', the ASX | TSX: WGX listing and westgold.com.au.
Full-bleed photograph of a processing plant conveyor and ore stockpiles, with a translucent white panel on the right holding the logo, a gold divider line and right-aligned navy title text.
Legal notices stating the presentation is dated 21 October 2026, financial values are in A$ unless specified, and covering not an offer, summary information, not investment advice, forward-looking statements, historical information and non-IFRS pro-forma financial information.
Two-column dense legal text under a large dark green headline with the logo top right.
Ore Reserves and Mineral Resources notices referencing the 20 August 2026 ASX announcement, Competent Person / Qualified Person statements (Jake Russell, Leigh Devlin) under JORC 2012 and NI 43-101, investment risk, effect of rounding and general disclaimer.
Two-column small-type legal text matching page 2.
Safety: no lost time injuries, LTIFR down to 1.17 (Q4 FY26: 1.58). Headline cards: 98.4koz gold at AISC A$2,912/oz; A$251M underlying treasury build with A$292M mine operating cash flow; A$1,040M cash, bullion and liquid investments (up A$101M, debt free and unhedged); 4.1Moz Ore Reserves (up 41%, including 1.1Moz maiden Fletcher reserve). Columns on delivering (on track for FY27 guidance of 385–425koz at A$2,980–3,380/oz; HG stockpiles up 51% to 696kt; Beta Hunt record 2Mtpa rate), generating cash (AISC margin A$3,117/oz; A$1,640M liquidity incl. undrawn A$600M facility), growing (~500kozpa by FY29; 25 drill rigs) and rewarding shareholders (A$122M FY26 capital returns; A$22M Q1 buy-backs; new minimum 3cps annual return policy).
Yellow 'Safety' pill banner, a row of four dark green stat cards with large gold numbers, then four bullet columns with olive left rules, footnotes at the bottom.
Comparison table: production 98,393oz in Q1 FY27 vs 98,854oz in Q4 FY26 and 387,354oz in FY26, against FY27 guidance of 385,000–425,000oz; AISC A$2,912/oz (Q4 FY26 A$2,802; FY26 A$2,841; guidance A$2,980–3,380); non-sustaining capital A$111M (guidance A$450–480M); exploration A$24M (guidance A$50–75M).
Full-width table with greyed prior-period columns, a sage-highlighted Q1 FY27 column and a copper-headed yellow FY27 guidance column.
4 operating processing hubs with 5.7Mtpa capacity rising to >7Mtpa by FY29 via Cue (FY27) and Meekatharra (FY28) expansions; ~500kozpa by FY29 with a fully funded Three-Year Outlook of 460–510koz at AISC A$2,640–3,000/oz; >600kozpa pathway as the Fletcher Zone at Beta Hunt could add ~140kozpa (not in the 3YO). Outlook strip: FY26 actual 387koz at A$2,841/oz; FY27 guidance 385–425koz at A$2,980–3,380/oz; FY28 425–470koz at A$3,000–3,400/oz; FY29 460–510koz at A$2,640–3,000/oz.
Three large dark green panels with oversized gold numerals 4, 5, 6, above a cream timeline strip of four outlook columns separated by vertical rules.
Section divider introducing the operational results section.
Top half photograph of a loaded underground haul truck, colour-block accent bar, large dark green section title on a cream background, logo and page number bottom right.
Subtitle: Murchison operations maintain output; Beta Hunt delivers consecutive records. Five quarterly bar charts (Q2 FY26 to Q1 FY27): ore mined 1.19, 1.15, 1.33, 1.42Mt (up 7%); mined grade 2.4, 2.2, 2.1, 2.2g/t; ore processed 1.53, 1.48, 1.47, 1.46Mt; milled grade 2.4, 2.1, 2.3, 2.3g/t; gold produced 111.4, 93.1, 98.9, 98.4koz, with 402koz produced over the last four quarters.
Five side-by-side mini bar charts with the latest quarter in darker green, each with a commentary bullet below behind a green arrow marker.
Flow of mined 1,421kt at 2.2g/t (up 7%), stockpiled 696kt high-grade ore (up 51%, about 6 weeks of mill feed; 310kt mill ROM and crushed stock up 69%), processed 1,461kt in line with Q4 despite more planned downtime. Stockpiles provide resilience to wet weather, planned maintenance and mine interruptions; growing ore inventories support higher production and lower unit costs as Cue and Meekatharra expand.
Three icon-headed process boxes (sage, dark green, olive) linked by yellow arrows, three cream benefit cards below, and a dark green banner with a gold takeaway sentence.
Quarterly gold produced and milled grade for four hubs. Fortnum (0.9Mtpa): 21,840, 16,175, 18,135, 17,060oz at 3.1, 2.4, 2.7, 2.5g/t. Meekatharra/Bluebird (1.8Mtpa): 40,730, 31,394, 37,743, 35,873oz at 2.2–2.6g/t. Cue/Tuckabianna (1.4Mtpa): 18,364, 16,563, 18,218, 18,958oz at 1.8–2.0g/t. Higginsville (1.6Mtpa, incl. Lakewood toll treatment): 30,484, 29,013, 24,758, 26,502oz at 2.0–2.3g/t. Each hub lists its ore feed sources.
Four-column grid: hub name and mill capacity, plant photo, feed sources, and a combo bar-and-line chart per hub, with a shared legend.
Long-section of the Bluebird – South Junction – Polar Star system showing mineralised zones, previously mined areas and planned mining, open at depth and to the south. Callouts note historical production of +400koz from South Junction open pit and +600koz from Bluebird open pit; an inset highlights available mining fronts in Q2 FY27.
Technical mine long-section on a sky-to-cream gradient, with a dashed-outline zoom inset on the left, yellow callout labels, legend box and 1000m scale bar.
Bar chart of Beta Hunt mining rate from 0.8Mtpa in FY21 under prior ownership to a record annualised 2.0Mtpa in September 2026 (Jul-26 1.4, Aug-26 1.7). Side panel: 2.0Mtpa record month, up from about 1.4Mtpa under prior ownership; A$33.3M infrastructure investment over two years (ventilation, dewatering, water supply, power); sustained 2Mtpa targeted in Q2 FY27 with interim ventilation commissioned ahead of schedule. Next: Fletcher drilling and Southern Goldfields expansion studies due Q3 FY27.
Left bar chart with grey prior-ownership bars, green Westgold-era bars and a dark record-month bar; right dark green panel with three stacked gold stats; yellow 'Next' banner at bottom.
Section divider introducing the financial results section.
Top-half photo of processing plant conveyors against a blue sky, accent colour bar and large section title on cream.
Five quarterly charts (Q2 FY26 to Q1 FY27): gold sold 115.2, 69.9, 110.3, 99.9koz (A$602M Q1 revenue); realised gold price A$6,356, 7,080, 6,391, 6,029/oz (fully unhedged); AISC A$2,902, 2,931, 2,802, 2,912/oz (higher waste movement, maintenance, labour and Lakewood toll milling); net mine cash flow A$265M, 254M, 159M, 157M after A$111M non-sustaining capital and A$24M exploration; closing cash, bullion and investments A$654M, 856M, 939M, 1,040M. Debt free with A$1.6B liquidity.
Five mini bar charts with the latest quarter highlighted, each with arrow-bullet commentary underneath, mirroring page 8.
Waterfall of treasury movement from A$939M opening cash, bullion and investments to A$1,040M closing (+A$101M): Murchison operating cash flow 209, Southern Goldfields 57, sustaining capital (23), stockpiles (49), working capital 60, growth capital (64), PP&E (47), exploration (24), tax (41) to closing operating cash 745; share buy-back (20) and asset sale proceeds 5 to closing cash 730, plus bullion 98 and investments 212.
Wide waterfall chart with yellow balance bars, teal inflows and orange outflows, bracket groupings for operating, working capital and non-sustaining capex, and a '+$101M' callout spanning the chart.
Stacked bar chart of shareholder capital returns: A$10M FY24, A$28M FY25 (+175%), A$122M FY26 (+329%; A$95M dividends plus A$27M buy-backs) and A$22M FY27 buy-backs to date with dividend TBD. FY26 10.0cps fully franked dividend is 400% above the 2.0cps minimum, A$95M or 16% of FY26 free cash flow of A$602M. A$50M on-market buy-back approved for FY27, A$22.3M completed at an average A$5.46/share, running 11 Sep 2026 – 10 Sep 2027.
Left stacked bar chart with growth-percentage callout pills and a dashed minimum-dividend line; right cream info card and dark green buy-back card.
Section divider introducing the exploration section.
Top-half close-up photo of stacked drill rods, accent bar and large section title.
25 drill rigs: 18 underground diamond, 5 surface diamond and 2 surface RC. Maps of Murchison (Starlight, Bluebird, Big Bell, Great Fingall, Albury Heath; Fortnum 0.9Mtpa, Meekatharra 1.8Mtpa and Cue 1.4Mtpa hubs) and Southern Goldfields (Beta Hunt x7, Higginsville x1; Higginsville hub 1.6Mtpa) show rig allocations. Banner: building Reserve ounces at A$27/oz (1.5Moz gross reserves added in FY26).
Left horizontal bar chart of rig types with icons; two geological maps with rig-count callout boxes; dark green bottom banner.
Section divider introducing the valuation section.
Top-half photo of a gold-bearing quartz drill core held in a gloved hand, accent bar and section title.
Six reasons to invest: leading Australian gold producer (387koz FY26, Q1 FY27 98.4koz); all-Australian Tier 1 jurisdiction (4 hubs in WA, 5.7Mtpa rising to >7Mtpa); Westgold 4-5-6 fully funded (~500koz per annum by FY29, Fletcher pathway to >600kozpa); long-life assets (4.1Moz Ore Reserves, up 41%); strong balance sheet (A$1,040M cash, bullion and investments; A$1,640M liquidity); increasing shareholder returns (A$122M FY26; minimum 3cps; A$50M FY27 buy-back).
Left-third portrait photo of a miner; right two-thirds dark green panel with a 2x3 grid of icon, heading, large gold stat and caption.
EV/EBITDA (FY27e) for ASX gold peers: Capricorn 10.6x, Evolution 8.0x, Northern Star 7.9x, Ramelius 7.7x, Genesis 7.6x, Ora Banda 6.5x, Greatland 5.8x, Bellevue 5.3x, Westgold 3.3x, Regis 3.2x, Pantoro 3.0x, Catalyst 2.8x. Westgold is flagged as a 'highly attractive value proposition'. Source: S&P Visible Alpha, market caps as at 19 October 2026 from FactSet; Vault Minerals excluded due to takeover.
Single sorted bar chart with sage bars, Westgold's bar in dark green with an arrow callout, peer logos along the x-axis.
Closing slide 'The time is now (ASX | TSX: WGX)' with investor relations contact Kasun Liyanaarachchi (Group Manager Investor Relations & Communications) and media contact Annette Ellis (Manager Corporate Affairs), plus www.westgold.com.au.
Top-half underground photo of three miners in hi-vis gear with contact details overlaid left and right, accent bar, large closing line on cream.
JORC Mineral Resources at 30 June 2026 for operating mines. Murchison total 59,552kt at 2.81g/t for 5,375koz (Big Bell UG 2,239koz, Bluebird Group UG 1,430koz, Starlight UG 966koz, Great Fingall UG 413koz). Southern Goldfields total 75,139kt at 2.25g/t for 5,443koz, led by Beta Hunt 74,605kt at 2.25g/t for 5,392koz. Beta Hunt nickel: 1,248kt at 2.8% Ni for 35kt Ni.
Three stacked dense tables with dark green headers, split into Measured, Indicated, Measured and Indicated, Inferred and Total column groups.
Mineral Resources at 30 June 2026 for non-operating assets. Murchison total 48,428kt at 1.76g/t for 2,733koz across Cue, Meekatharra and Fortnum districts (e.g. Paddy's Flat 630koz, Fortnum District 501koz, Yaloginda 467koz). Southern Goldfields total 10,699kt at 2.34g/t for 805koz (HGO Central 485koz, HGO Greater 279koz).
Two dense tables with vertical region labels (Cue, Meekatharra, Fortnum) on the left edge.
Ore Reserves at 30 June 2026 for operating mines. Murchison total 23,472kt at 2.49g/t for 1,882koz (Big Bell UG 783koz, Bluebird Group UG 519koz, Starlight UG 324koz, Great Fingall UG 208koz, Golden Crown UG 48koz). Southern Goldfields: Beta Hunt 21,674kt at 2.34g/t for 1,634koz.
Two tables with Proven, Probable and Total column groups.
Ore Reserves at 30 June 2026 for non-operating assets. Murchison total 8,820kt at 1.32g/t for 373koz (Tuckabianna stockpiles 91koz, Paddy's Flat 60koz, Fortnum District 58koz). Southern Goldfields total 2,909kt at 1.92g/t for 179koz (HGO Greater 80koz, HGO Central 58koz, HGO stockpiles 42koz).
Two tables with region labels on the left and Proven, Probable, Total column groups.
Peer valuation table behind page 21, in Australian dollars: market cap, enterprise value, FY27e EBITDA and EV/EBITDA for 12 ASX gold producers. Westgold: market cap A$4,921m, EV A$3,982m, FY27e EBITDA A$1,221m, 3.3x. Northern Star A$33,808m market cap at 7.9x; Evolution A$26,743m at 8.0x. Cash and debt from June 2026 quarterly reports; EBITDA from Visible Alpha.
Single clean table with a tan header row and light row dividers, with source columns in grey italics and a note below.
Common questions about this slide and the underlying presentation content.
It is Westgold's September 2026 Quarterly Webcast deck covering Q1 FY27 (July–September 2026): safety, production of 98.4koz at an AISC of A$2,912/oz, mining and hub performance, Beta Hunt's record 2.0Mtpa mining rate, cash generation and a A$251M underlying treasury build, shareholder returns, exploration, peer valuation and full Mineral Resource and Ore Reserve tables.
Westgold Resources (ASX | TSX: WGX) lodged it with the ASX in October 2026; the deck itself is dated 21 October 2026. It accompanies the company's September 2026 Quarterly Report.
All financial values are in Australian dollars (A$) unless otherwise specified, as stated in the deck's disclaimer. For example, cash, bullion and liquid investments of $1,040M means A$1,040 million.
Westgold uses the Australian fiscal year that starts in July. FY26 covers July 2025 to June 2026, and FY27 covers July 2026 to June 2027, so Q1 FY27 is the September 2026 quarter.
FY27 guidance is 385,000–425,000oz at an AISC of A$2,980–3,380/oz, with non-sustaining capital of A$450–480M and exploration of A$50–75M. The Three-Year Outlook targets 425–470koz in FY28 and 460–510koz in FY29, about 500koz per annum, with the Fletcher Zone as a possible pathway to more than 600kozpa.
Yes. Besides the original PDF, an editable PPTX is available. It was converted from the PDF rather than supplied by Westgold, so some charts and tables may come through as images or need minor layout fixes.
Page 4's four KPI cards, page 5's color-coded guidance table, the five-chart dashboards on pages 8 and 14, page 10's hub combo charts, page 15's treasury waterfall and page 21's peer EV/EBITDA bar chart are strong reusable patterns for resources-sector investor updates.
A dark forest green, olive, sage and gold-yellow palette on white and cream backgrounds, bold dark green headlines, large gold stat numerals on dark panels, and full-width photography of mine sites and workers on section dividers with a three-colour accent bar.
Official website listed on the deck's cover and closing slide.
Westgold's quarterly reports and the referenced FY27 guidance and resource/reserve announcements are lodged here.

Create Your Own Slides
Turn your ideas into professional presentations in seconds with 2slides AI.
Reference professional designs, choose your style, and generate slides with perfect text rendering. Powered by Nano Banana—start creating your presentation now.
Your AI Agent for slides. Save time, shine faster with intelligent presentation creation.


© 2026 2slides. All rights reserved.