
ESG collection
ESG presentation examples
Sustainability, climate and impact reports from companies such as Microsoft, Apple, BMW, Patagonia and Starbucks, published in a landscape slide format. Every slide is readable on the page before you download anything.
- Decks
- 17
- Slides
- 1,312
- Last added
- 2026-10-04
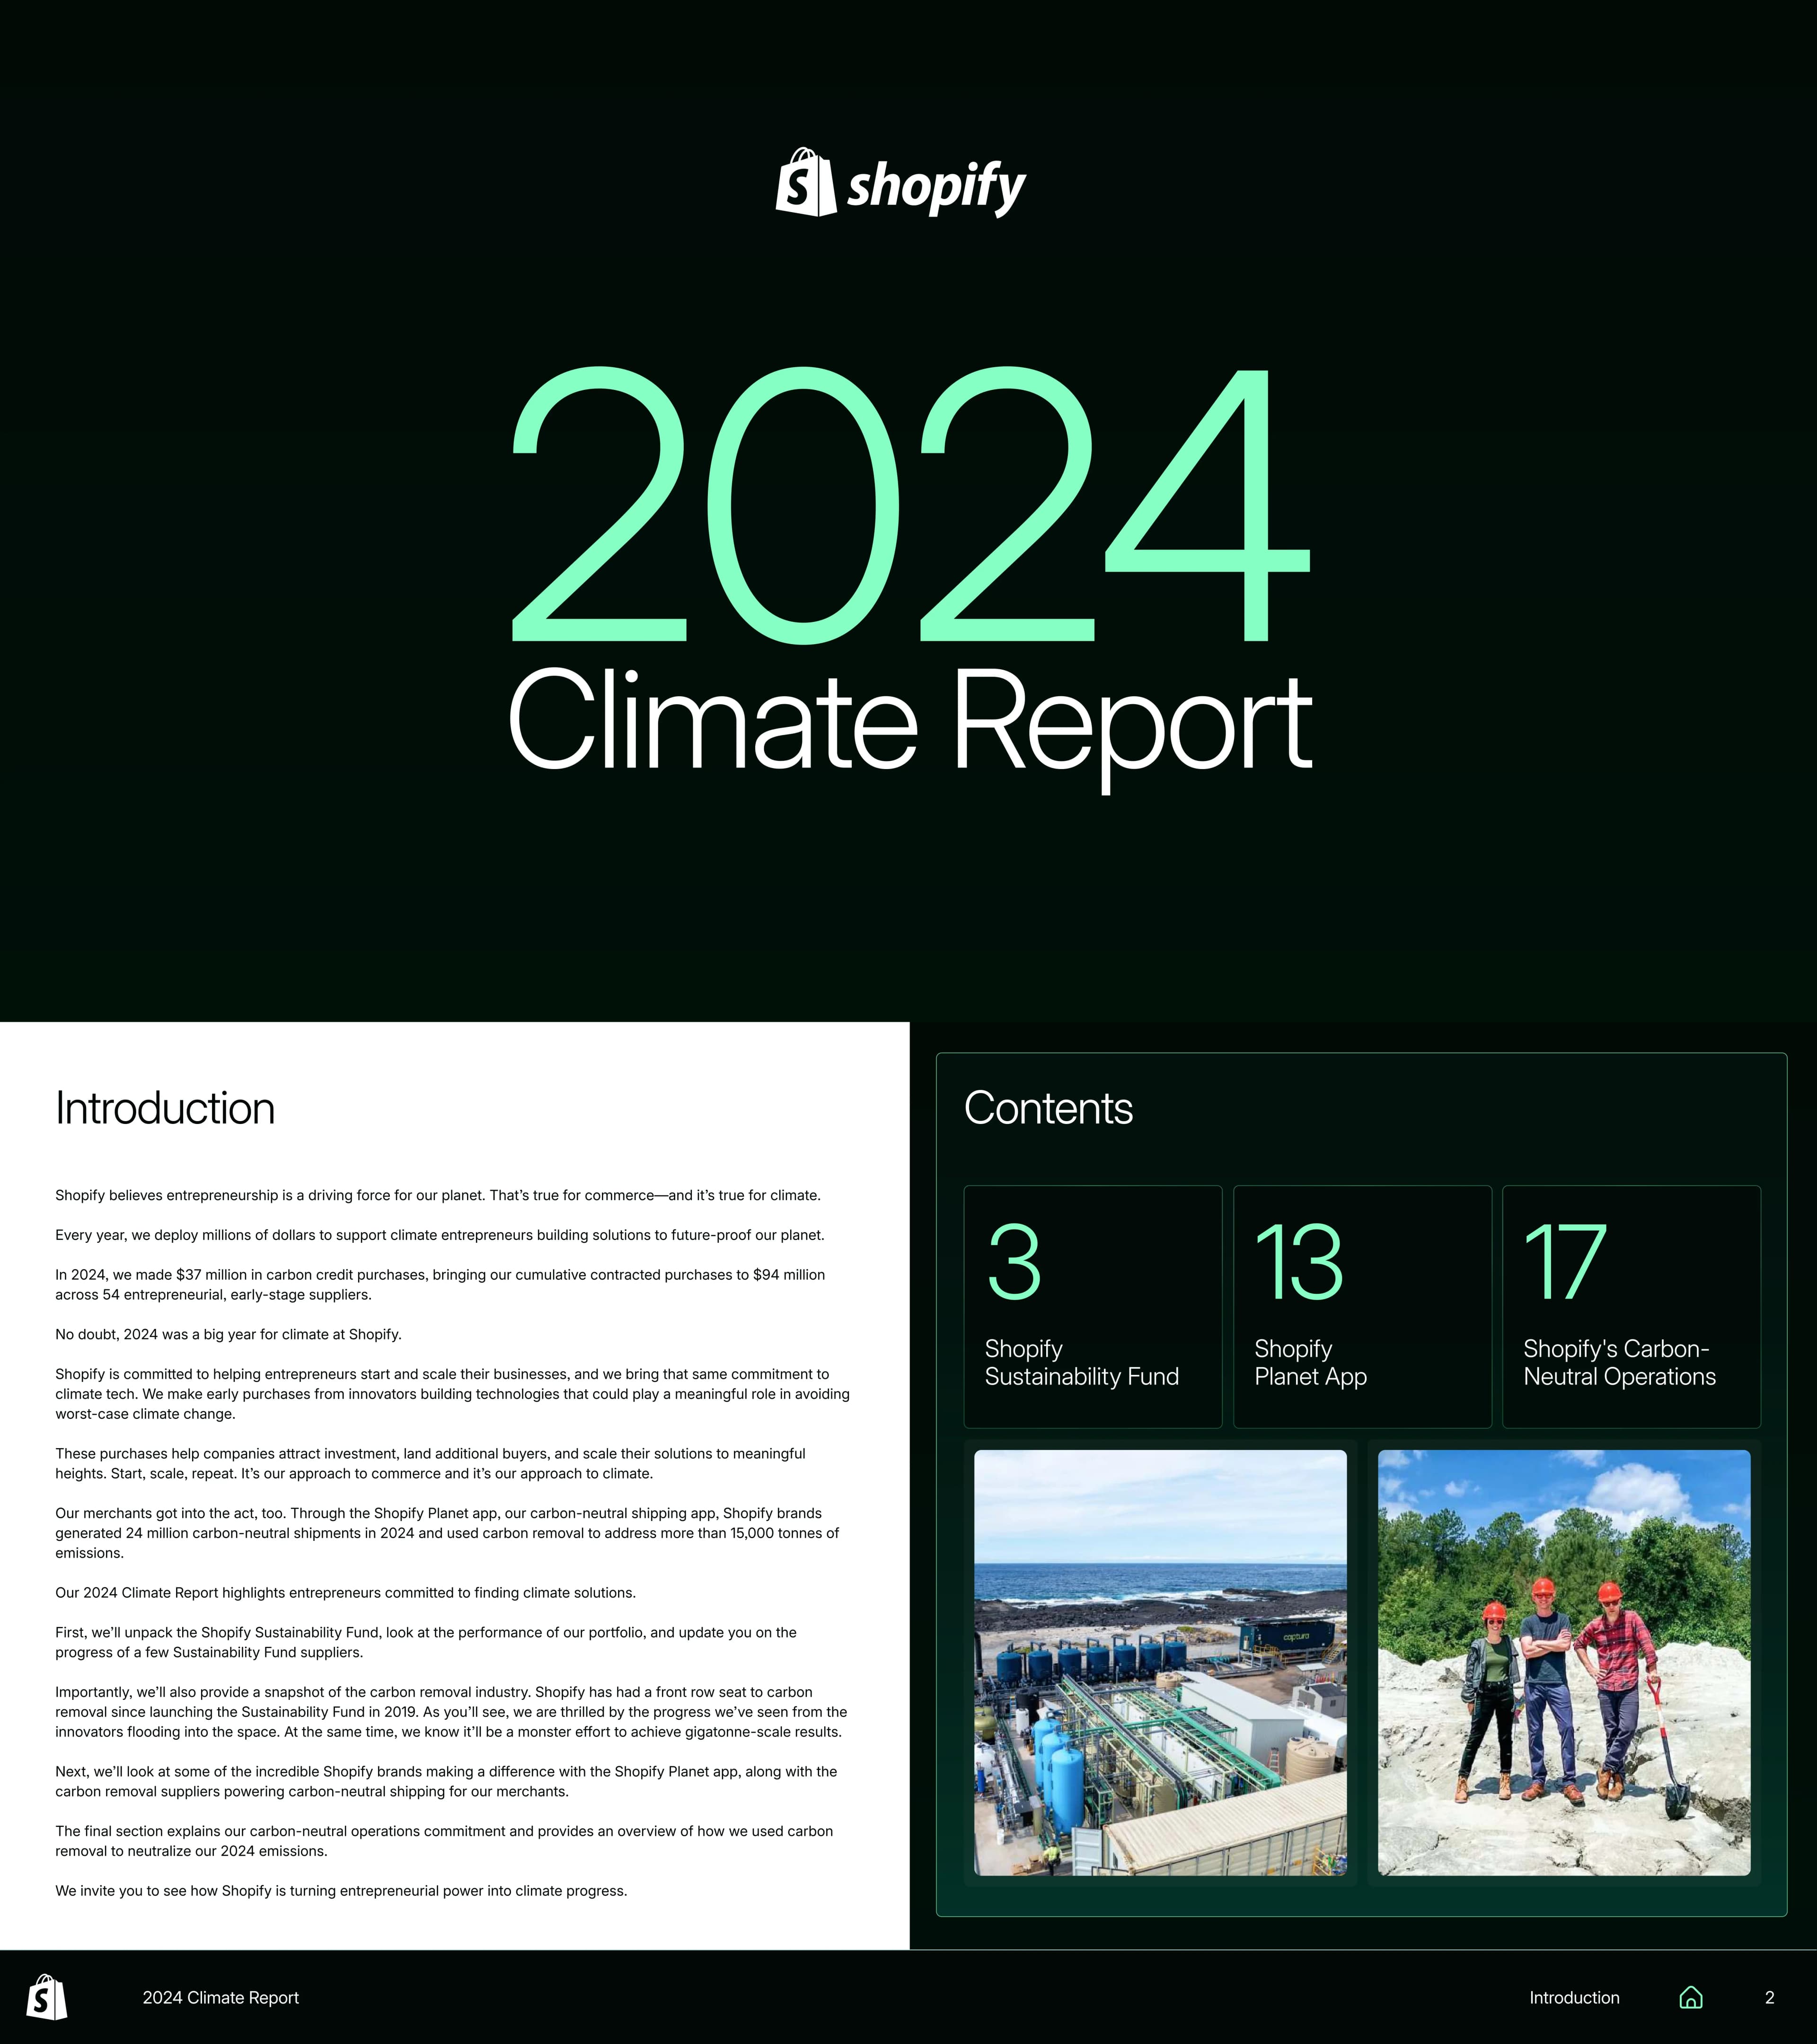
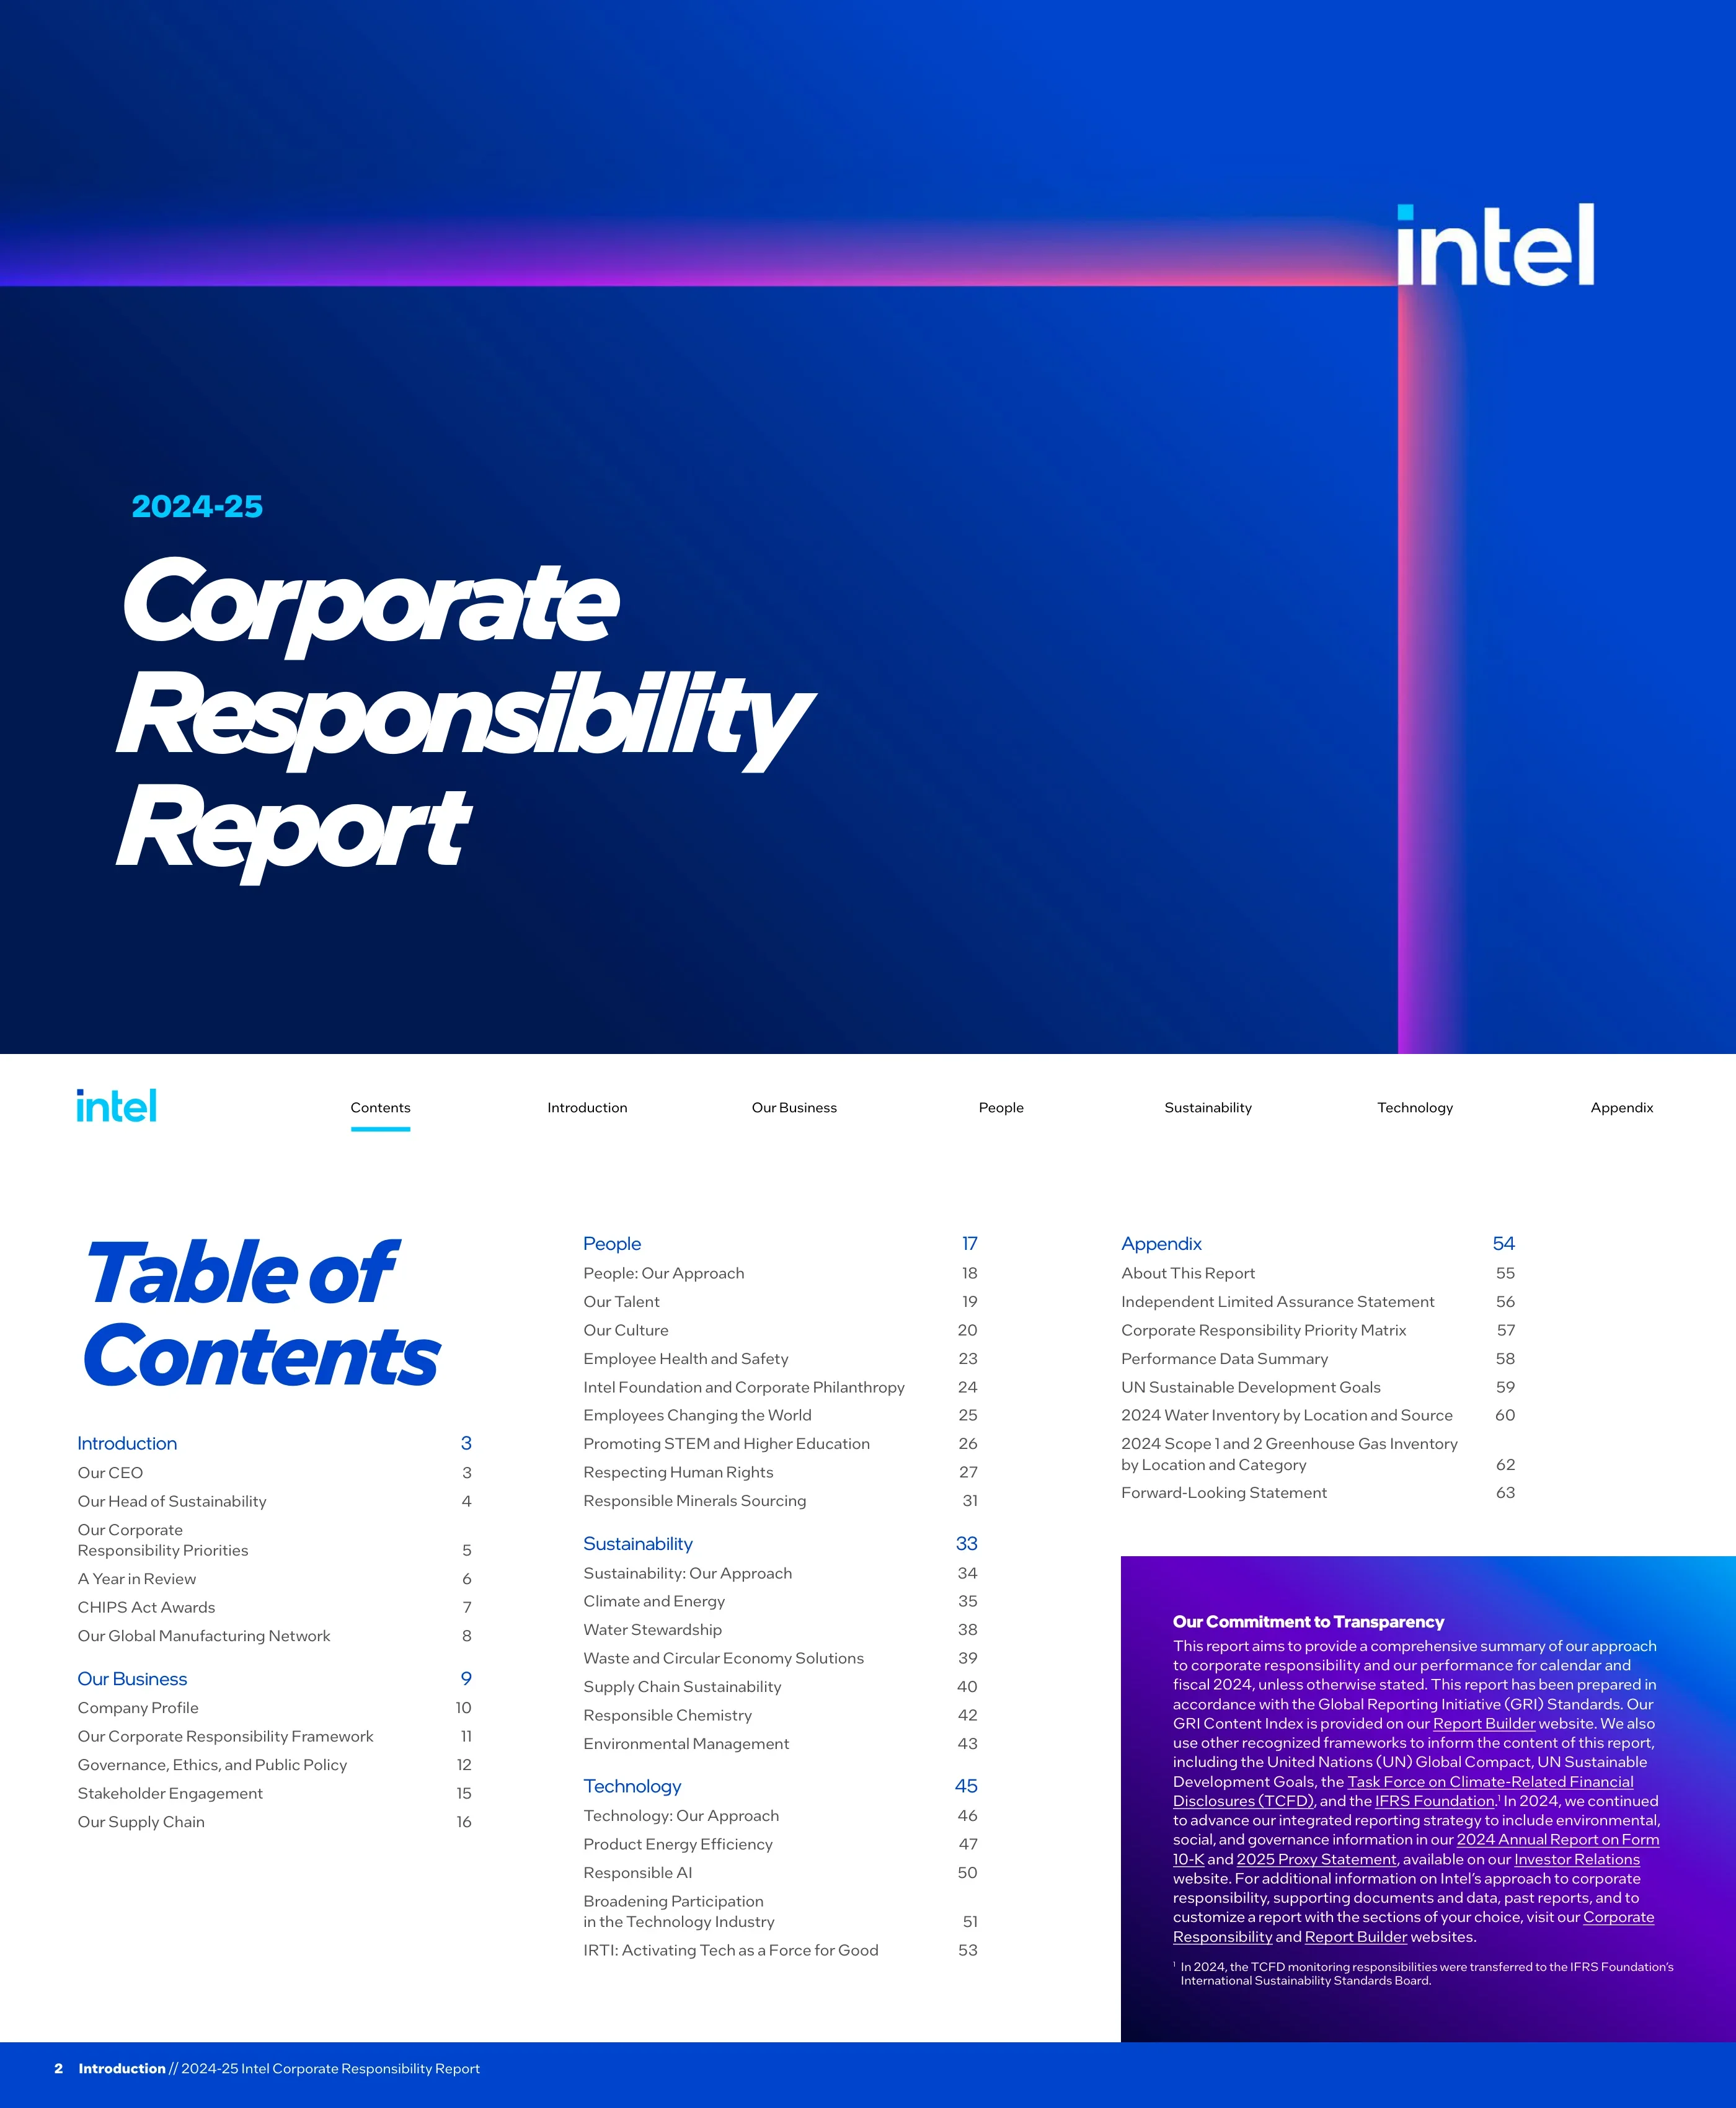
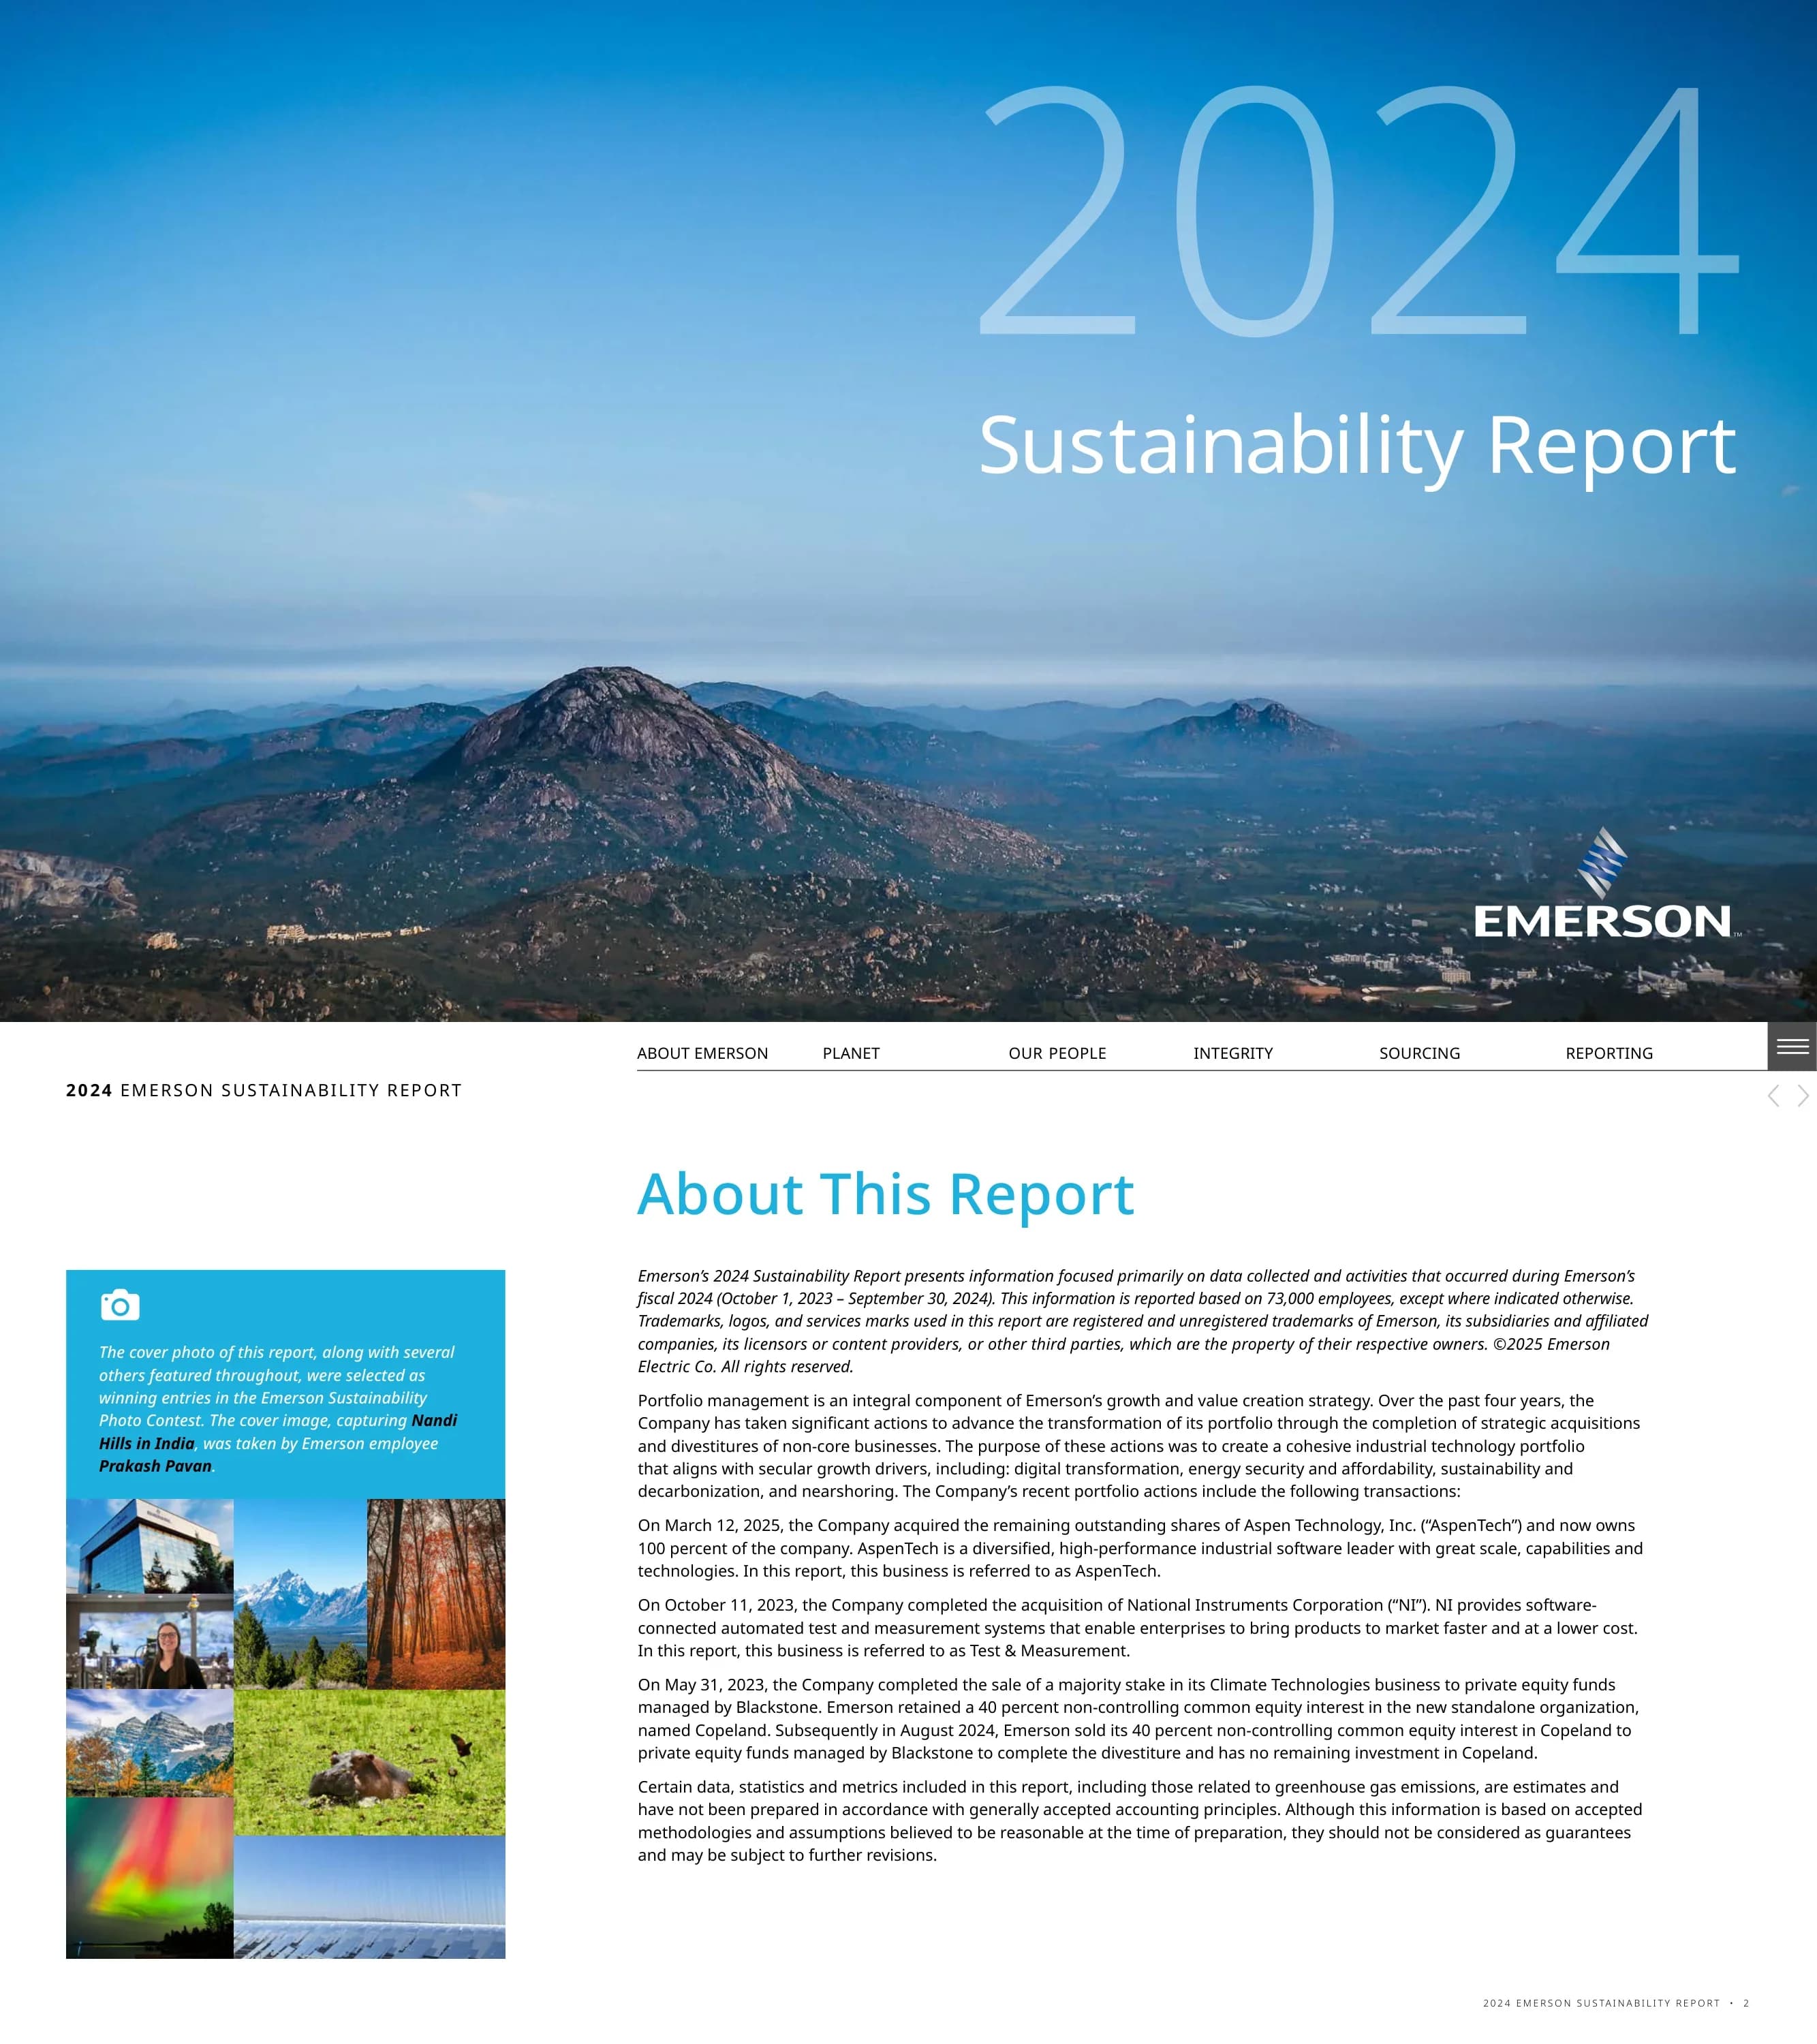
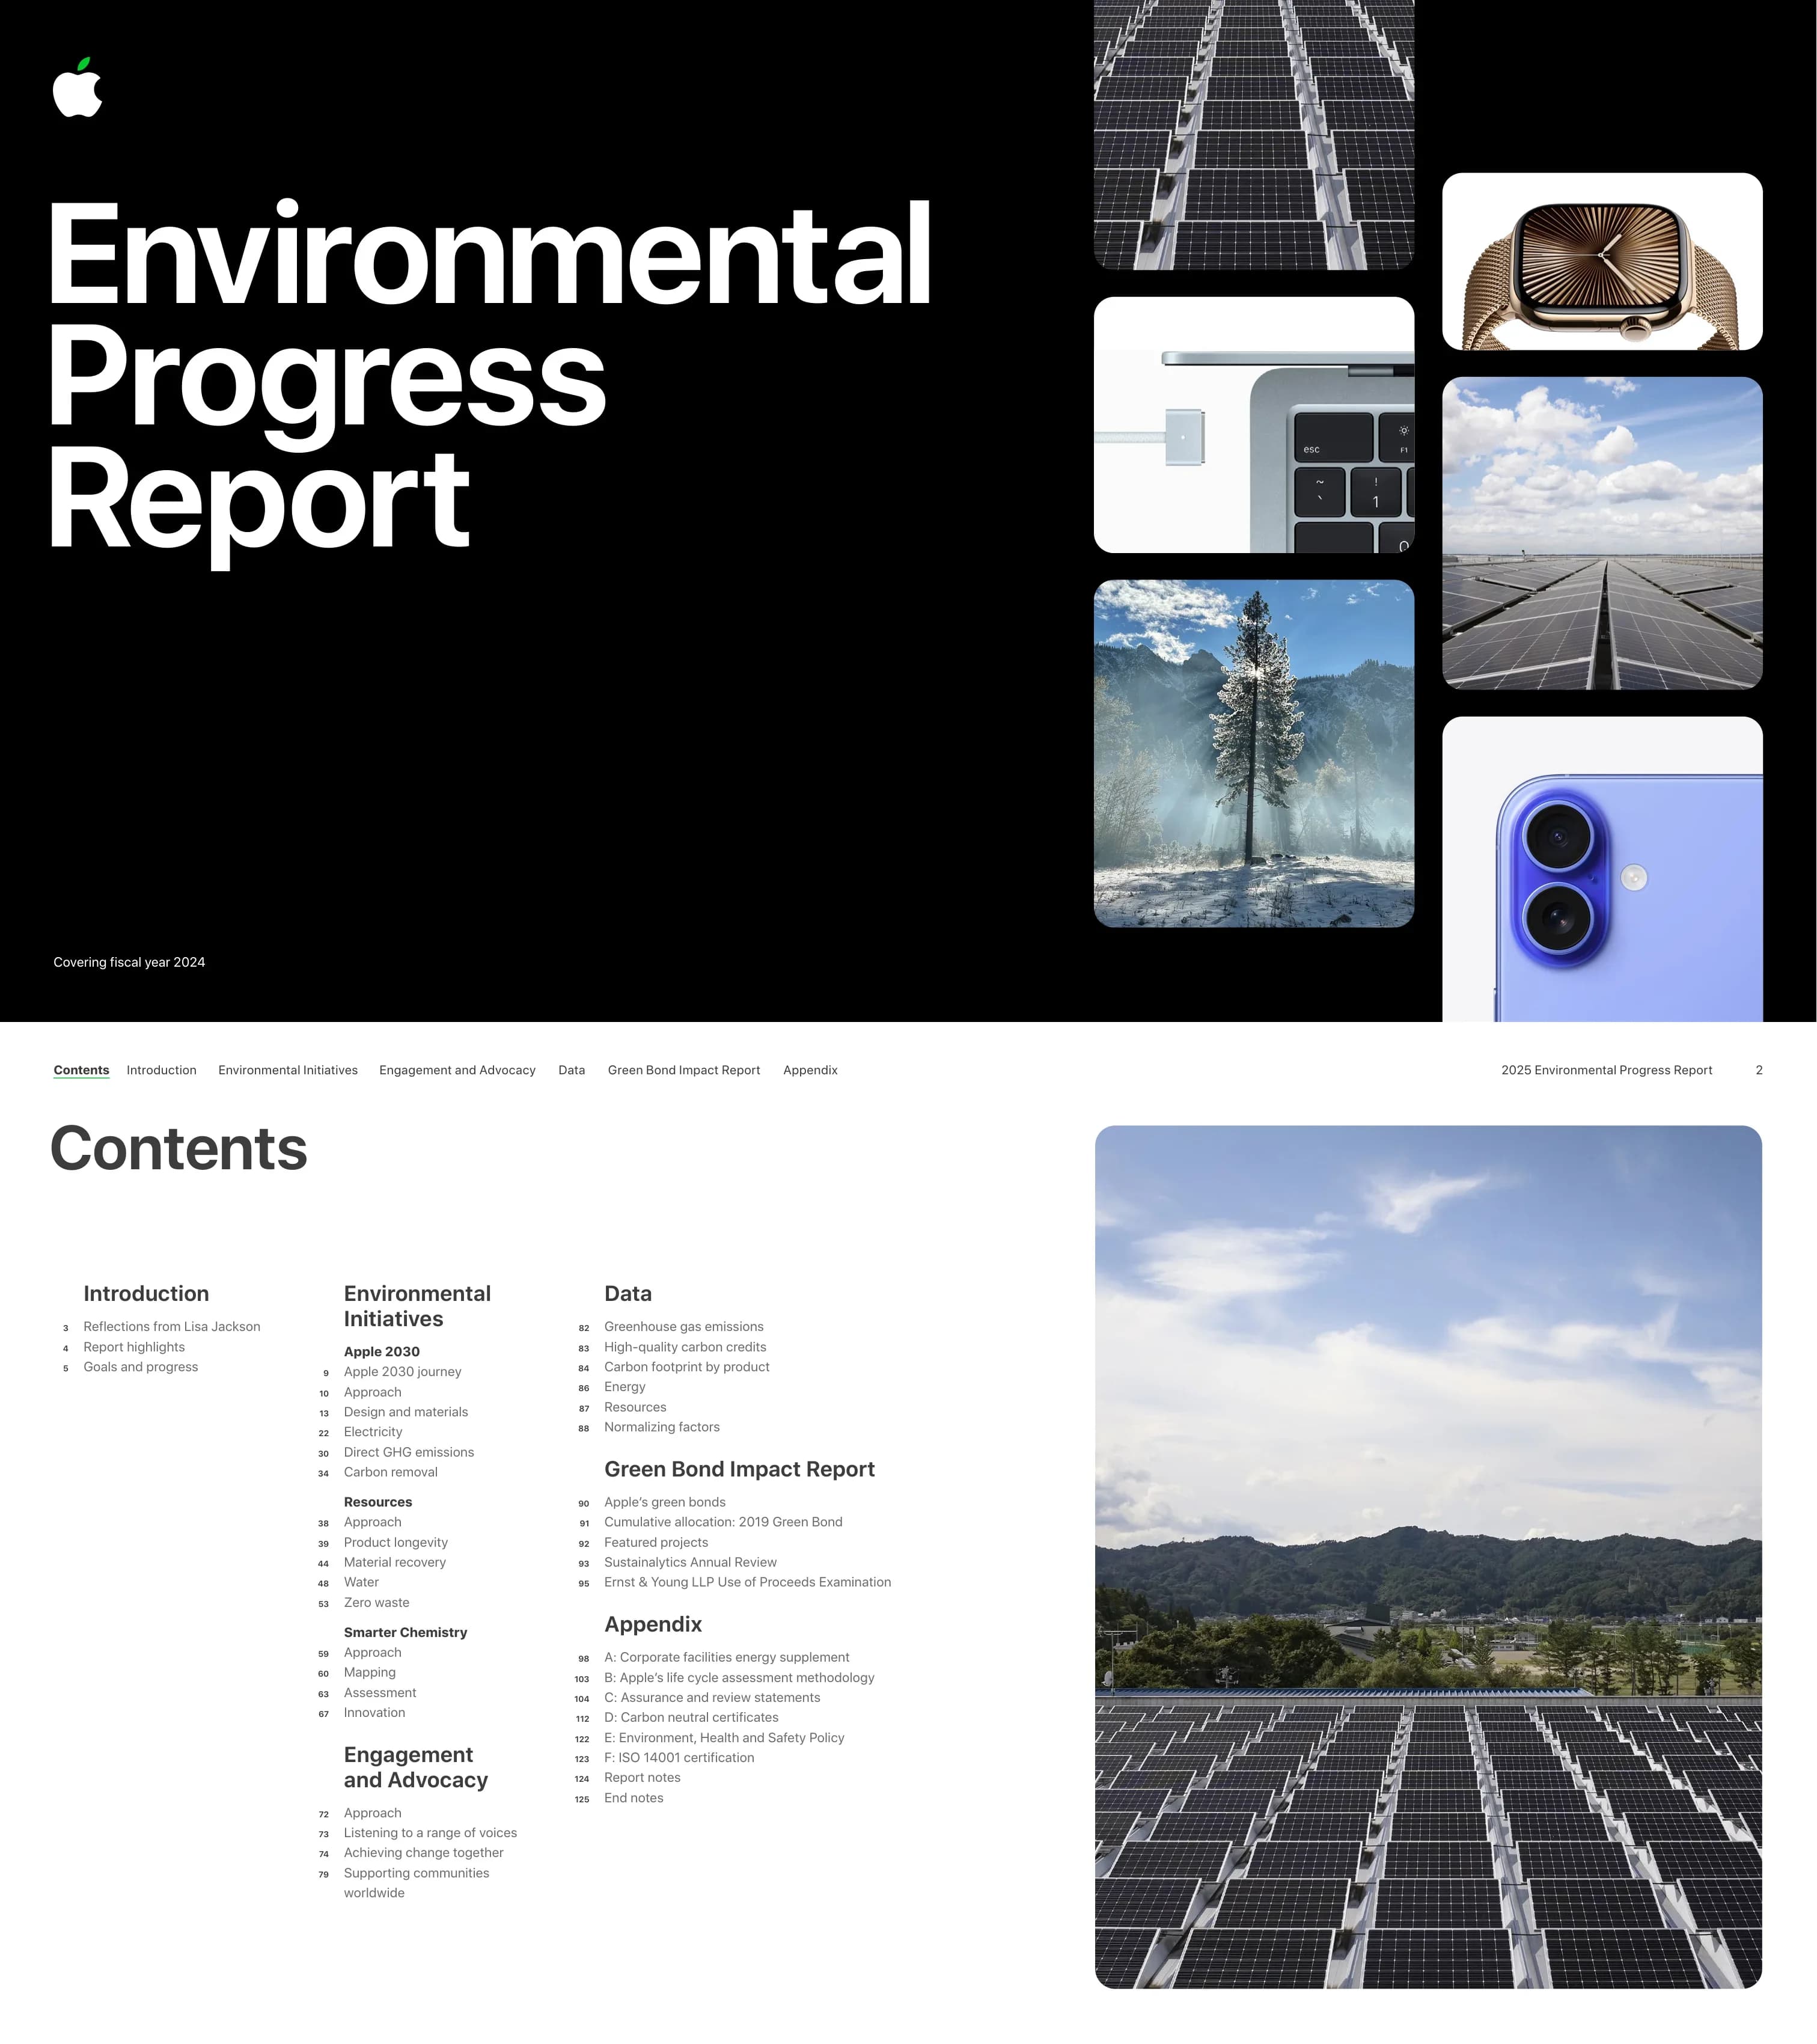

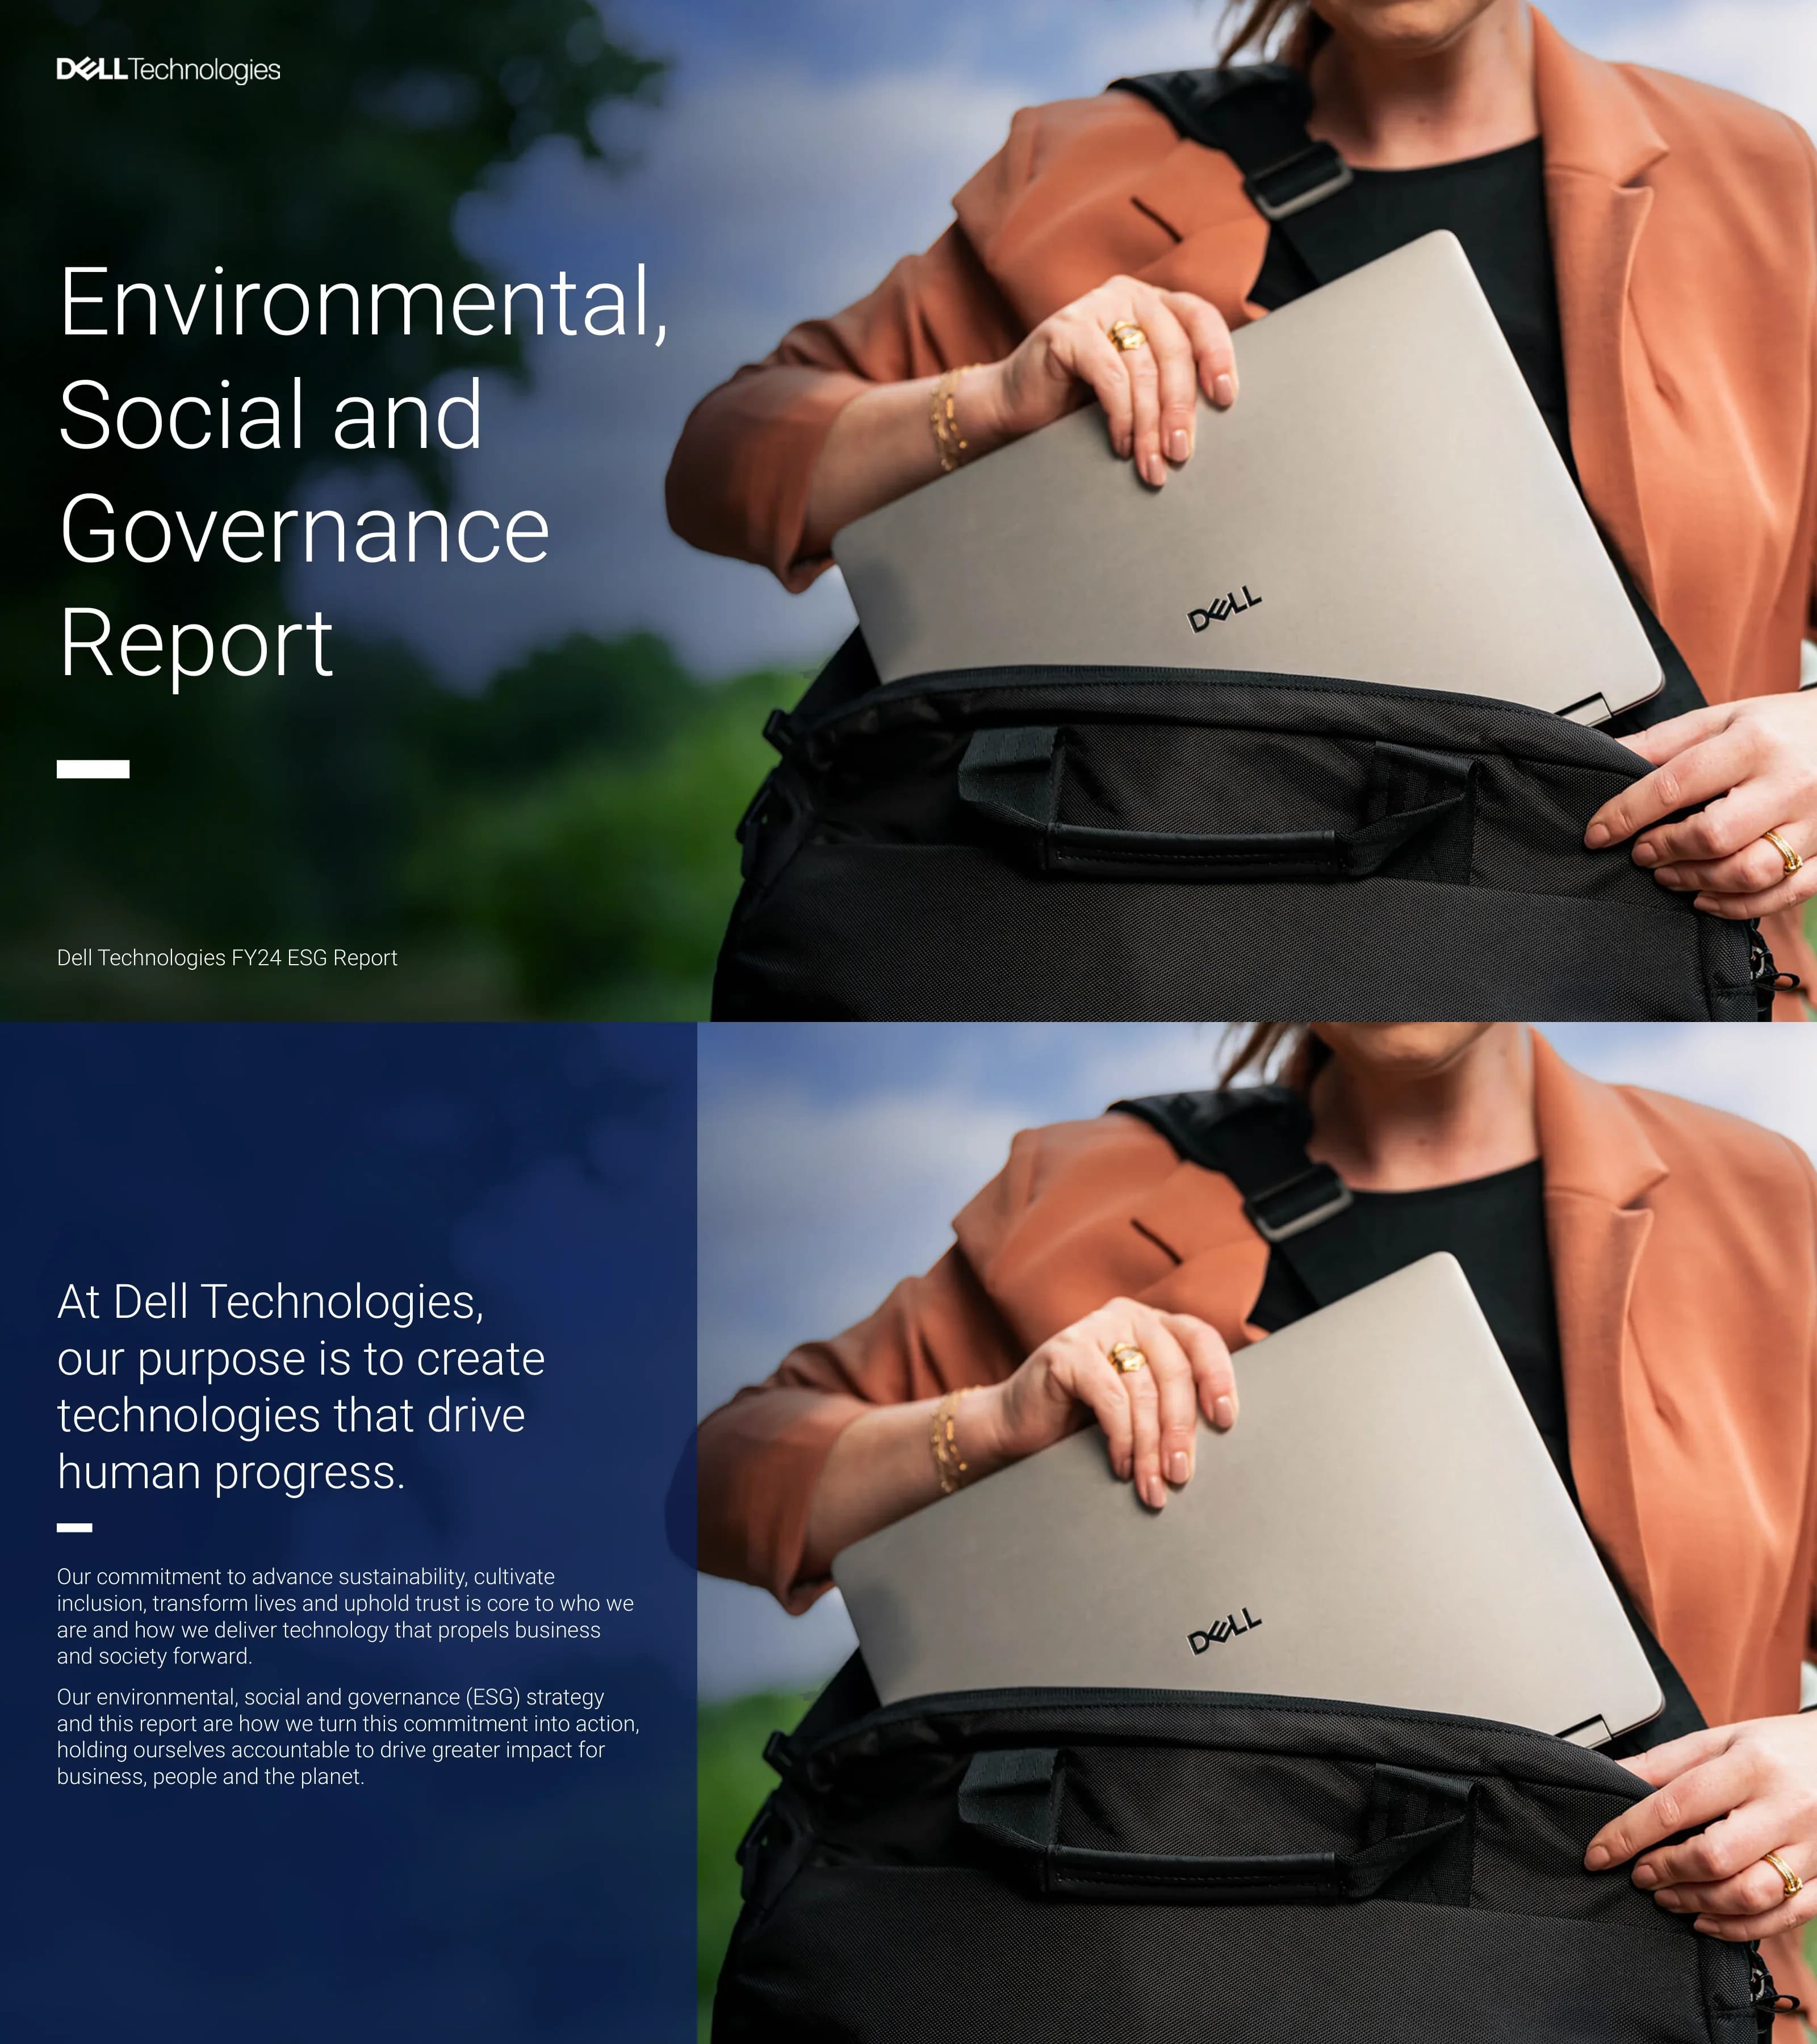
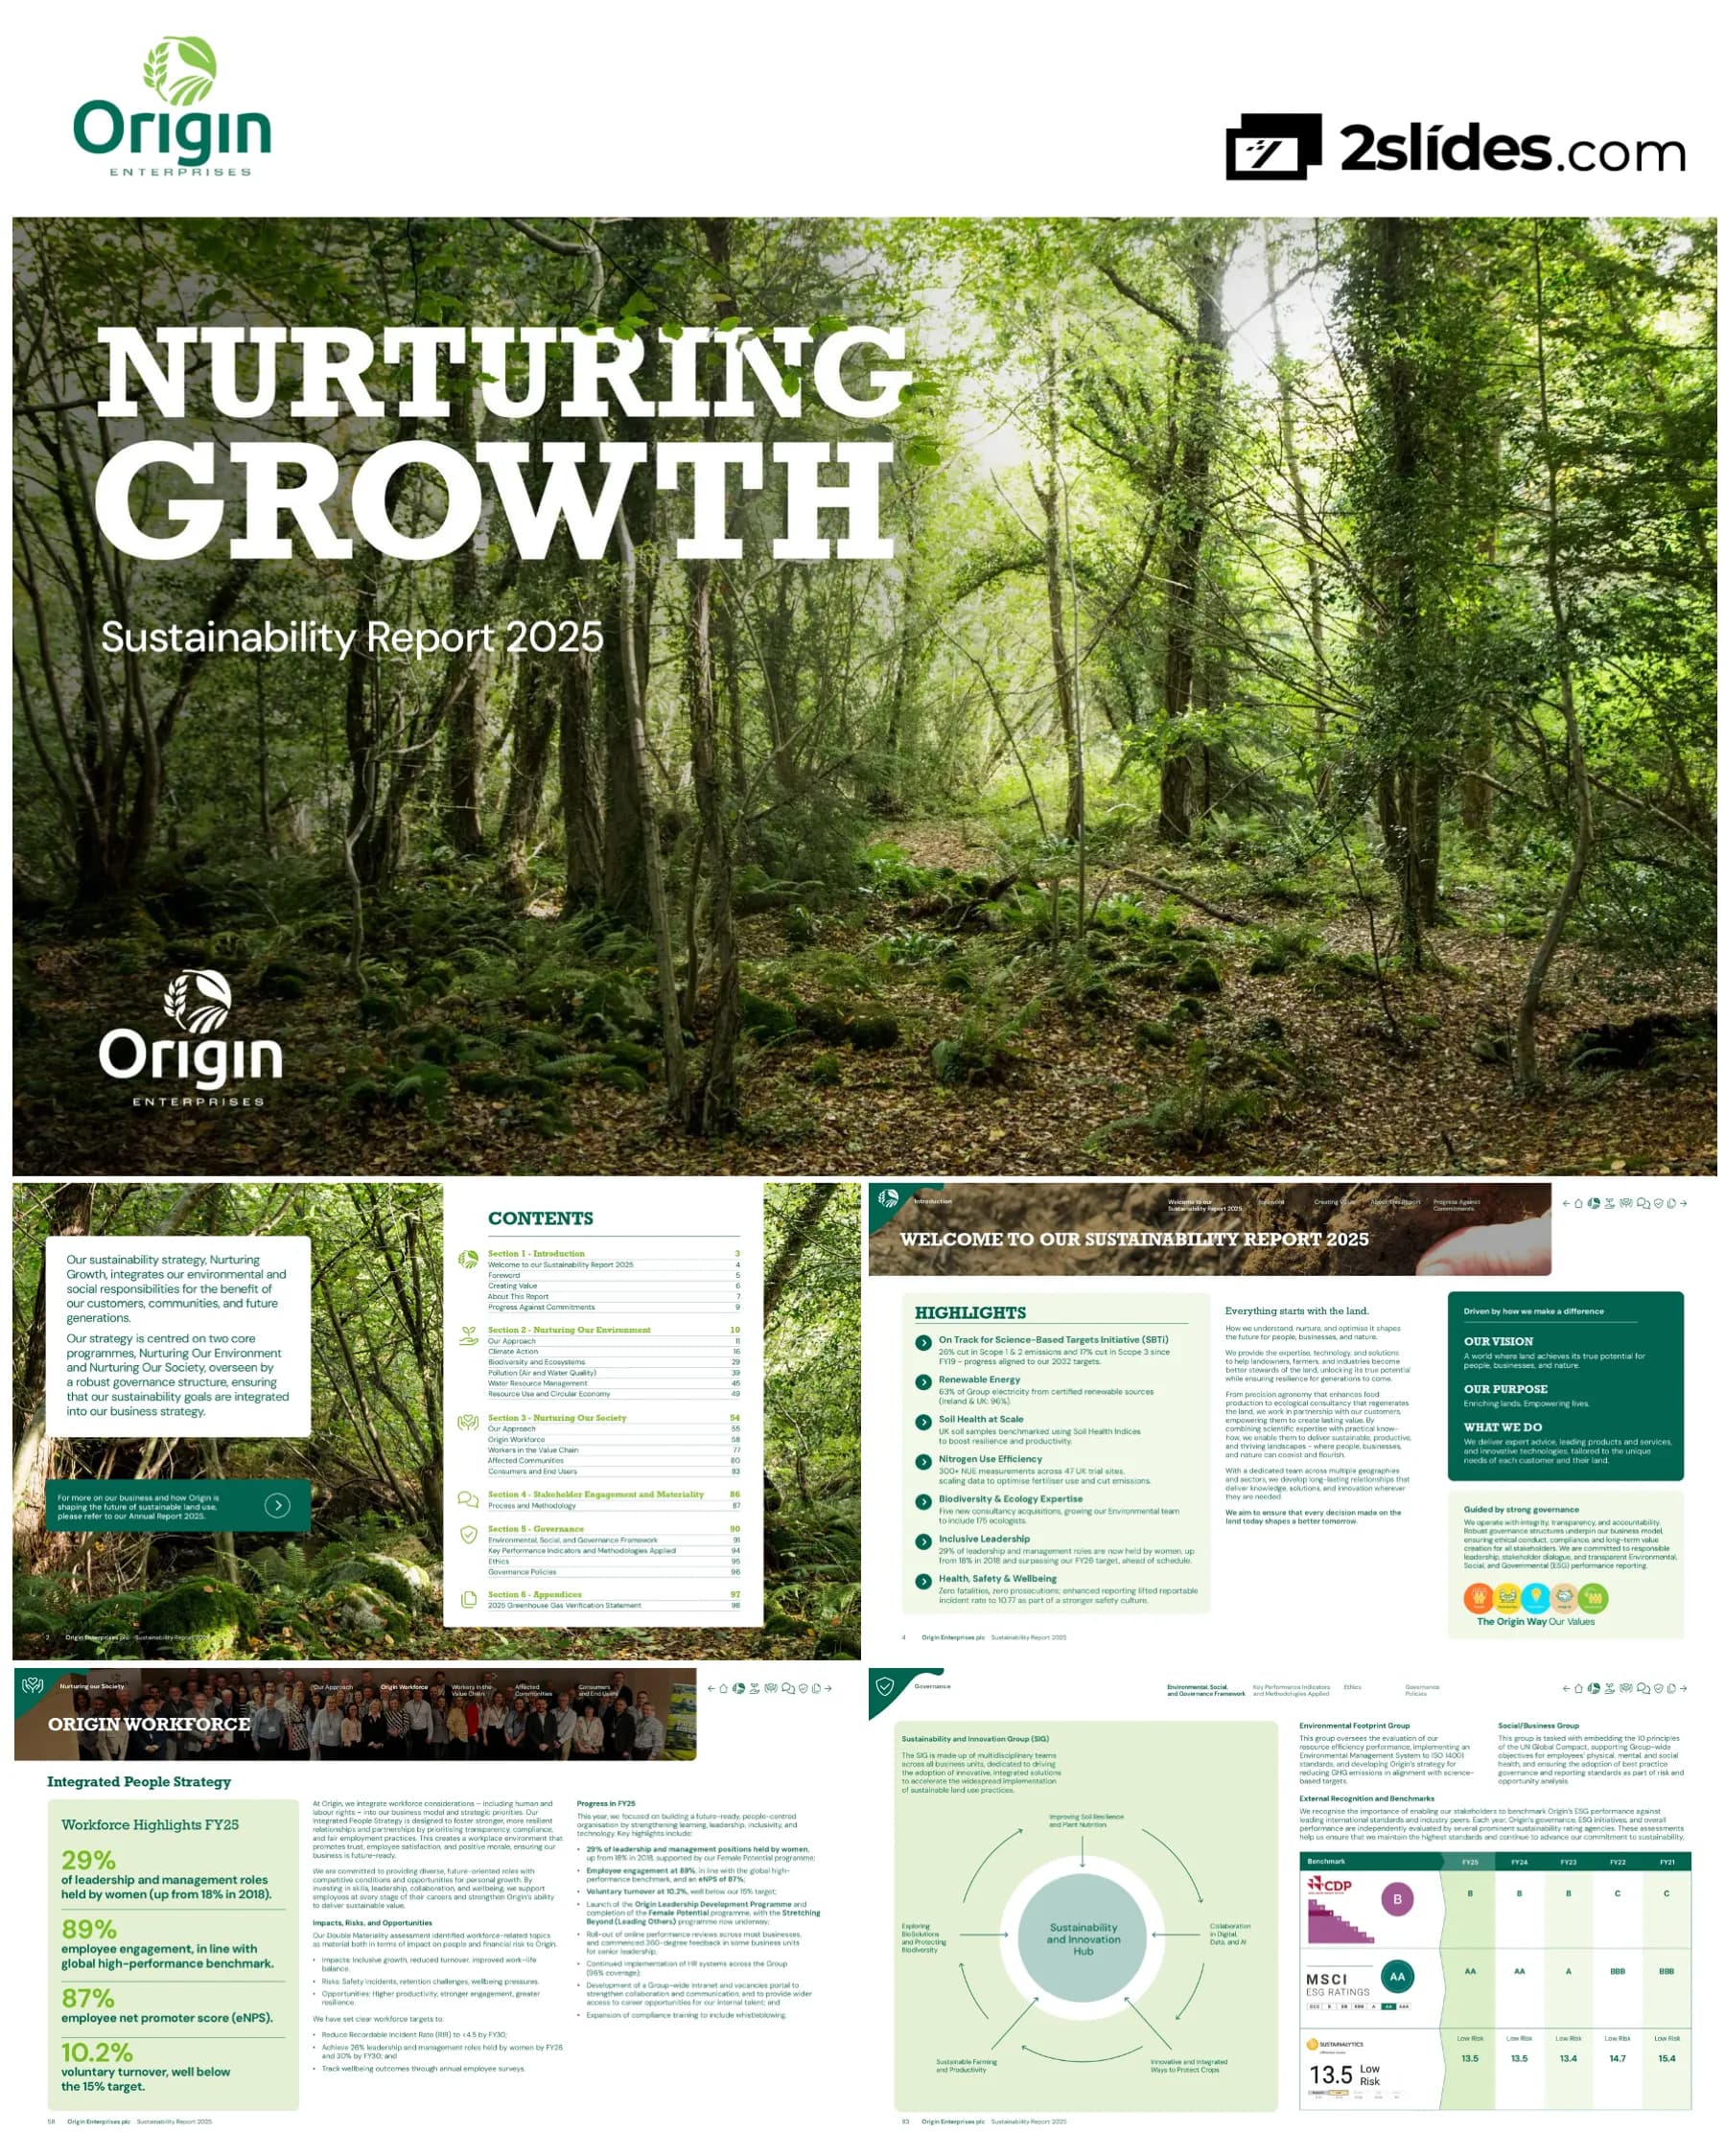
Sustainability and ESG reports
6 decksAnnual reports covering environmental, social and governance performance, from strategy and targets to the data behind them.
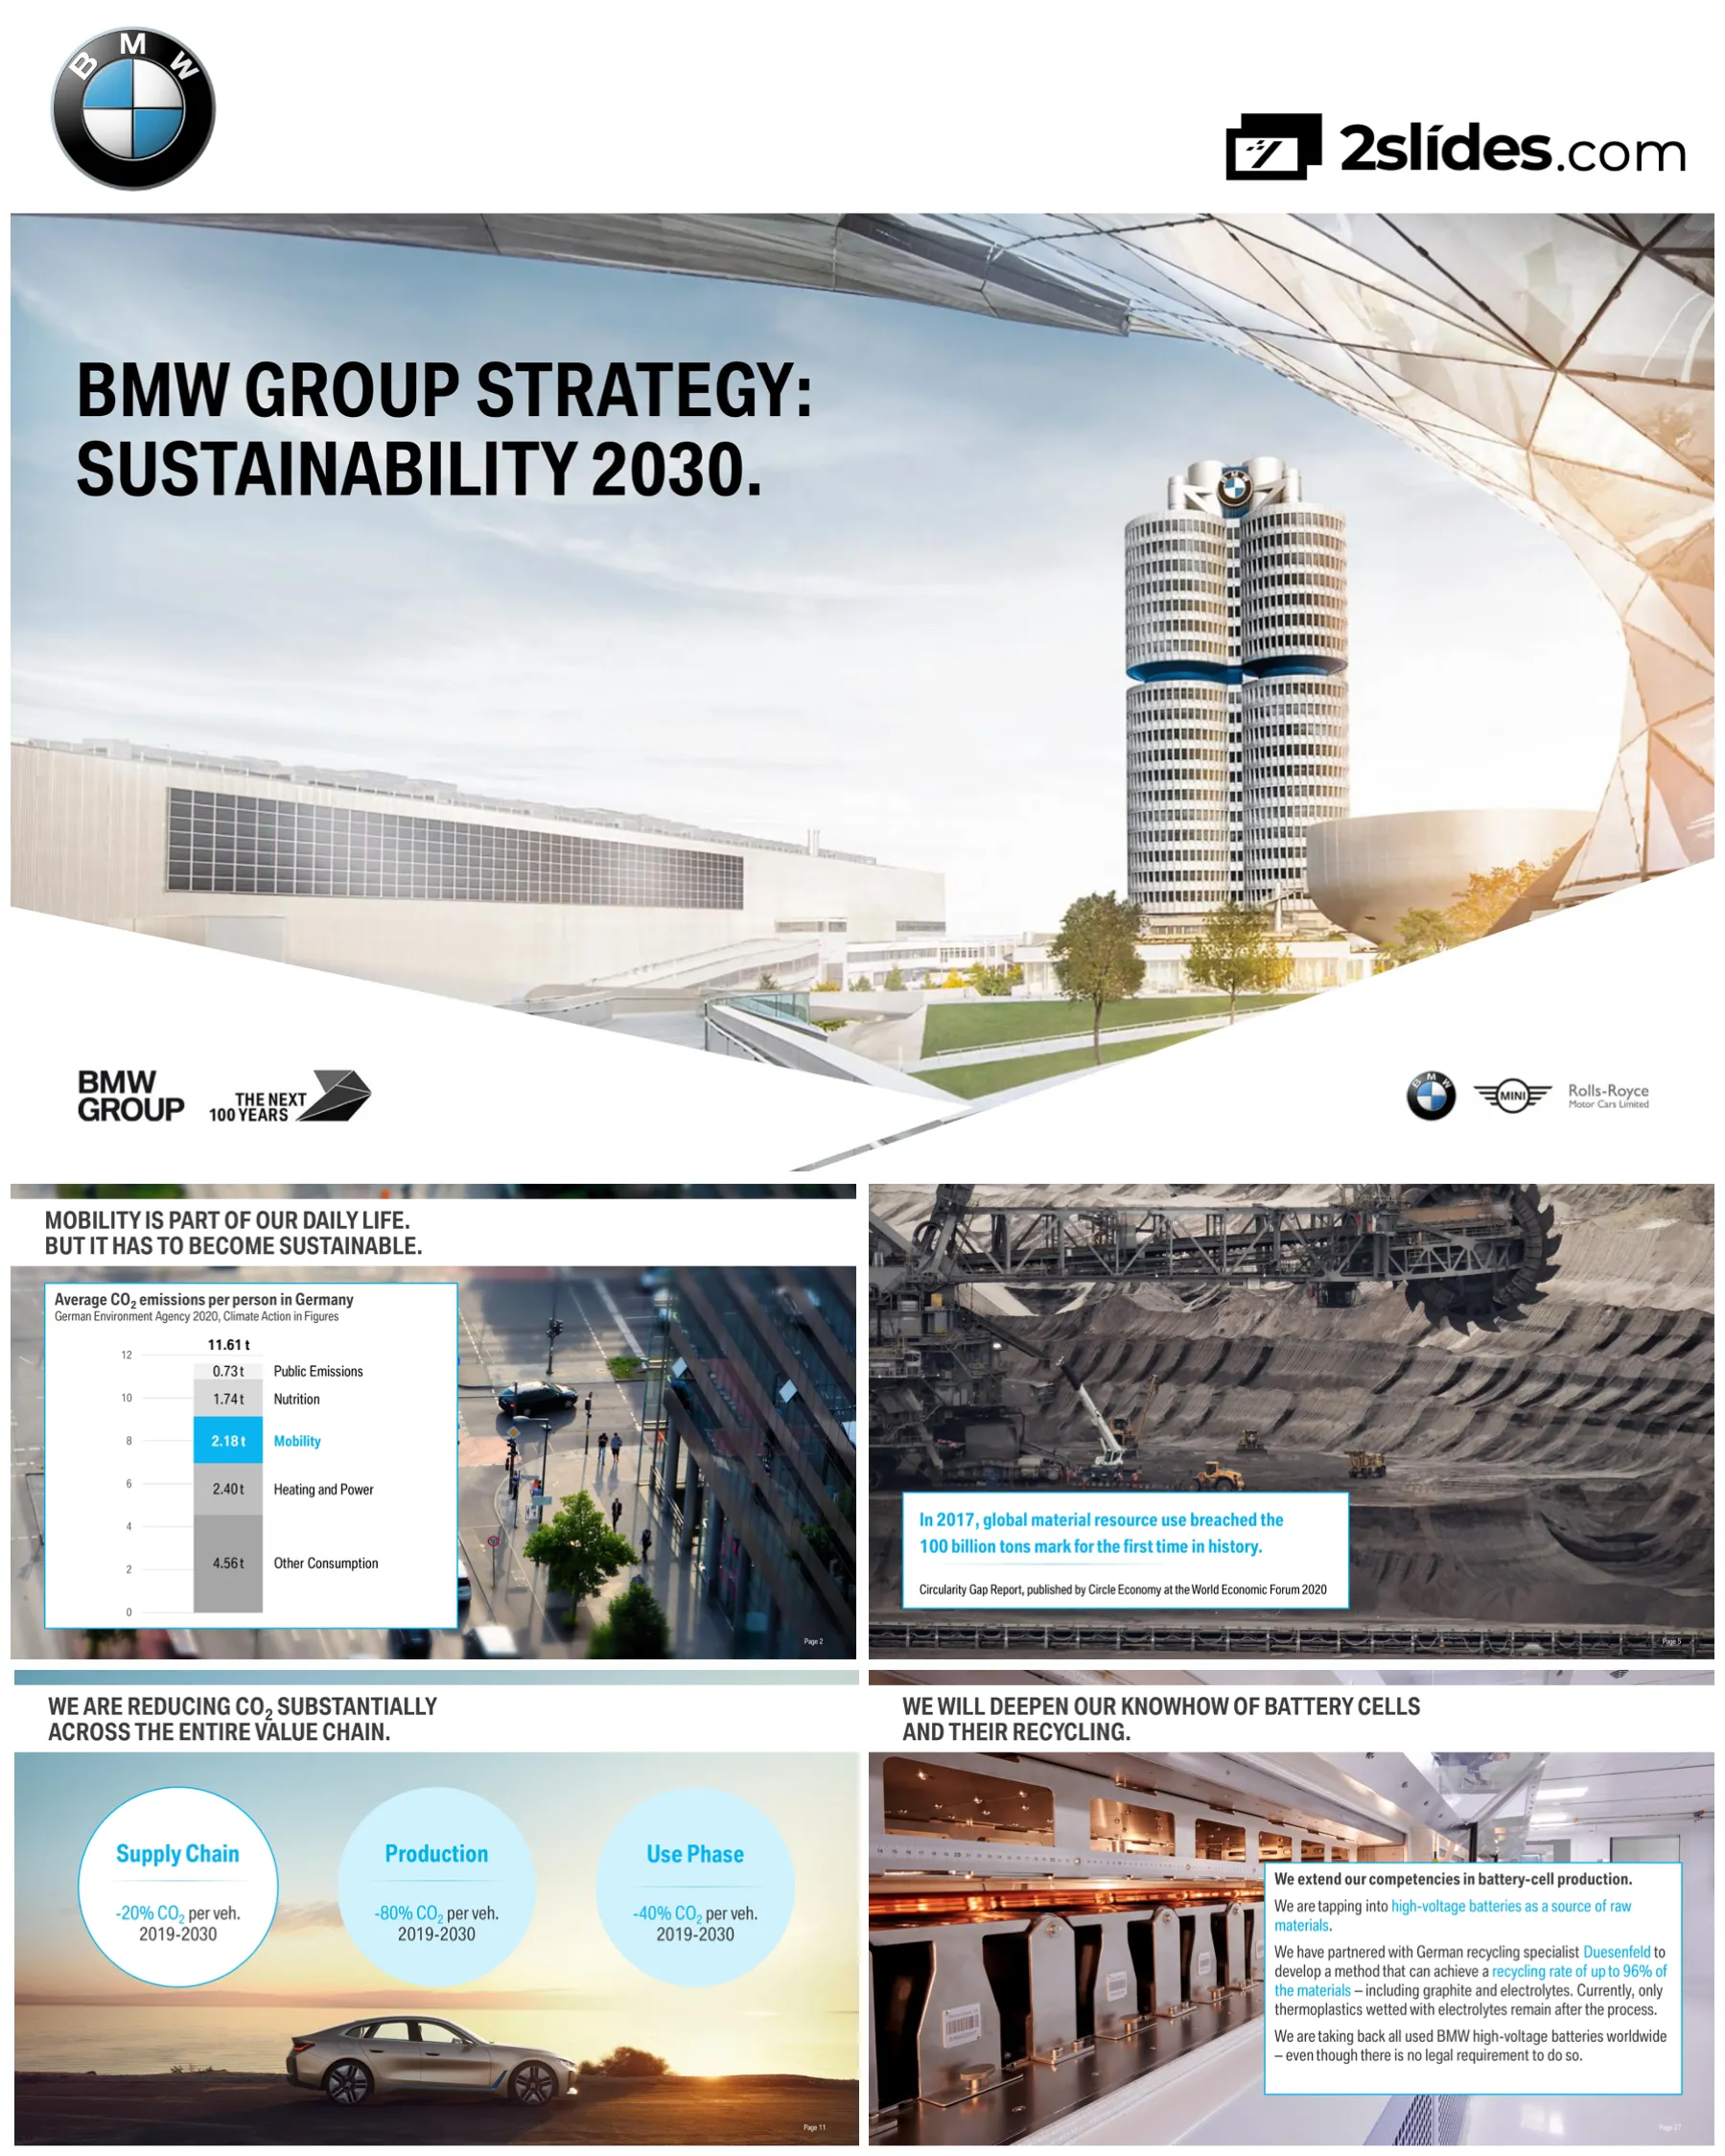
Climate and environmental reports
3 decksReports focused on emissions, energy, water and waste: where the footprint comes from and the plan to bring it down.
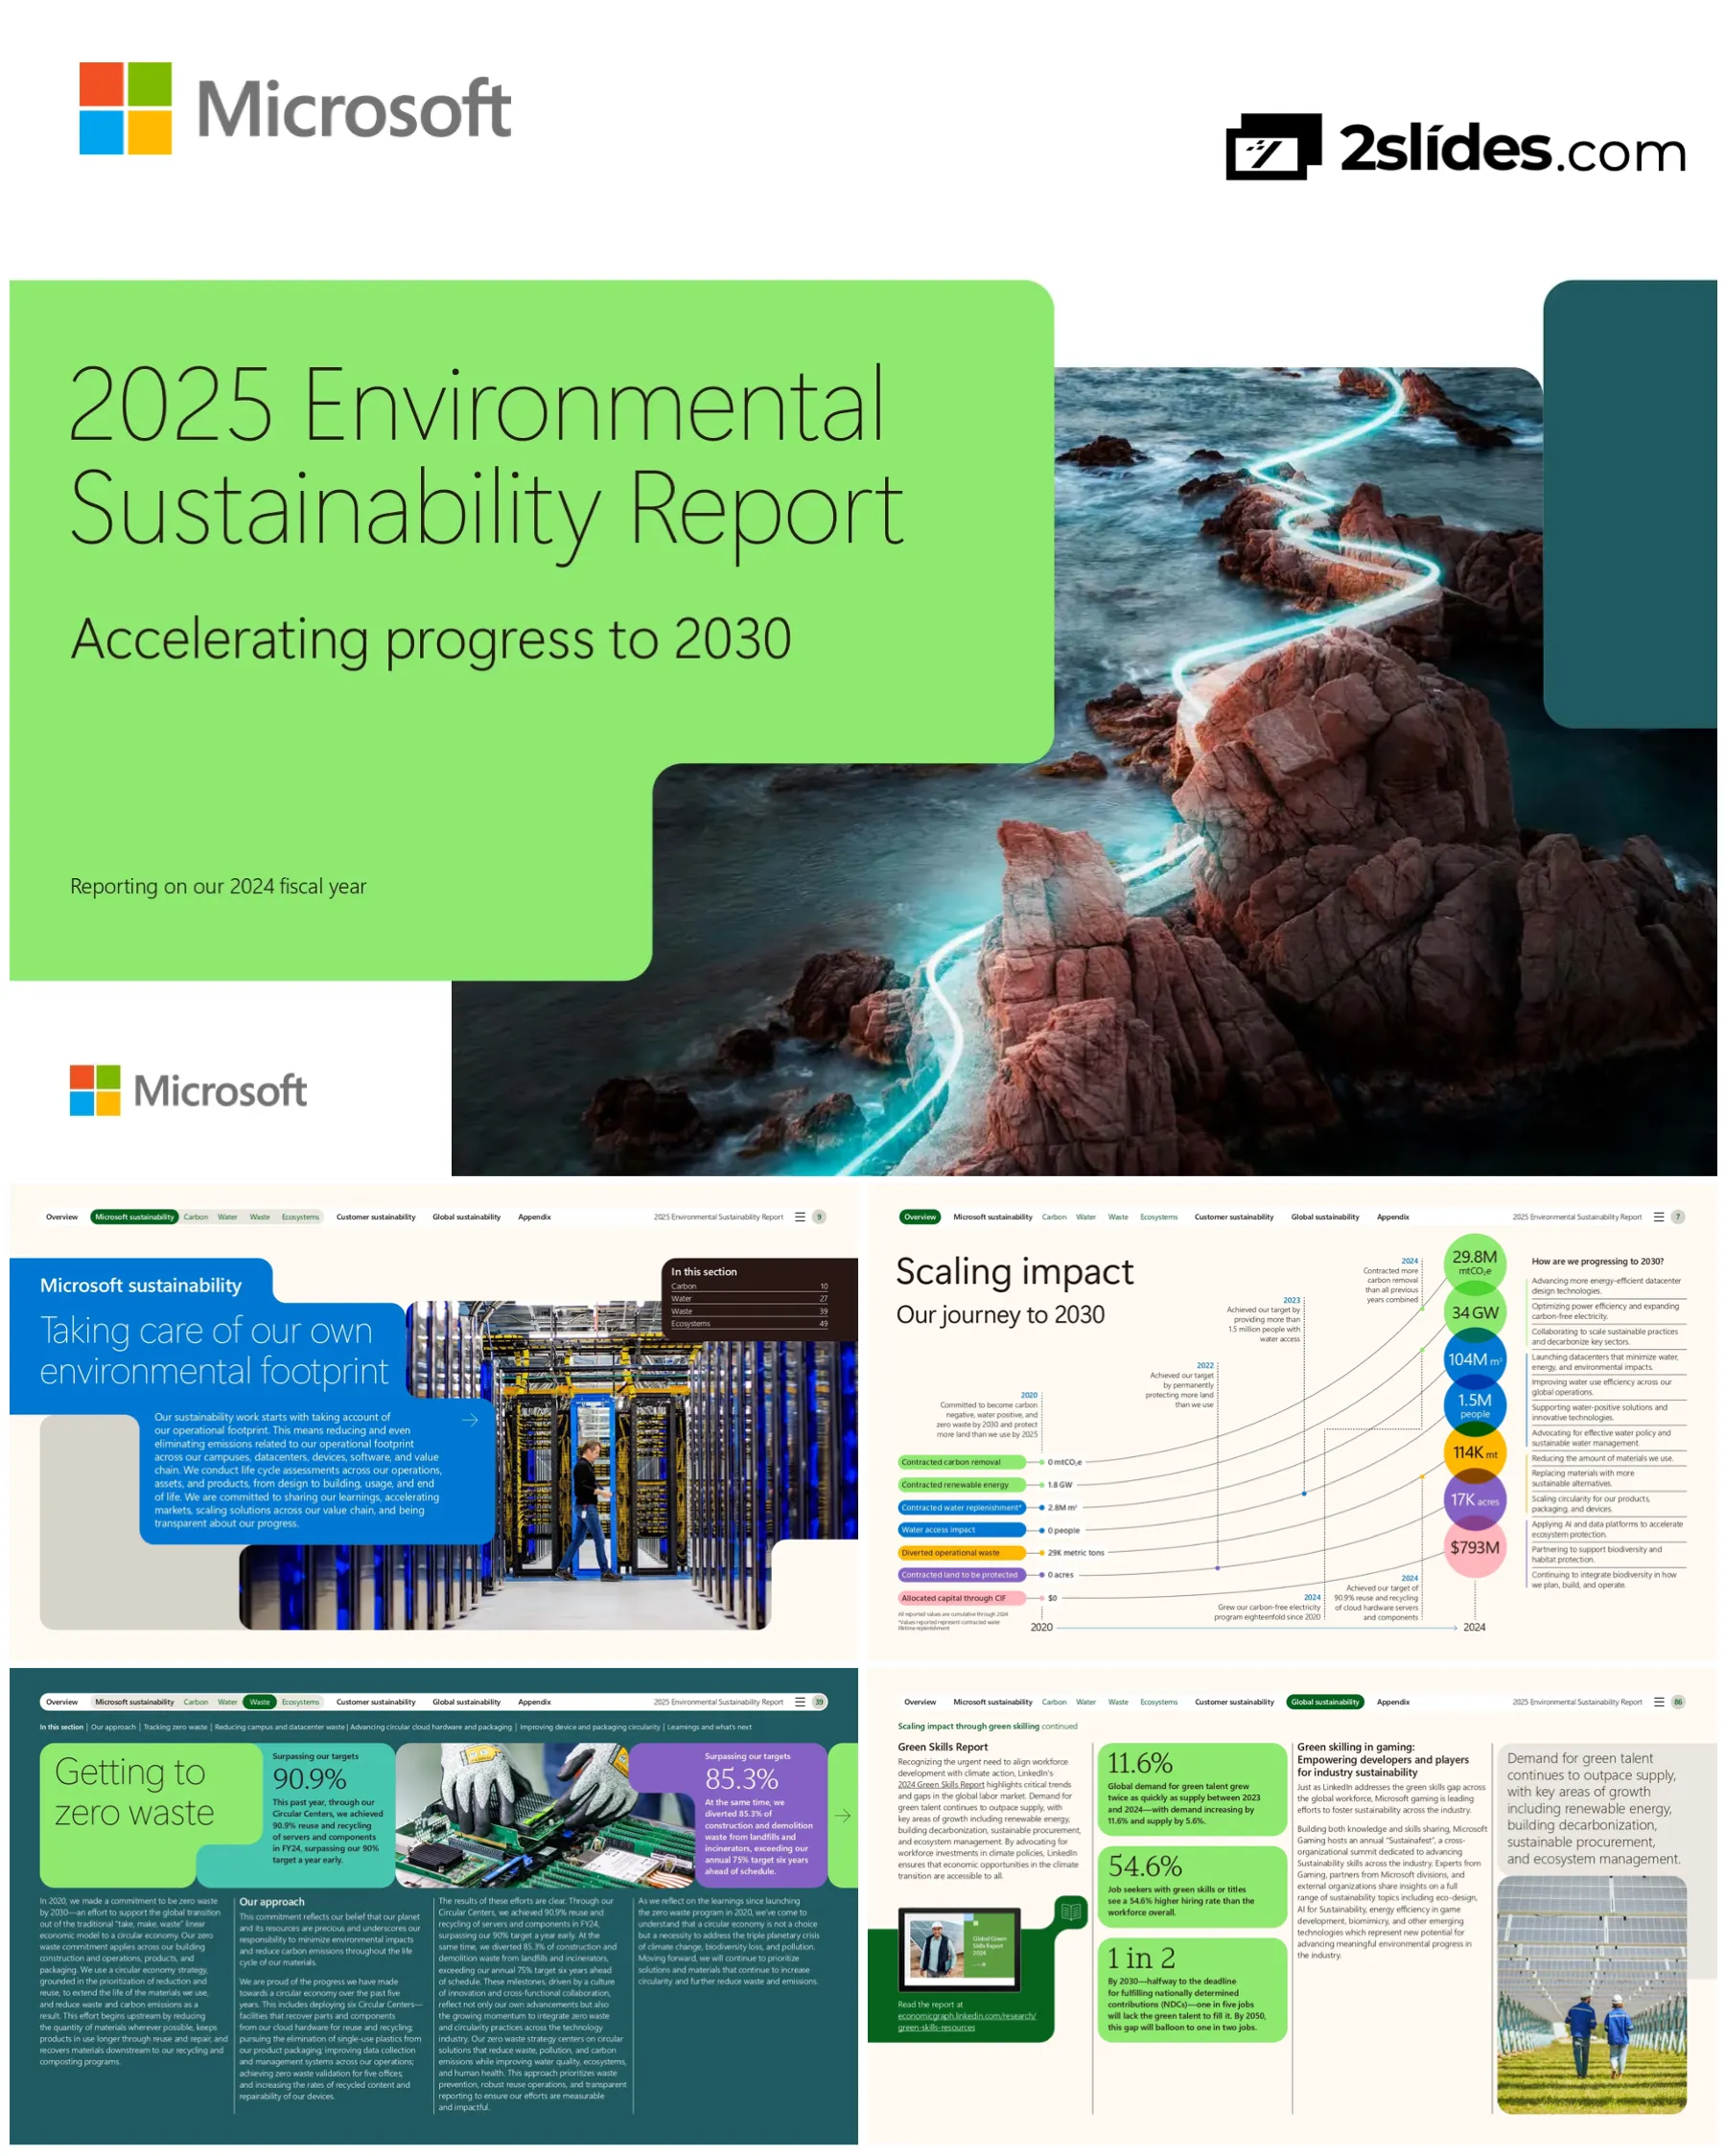
Impact and purpose reports
8 decksReports that lead with the company's effect on people, communities and the planet, often written for customers as much as investors.
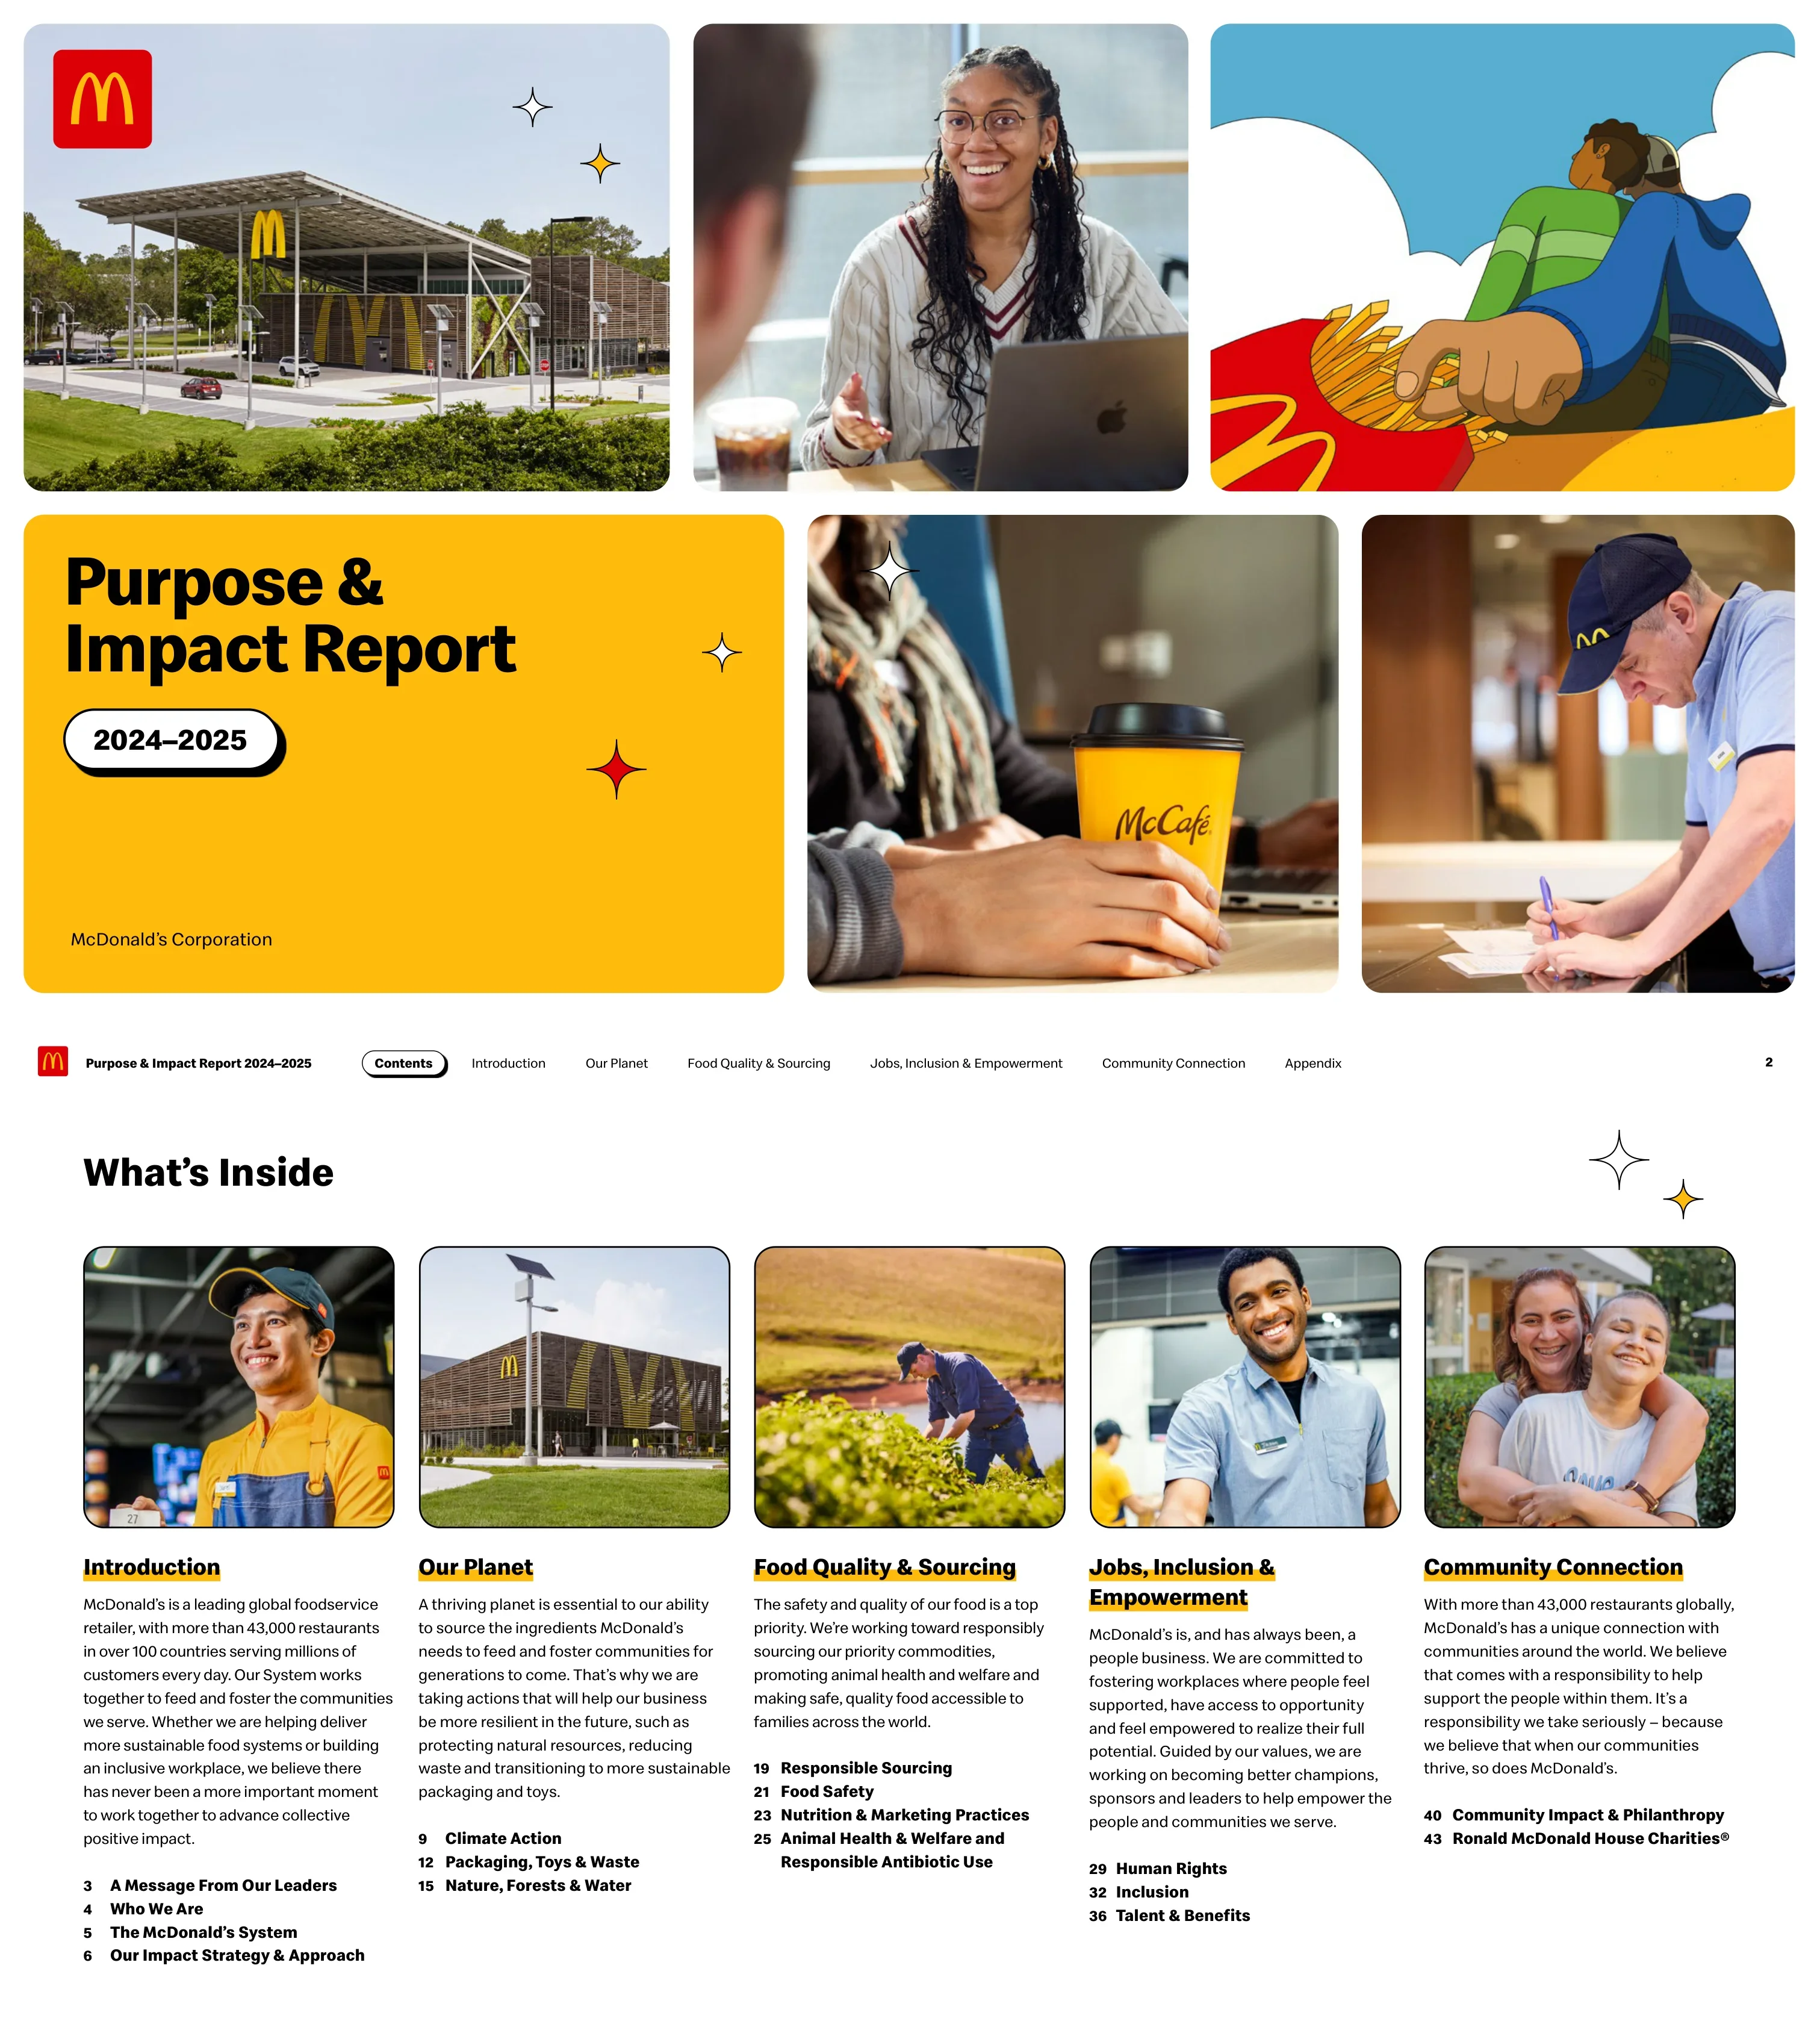
McDonald's Purpose & Impact Report 2024–2025
49 slides
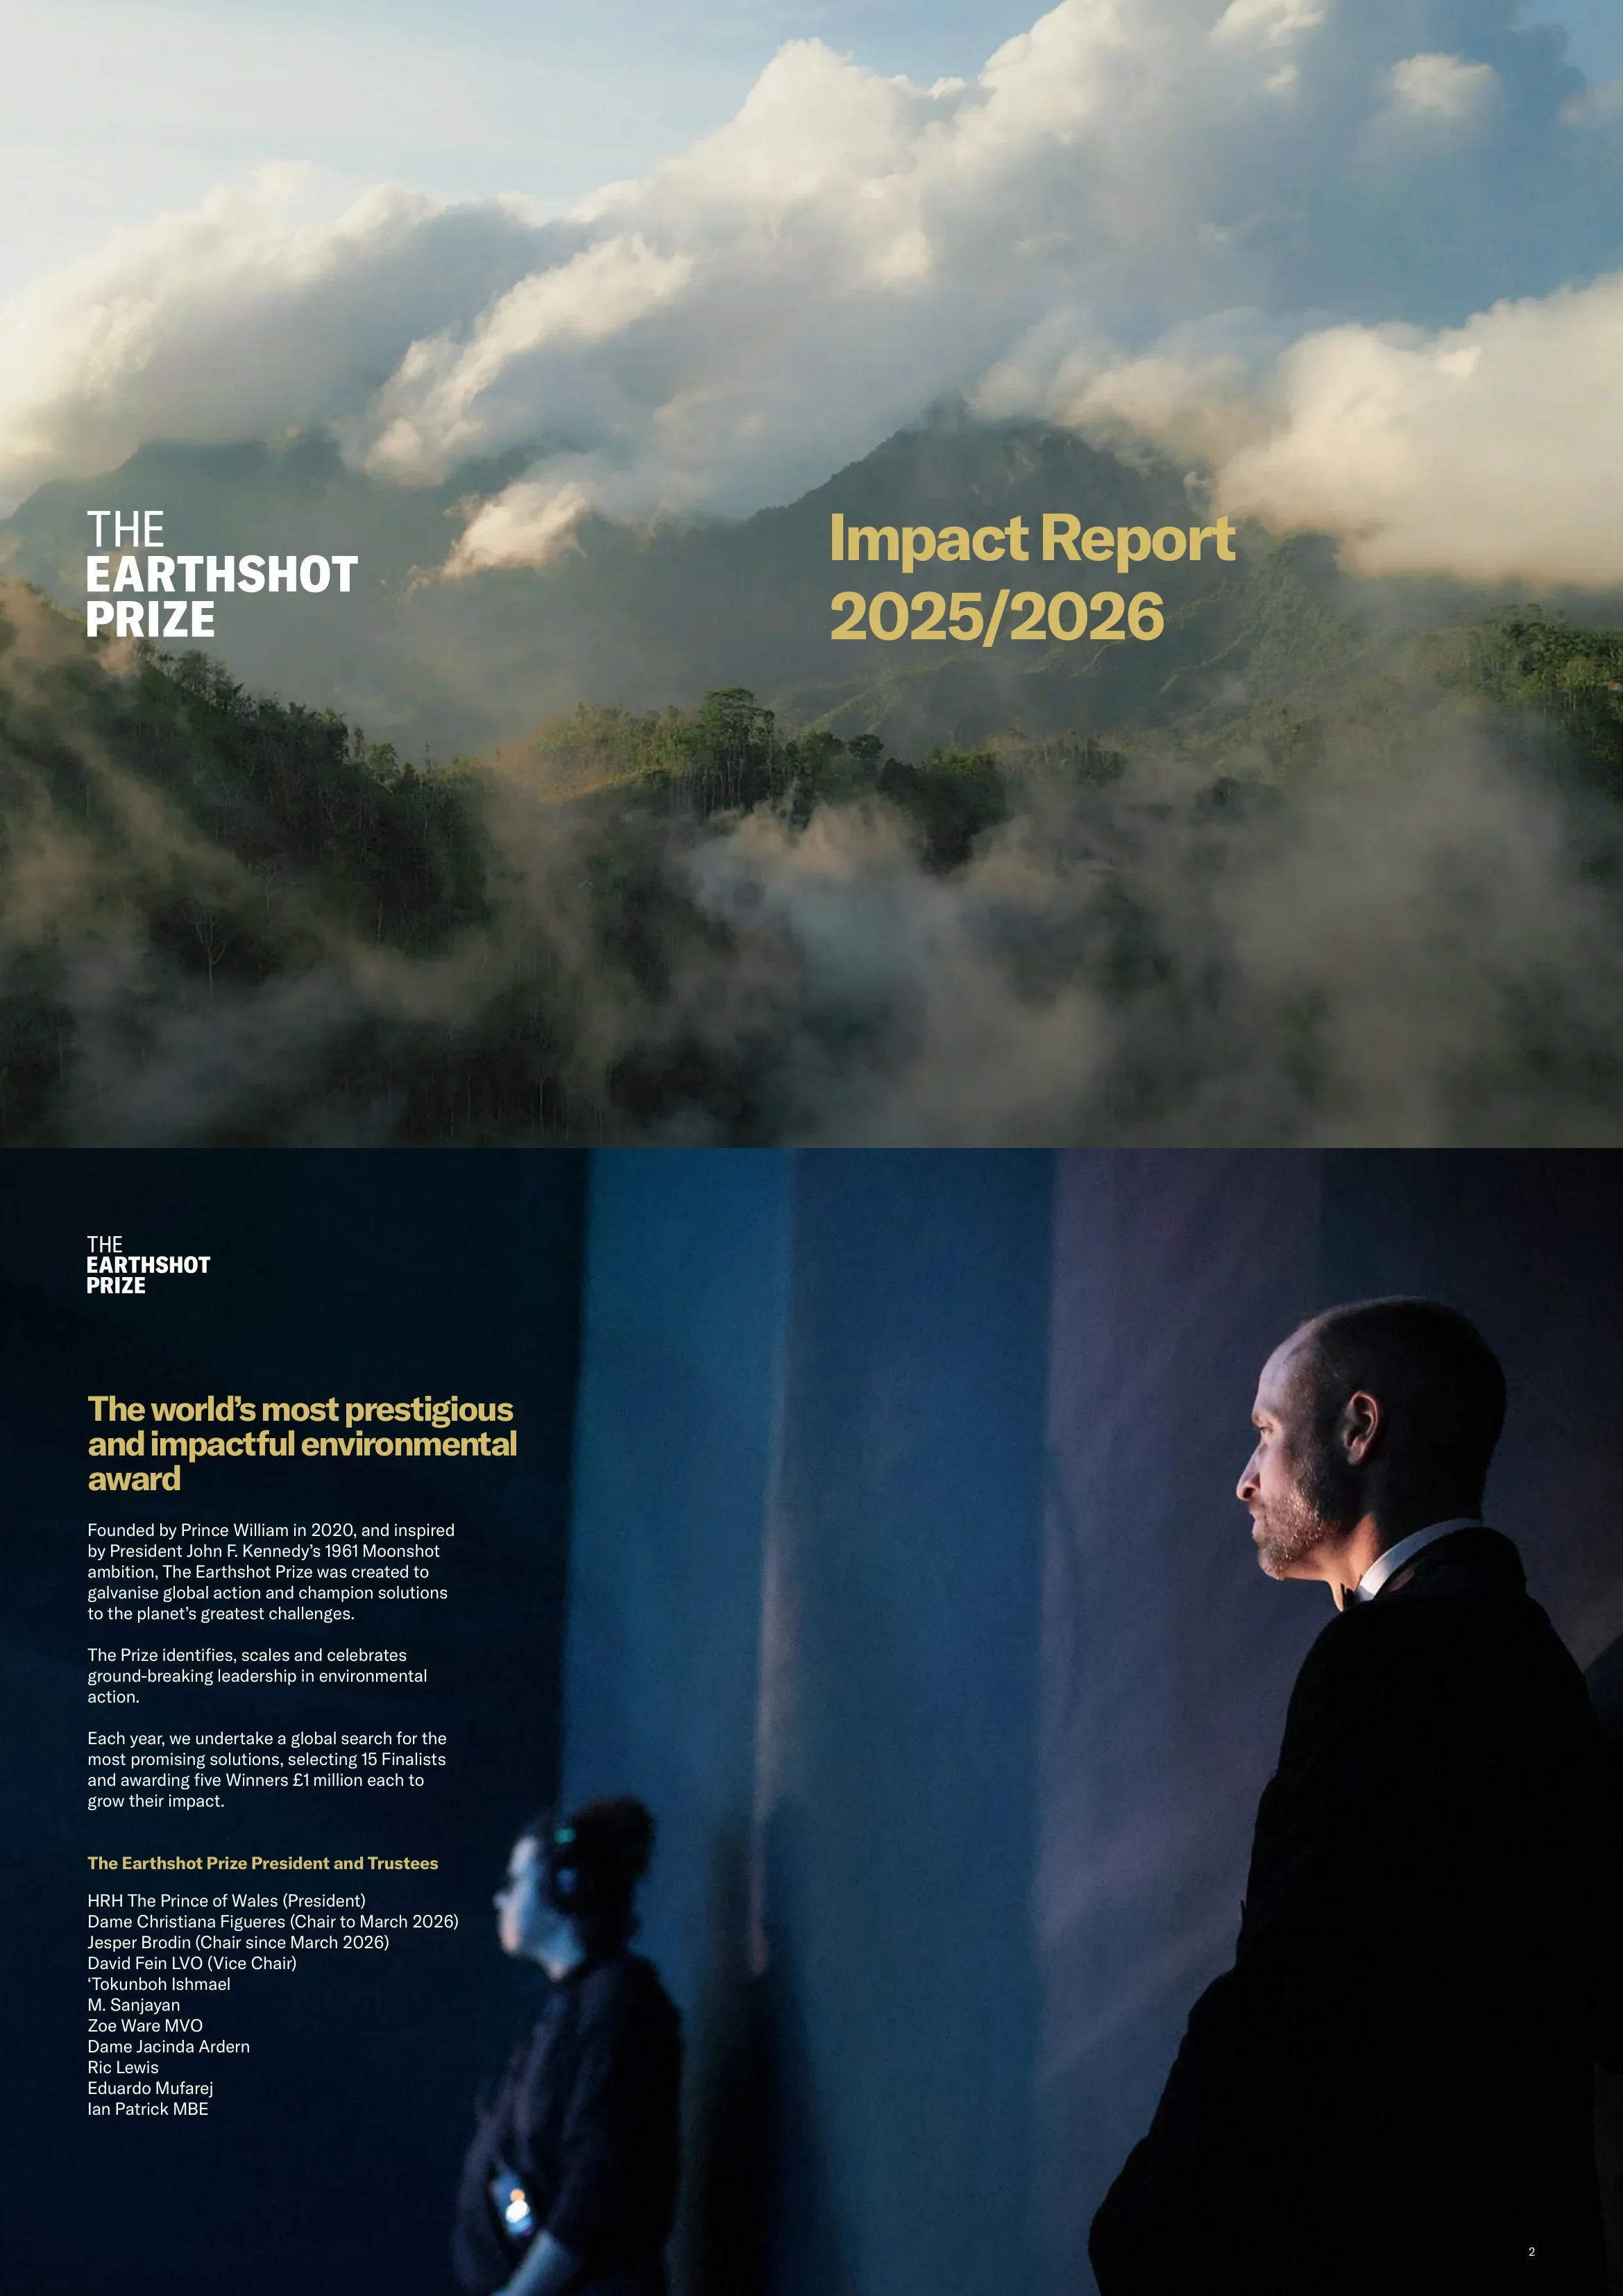
The Earthshot Prize Impact Report 2025-2026
56 slides
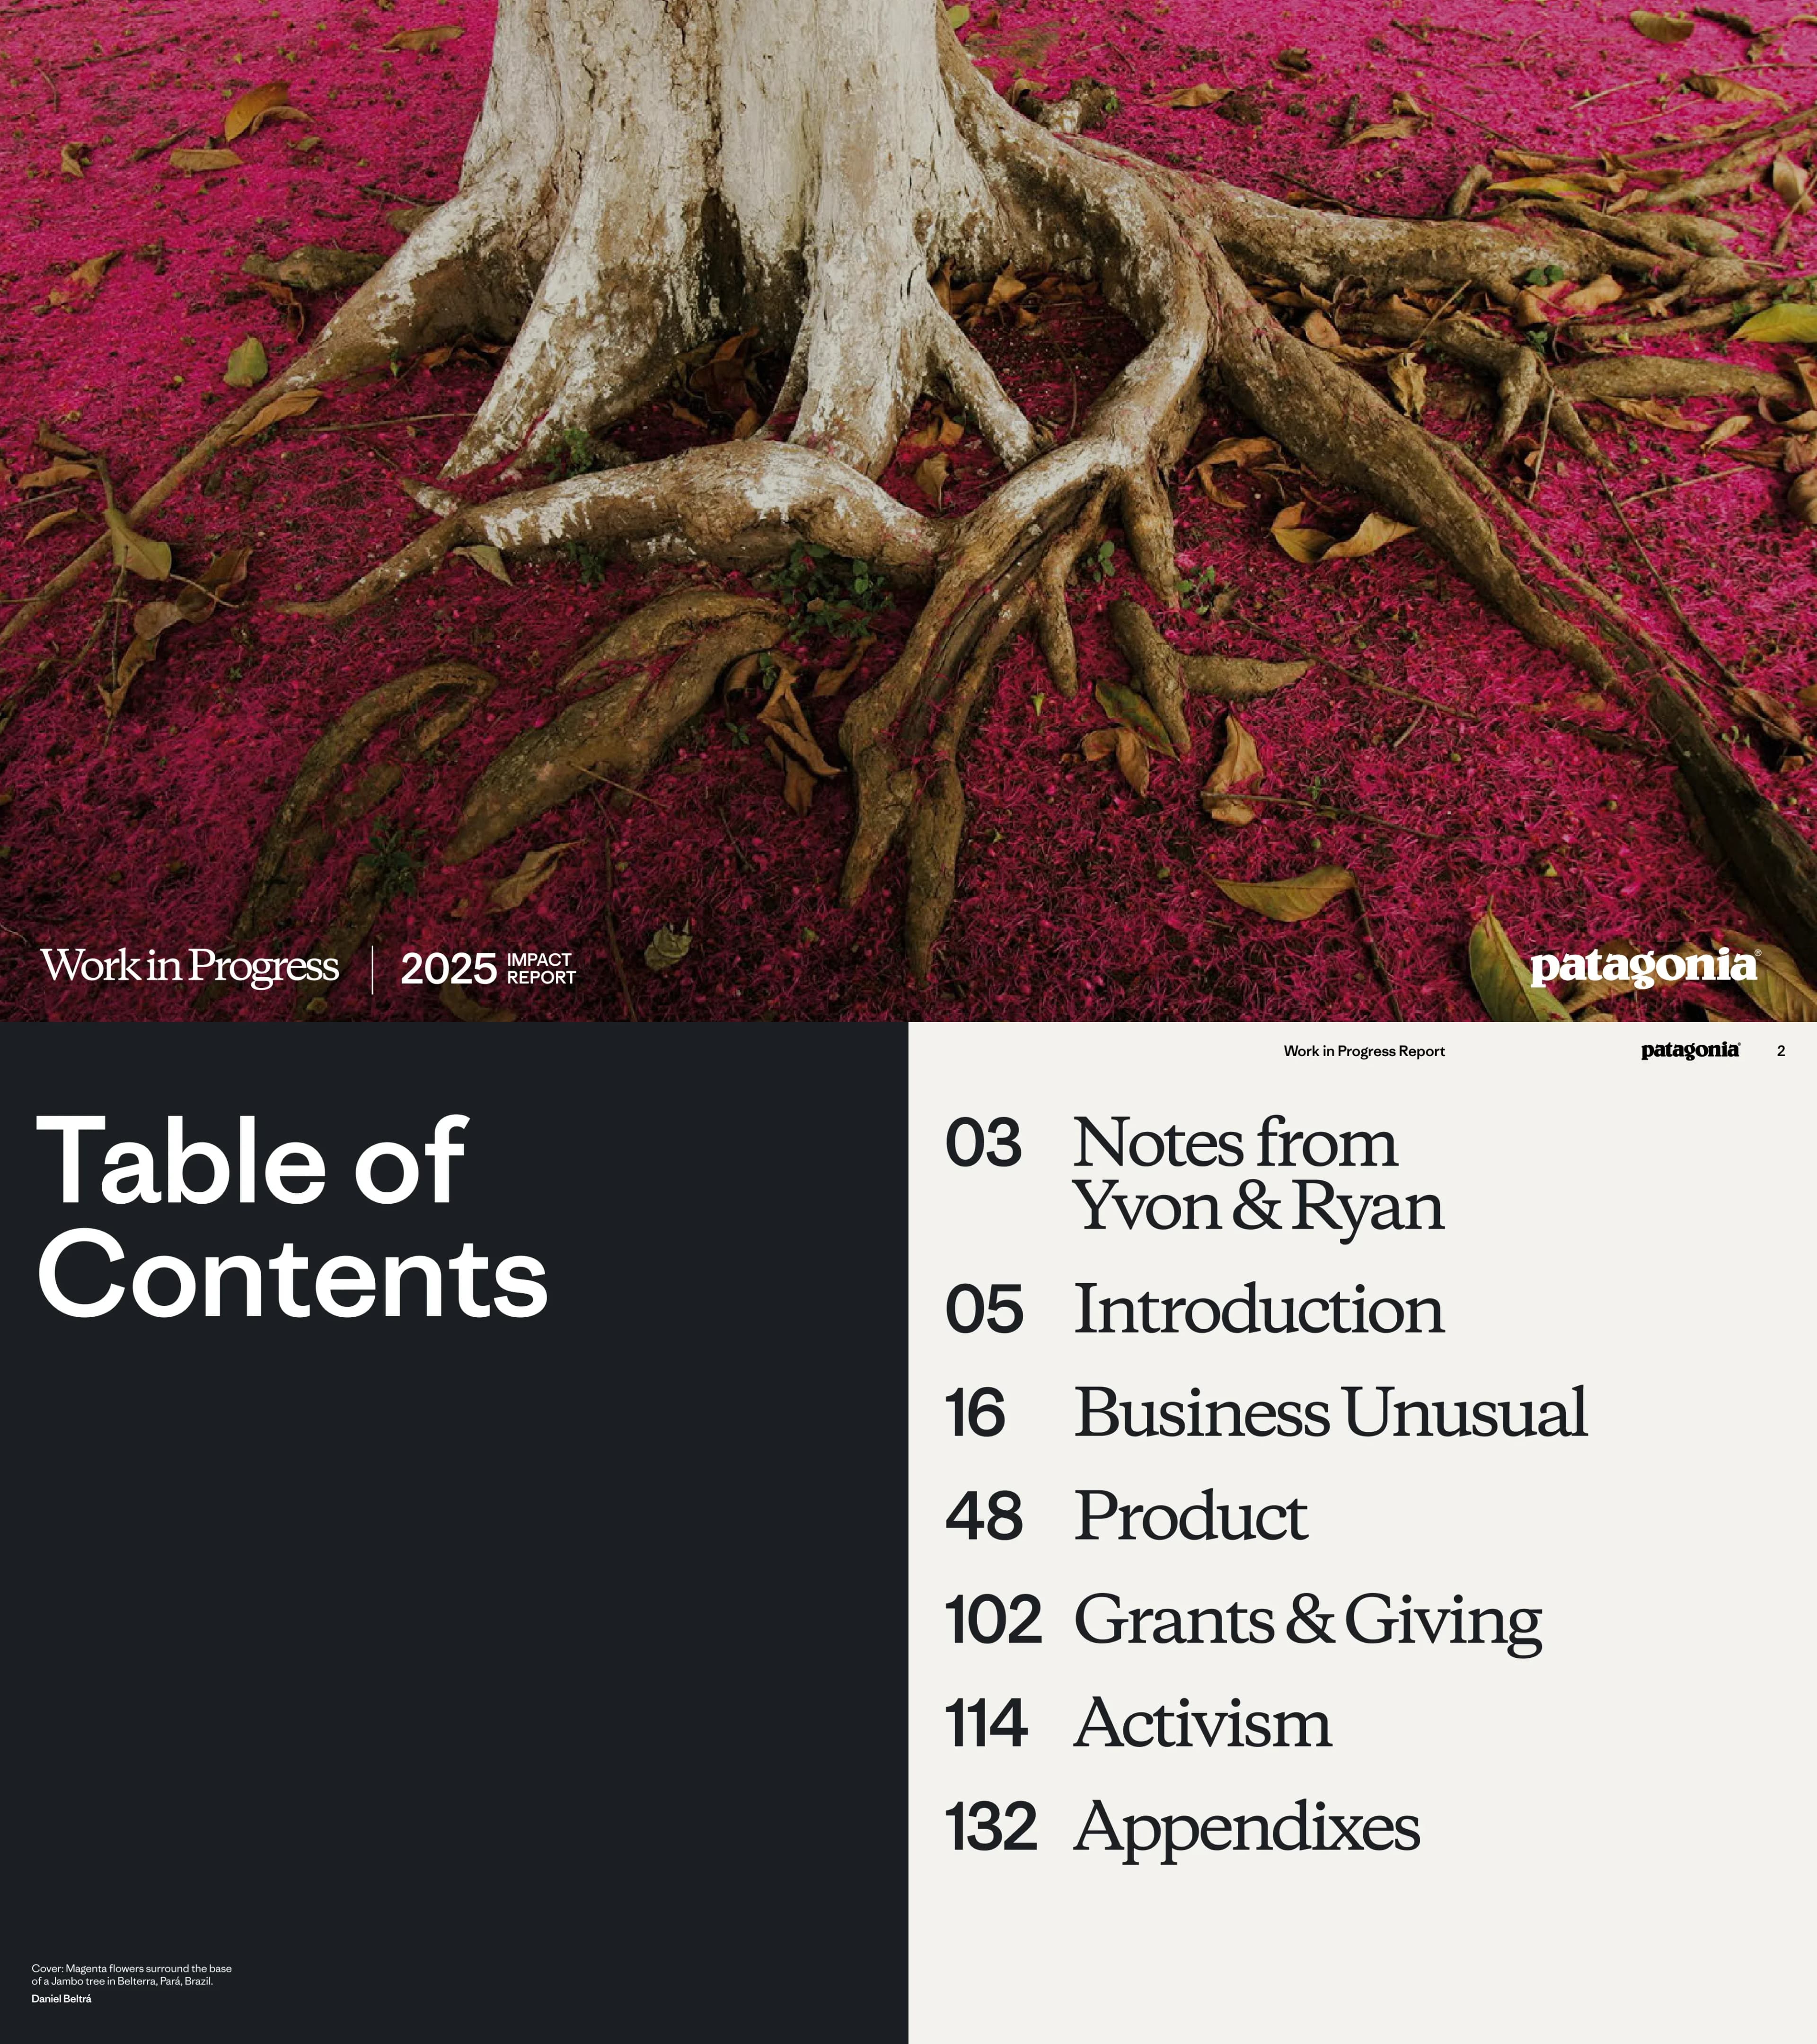
Patagonia 2025 Impact Report
154 slides
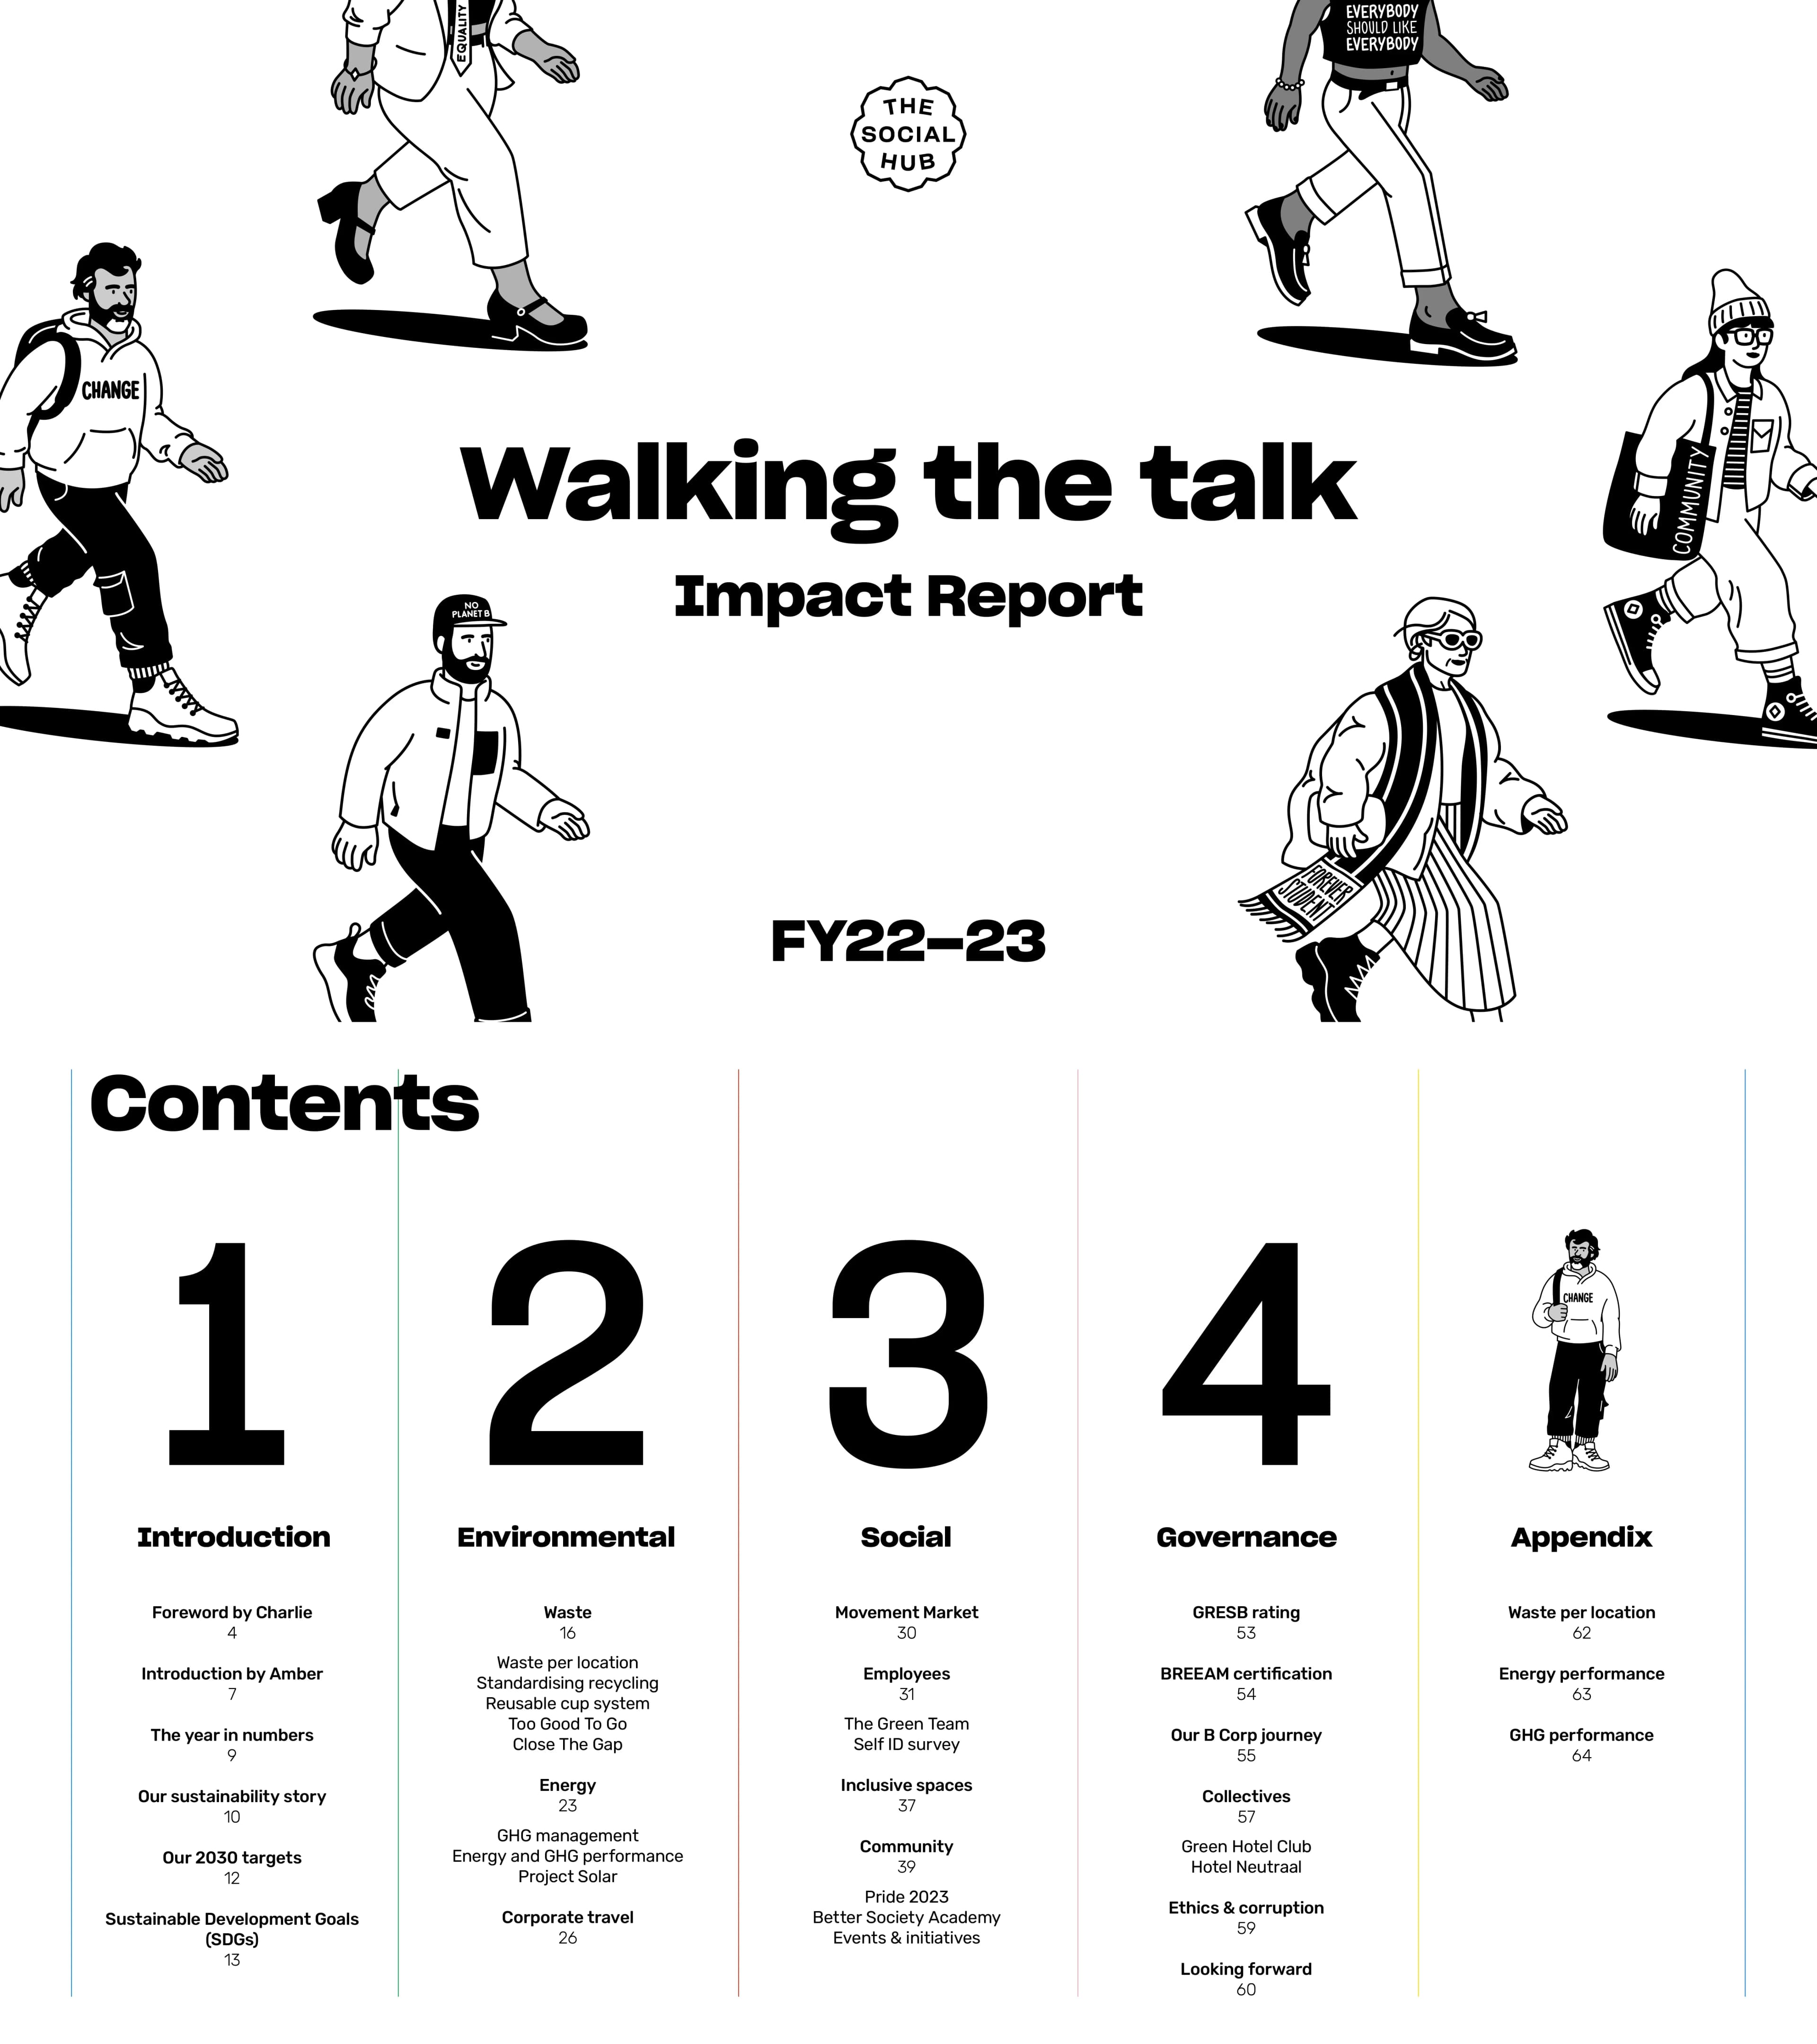
The Social Hub Impact Report FY22-23
65 slides
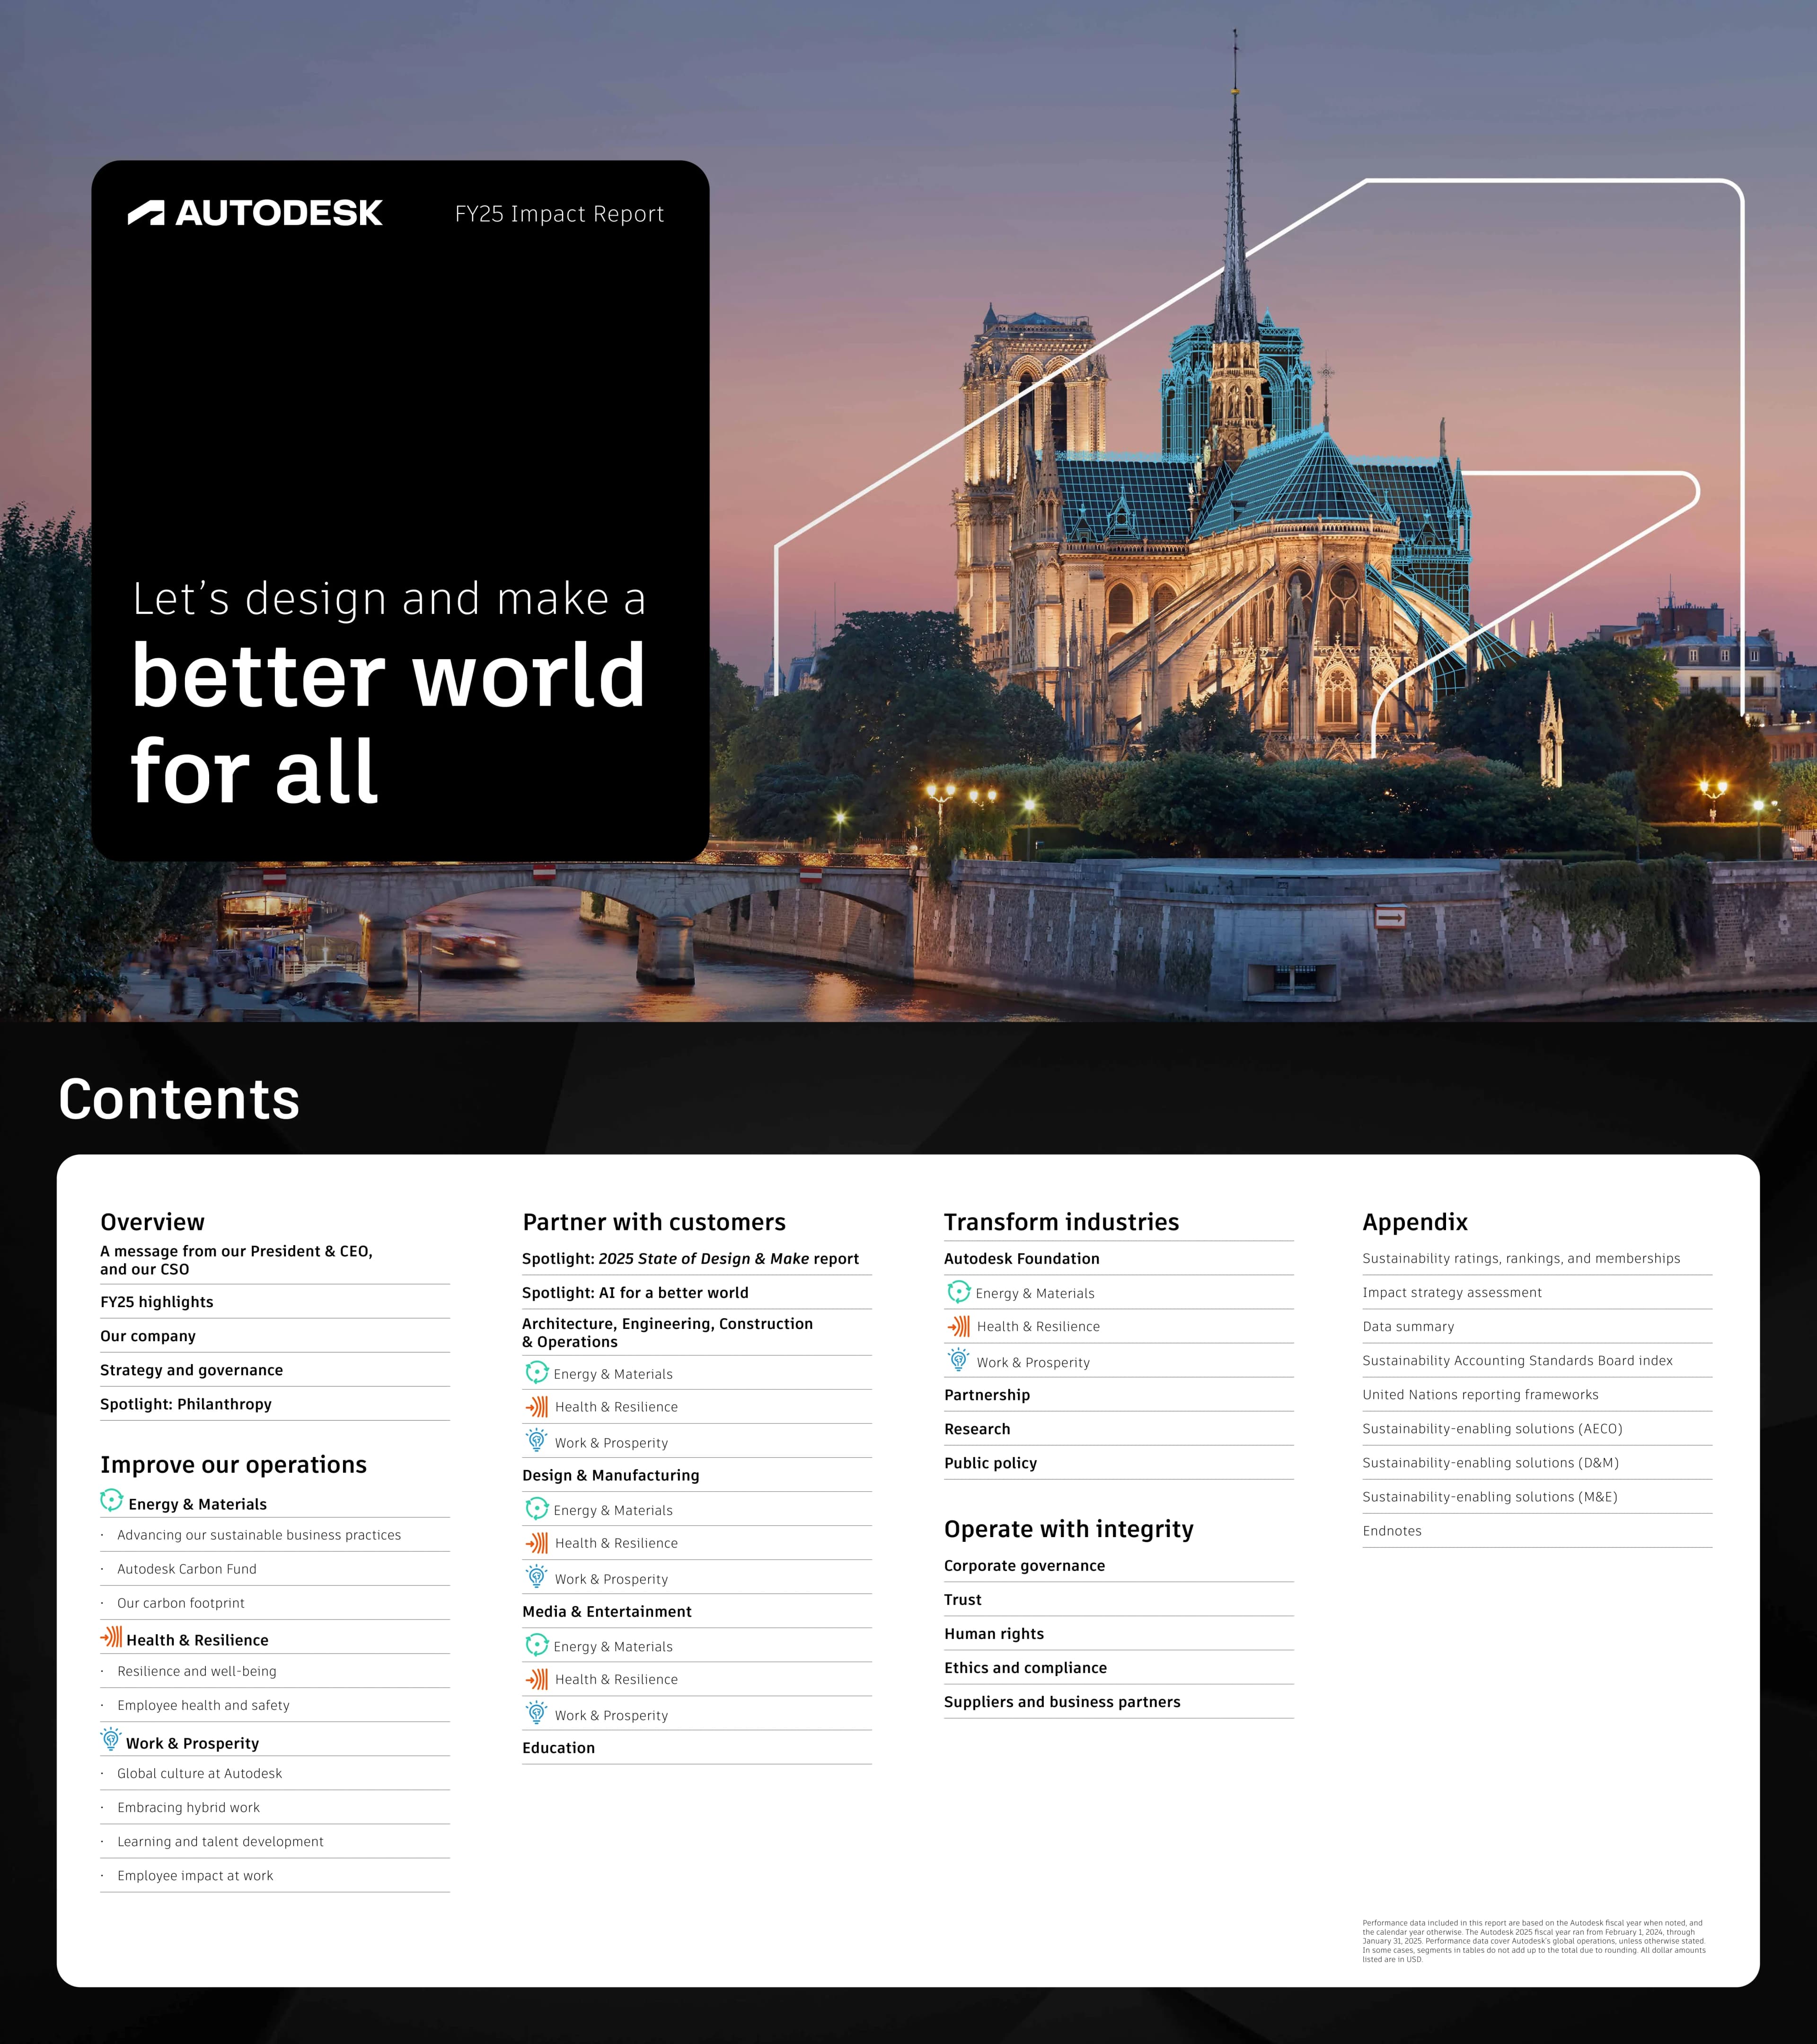
Autodesk FY25 Impact Report
113 slides
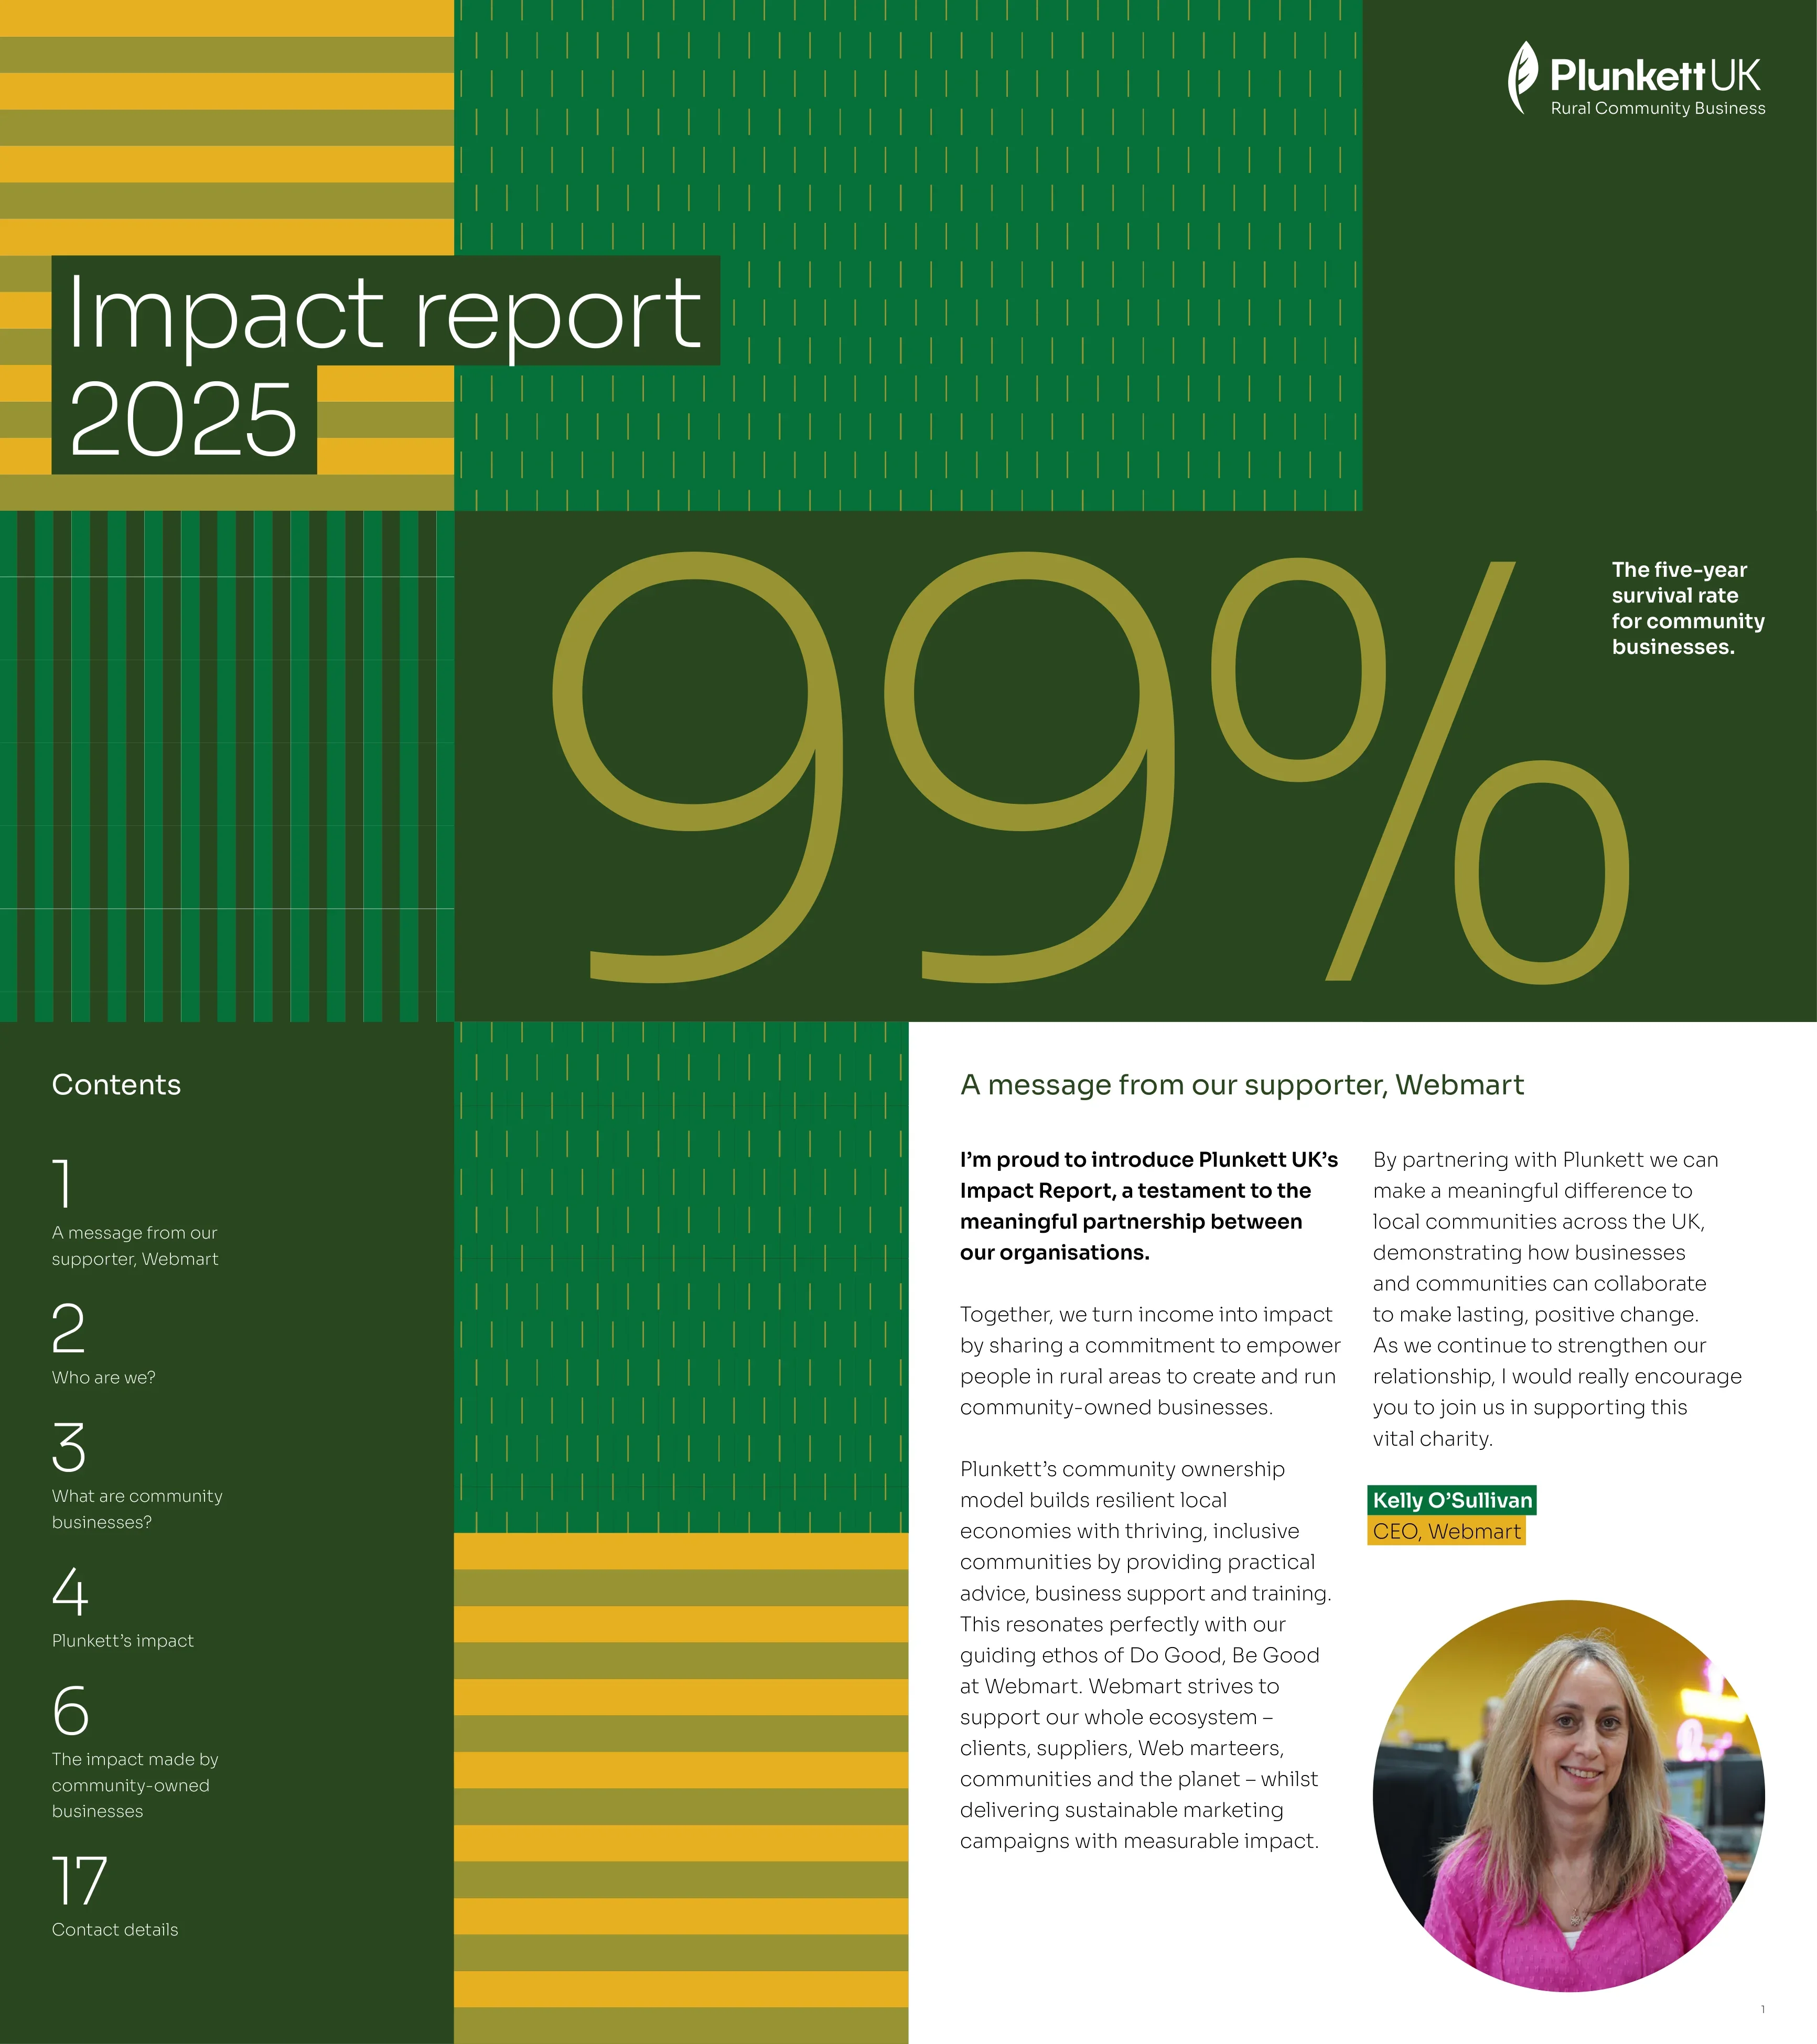
Plunkett UK Impact Report 2025
18 slides

Aesop Impact Report 2023 - Sustainability and Social Impact Journey
57 slides
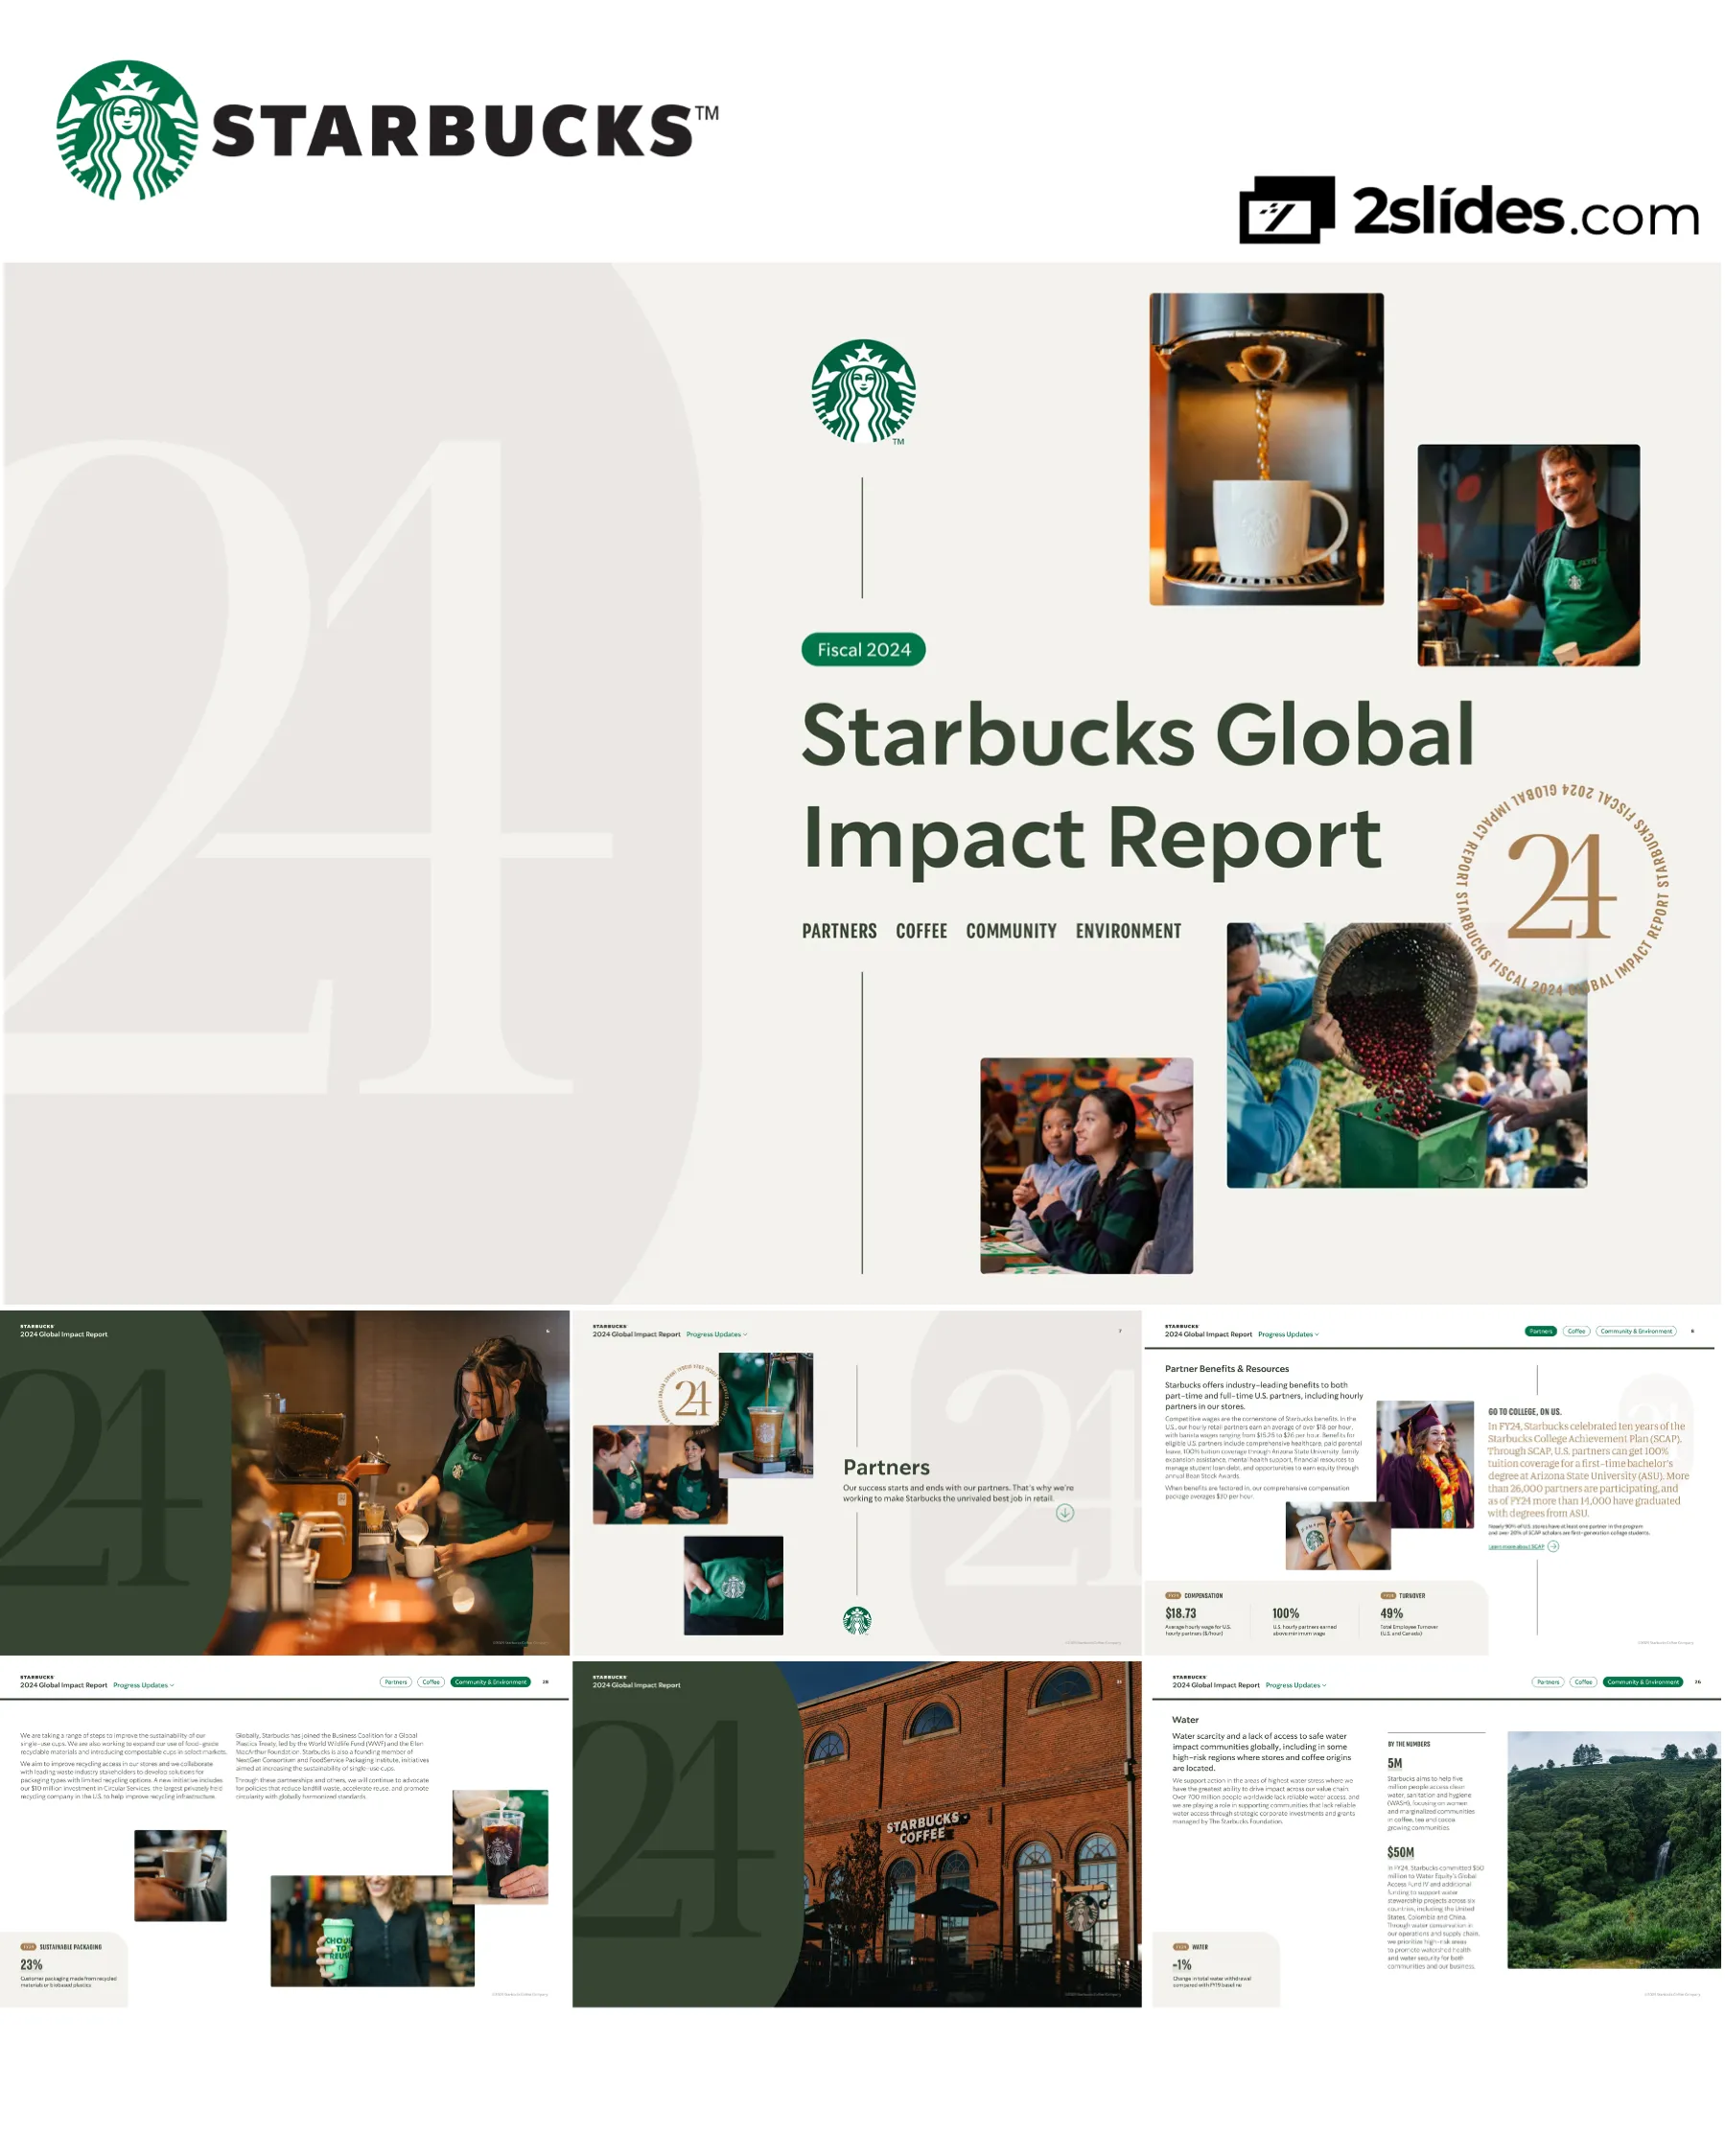
Starbucks PPT: Fiscal 2024 Global Impact Report
53 slides
Why ESG reports are often designed as decks
Many companies now publish their sustainability report in a landscape, slide-style layout rather than as a portrait document. It reads well on a screen, works as a presentation for investors and employees, and lets each commitment have its own page. The reports here follow the common structure: a message from leadership, the material topics and targets, progress on environment, social and governance, and a data appendix mapped to frameworks such as GRI, SASB and TCFD. They are published by the companies themselves, usually once a year, and each deck shows the reporting period it covers.
An ESG report has to turn hundreds of data points into a story people will read. These decks show how companies do it: a few headline targets up front, one page per commitment, and the detailed data held back for the appendix.
Anatomy of an ESG report deck
- 01
Leadership message and highlights
A letter from the CEO or chief sustainability officer, followed by the year's key numbers on a single page.
- 02
Strategy and material topics
The issues that matter most to the business and its stakeholders, usually shown as a materiality matrix, with the targets set for each.
- 03
Environment
Scope 1, 2 and 3 emissions against a baseline year, renewable energy, water and waste, and the path to net zero.
- 04
People and communities
Workforce, health and safety, diversity and inclusion, supply chain standards and community programmes.
- 05
Governance and data appendix
Board oversight, ethics and risk, followed by data tables and an index to the reporting frameworks used.
Frequently asked questions
Where do these decks come from?
- They are sustainability, climate and impact reports that the companies published themselves, mostly on their websites. The slides are unchanged.
What is the difference between an ESG report, a sustainability report and an impact report?
- The terms overlap. An ESG report is usually written with investors in mind and follows a set of metrics. A sustainability report covers the same ground for a wider audience. An impact report leads with outcomes for people and the planet, and is often written for customers too.
What are Scope 1, 2 and 3 emissions?
- Scope 1 covers emissions from sources a company owns, Scope 2 the electricity and heat it buys, and Scope 3 everything else in its value chain, from suppliers to the use of its products. Scope 3 is usually by far the largest.
Which reporting frameworks do these reports use?
- Most refer to GRI, SASB and the TCFD recommendations, which are now part of the ISSB standards. European companies also report under the EU's CSRD. Each deck usually ends with an index that maps its content to these frameworks.
Can I use these as a template?
- Download the PPTX and reuse the layouts, chart types and section order. Replace the figures and branding with your own: the logos, trademarks and data belong to the companies that published them.
Turn your sustainability data into a report deck
Upload last year's report, your emissions data or your ESG policies, and 2Slides drafts the presentation for you: highlights, targets, progress and data, ready to edit.


