
Part of Investor presentation examples · Indian investor presentation examples
Zydus Lifesciences Q2 FY27 Earnings Presentation (4 November 2026): the Indian pharmaceutical company's results for the quarter ended 30 September 2026 (July–September 2026, the second quarter of its April–March fiscal year), filed with BSE/NSE. Revenues from operations rose 29% YoY to ₹79,096 million (Rs. mn), EBITDA was ₹18,945 million at a 24.0% margin (down 6.0% YoY), and reported net profit was ₹9,255 million (down 26.6% YoY). The 15-slide deck covers India, North America and International Markets formulations, Consumer Wellness, innovation and pipeline updates, ESG ratings and the full consolidated P&L.
Uses this deck’s cover as a style reference for slides made from your own content. Or pick any page below to use its layout as the reference.
Quick Navigation
Tags
Share the slides
Zydus Lifesciences Q2 FY27 Earnings Presentation (4 November 2026): the Indian pharmaceutical company's results for the quarter ended 30 September 2026 (July–September 2026, the second quarter of its April–March fiscal year), filed with BSE/NSE. Revenues from operations rose 29% YoY to ₹79,096 million (Rs. mn), EBITDA was ₹18,945 million at a 24.0% margin (down 6.0% YoY), and reported net profit was ₹9,255 million (down 26.6% YoY). The 15-slide deck covers India, North America and International Markets formulations, Consumer Wellness, innovation and pipeline updates, ESG ratings and the full consolidated P&L.
Detailed view of each slide page, including layout, key content and visual elements.
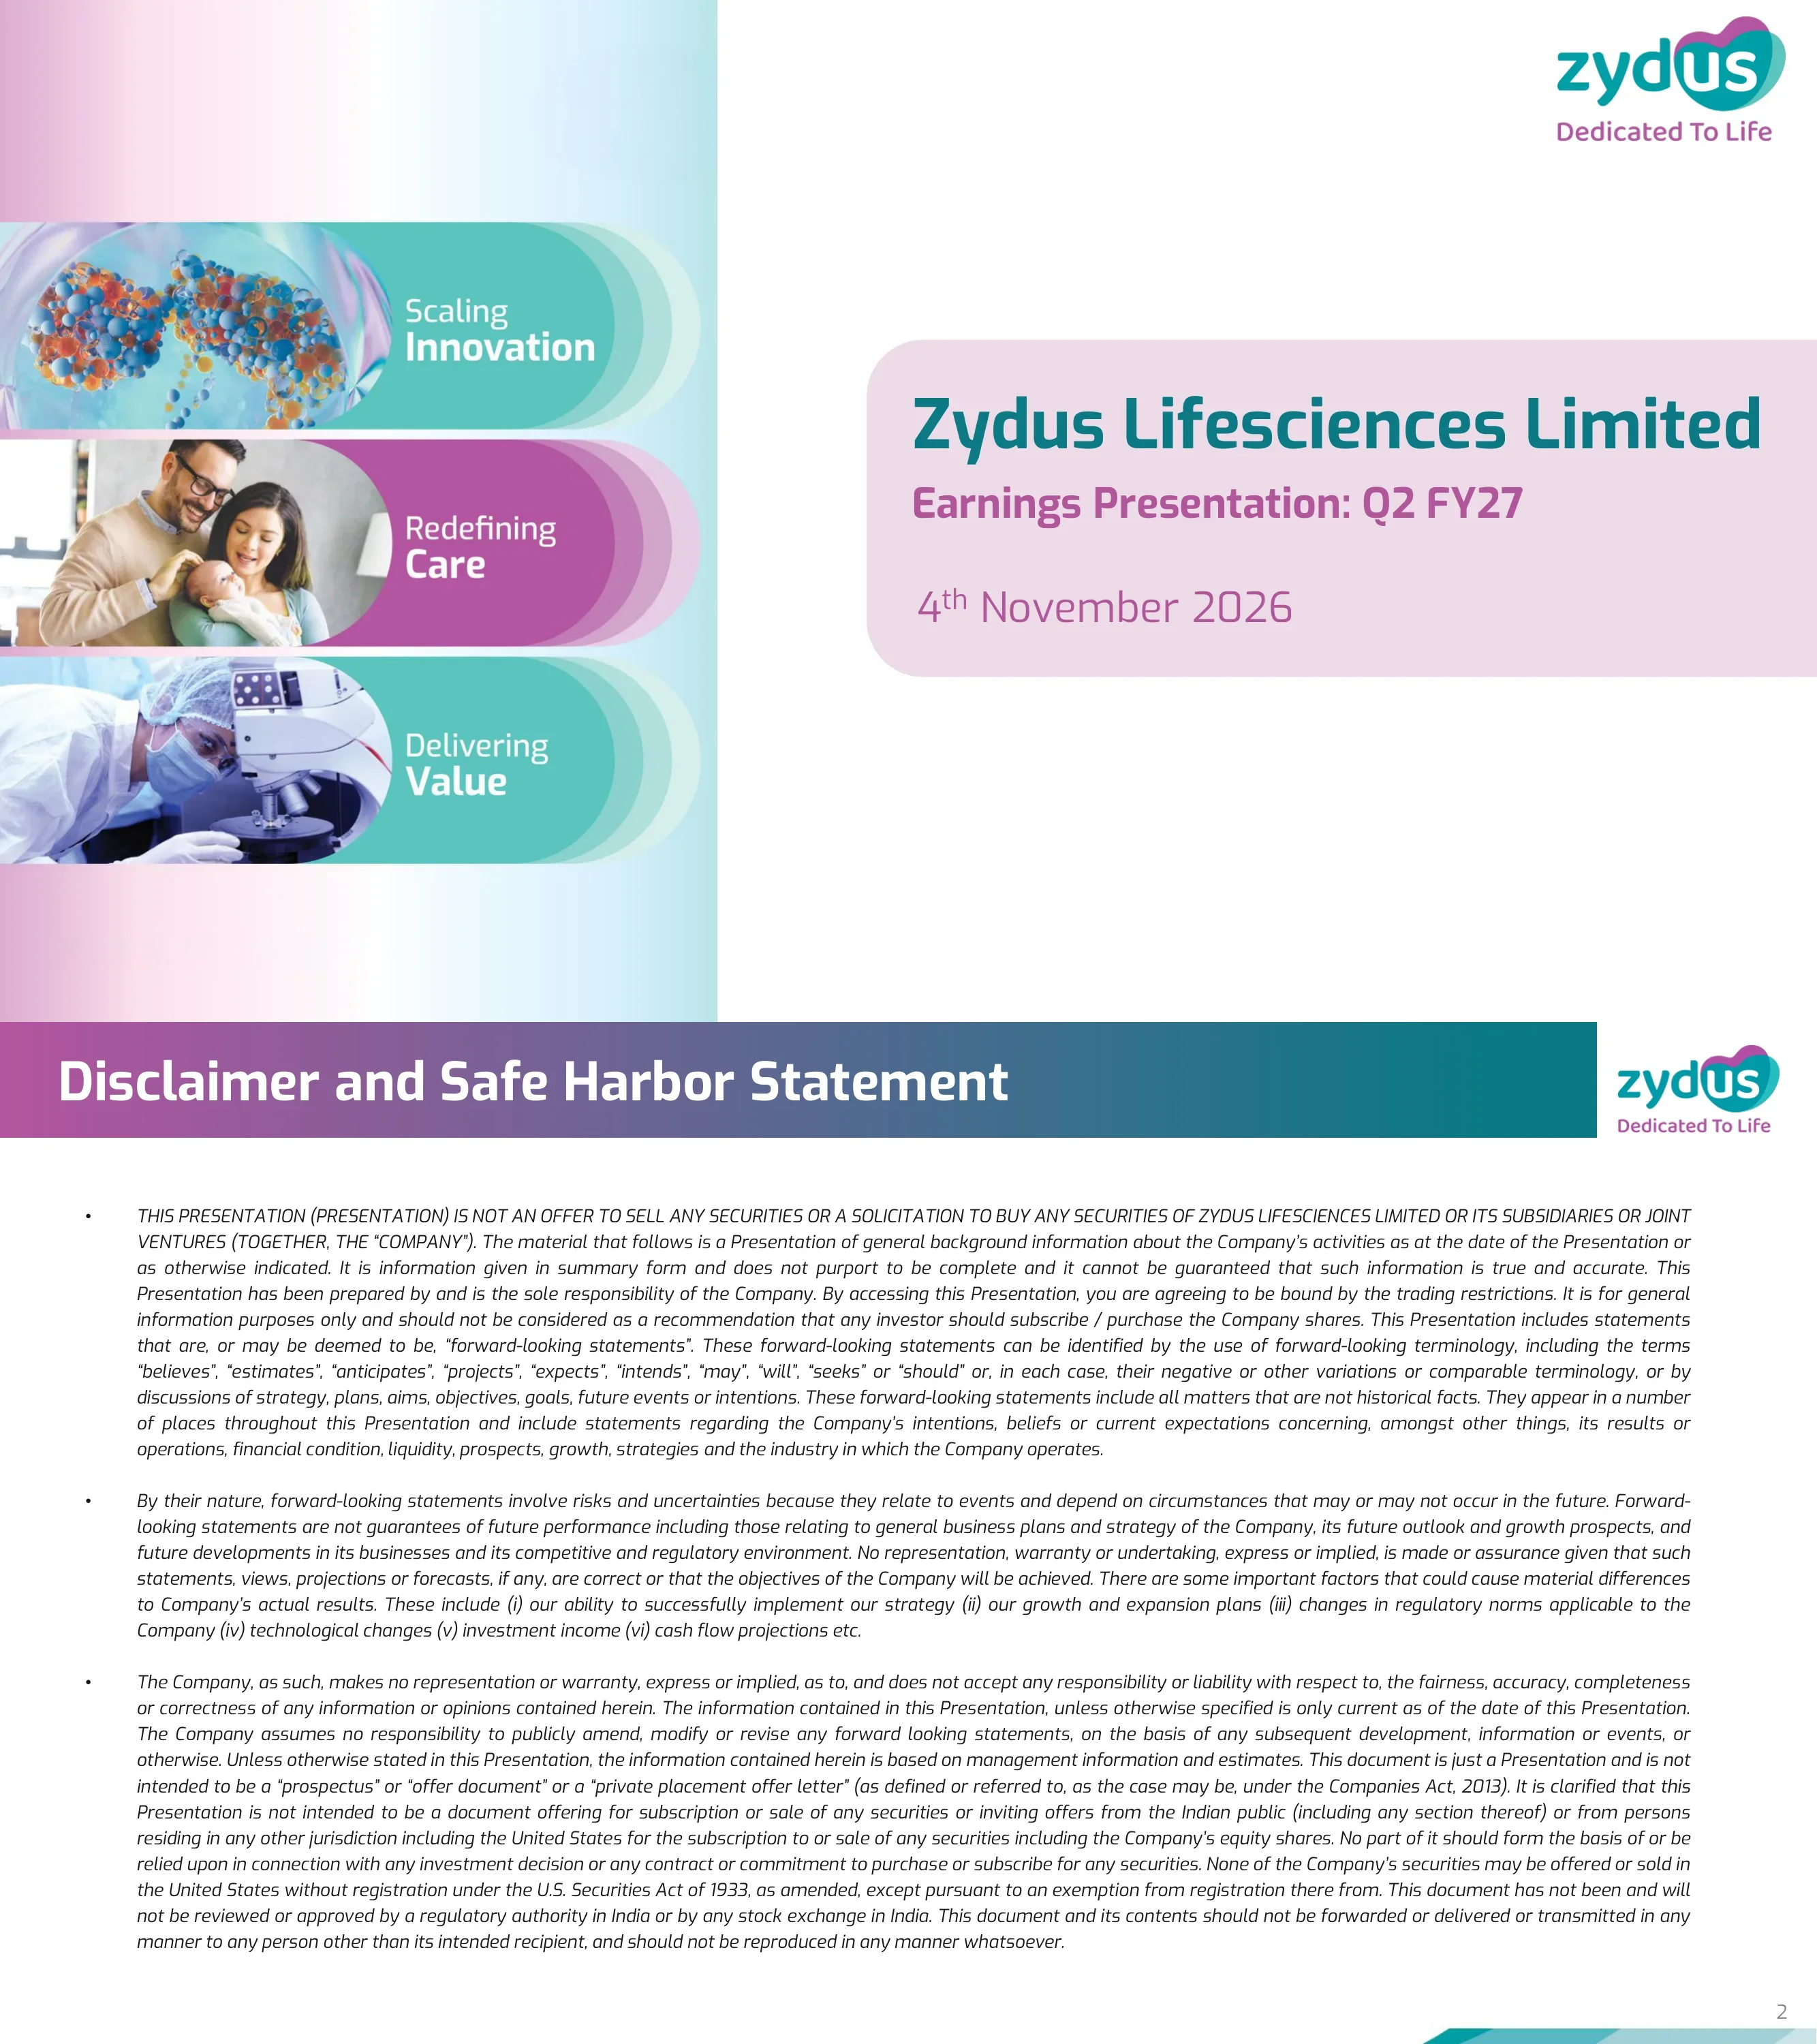
Cover slide titled 'Earnings Presentation: Q2 FY27', dated 4th November 2026, with the 'Dedicated To Life' Zydus logo and three brand pillars: Scaling Innovation, Redefining Care, Delivering Value.
Split layout: left third holds three stacked rounded image bands (molecules, a family with a baby, a lab scientist at a microscope) with teal and magenta overlays; right side has a pale pink rounded title panel and the logo top right.
Standard legal disclaimer: the presentation is not an offer to sell securities, contains forward-looking statements subject to risks (strategy execution, growth plans, regulatory changes, technology, investment income, cash flow projections), is not a prospectus under the Companies Act, 2013, and has not been reviewed by any Indian regulator or stock exchange.
Gradient title bar across the top with logo at right; three long justified italic bullet paragraphs fill the body.
Four KPI cards: revenues from operations ₹79,096 mn (+29% YoY), R&D ₹6,573 mn (8.3% of revenues), EBITDA ₹18,945 mn (24.0% margin, down 6.0% YoY) and net profit ₹9,255 mn (down 26.6% YoY). A donut chart breaks down sales of ₹77,544 mn (+28%): North America formulations 43% (+21%), India formulations 24% (+18%), Consumer Wellness 14% (+76%), IM formulations 13% (+33%), MedTech 3% (+47%), API & others 3% (+30%); pharma is 83% (+22%). Highlights note 19% YoY India branded growth, specialty scale-up in North America, organic capex of ₹4,655 mn and net debt of ₹51,998 mn at 30 September 2026. Regulatory updates: USFDA inspections at SEZ II Ahmedabad and Moraiya concluded with one and five observations, and a transdermal product was approved on 21 October 2026 after the Moraiya inspection.
Left half: 2x2 grid of teal-headed KPI cards above a business-wise sales donut with segment labels and green growth arrows; right half: 'Highlights of Q2 FY27' bullet list and a 'Regulatory Updates' box.
Five-quarter trends from Q2 FY26 to Q2 FY27. Total revenues: 61,232 / 68,645 / 75,870 / 80,170 / 79,096 (₹ mn). Gross profit: 44,327 / 50,282 / 56,107 / 57,772 / 57,552 with gross margin 72.4% / 73.2% / 74.0% / 72.1% / 72.8%. R&D: 4,820 / 6,074 / 6,982 / 6,424 / 6,573 at 7.9% / 8.8% / 9.2% / 8.0% / 8.3% of revenues. EBITDA: 20,158 / 18,164 / 25,544 / 19,294 / 18,945 with margin 32.9% / 26.5% / 33.7% / 24.1% / 24.0%.
Four equal quadrants, each with a teal title bar and a five-bar column chart; the current quarter bar is magenta, prior quarters teal; percentage pills sit above the bars for margin charts.
Five-quarter trends (Q2 FY26 to Q2 FY27): reported PAT 12,609 / 10,484 / 13,185 / 9,604 / 9,255 (₹ mn); organic capex 4,911 / 4,637 / 3,577 / 5,875 / 4,655; net debt to EBITDA 0.28x / 0.34x / 0.49x / 0.68x / 0.62x; net working capital (inventory, trade receivables and trade payables) 72,513 / 75,938 / 81,987 / 86,143 / 83,052.
Same four-quadrant grid of column charts as the previous slide, with a footnote defining net working capital.
India formulations sales rose to ₹18,844 mn in Q2 FY27 (from 15,926 in Q2 FY26), up 18.3% YoY and 3.8% QoQ, contributing 24% of revenue. The branded business grew 19% YoY, faster than the Indian pharma market (IPM), with 20% secondary sales growth, about two-thirds from volume and new products. Share gains in cardiology, diabetology, respiratory, dermatology, GI, anti-infectives, oncology and nephrology; leadership retained in oncology; chronic and sub-chronic share at 56.9%, up 450 bps over 4 years. Brand-value tiers show 20 mother brands above ₹1,000 mn, 29 at ₹500–1,000 mn and 28 at ₹250–500 mn. Therapy mix: cardio-diabeto 18%, respiratory 13%, AI 12%, onco 10%, nephro 9%, GI 9%, others 8%, pain 7%, gynaec 5%, derma 5%, VMN 4% (AWACS MAT September 2026).
Left: five-quarter sales bar chart, YoY/QoQ growth bracket, revenue-contribution donut and growth-driver box; lower left: brand-value tier table and therapy-wise donut; right column: 'Highlights for the quarter' bullets.
North America formulations sales reached ₹33,145 mn (US$347 mn), up 20.8% YoY and 7.0% QoQ, 43% of revenue; prior quarters were US$313 / 314 / 323 / 327 mn. US generics gained share through volume and launches: 5 new products in the quarter and the first generic Riociguat tablets launched in October 2026. ANDA counts: Q2 FY27 4 filings and 12 approvals; H1 FY27 9 filings and 22 approvals; cumulative 516 filings and 455 approvals (approvals include 2, 7 and 31 tentative approvals respectively). US specialty delivered strong sequential growth on Rolvedon and the 505(b)(2) portfolio.
Left: sales bar chart with US$ values inside bars, growth callouts, 43% contribution donut and growth drivers; bottom band: three paired filing/approval bar charts; right: US Generics and US Specialty highlight sections.
IM formulations sales grew to ₹10,009 mn from 7,513 a year earlier (7,881 / 8,041 / 9,735 in between), up 33.2% YoY and 2.8% QoQ, 13% of revenue. Growth was broad-based across emerging markets and Europe; EM followed a focused, therapy-led approach and Europe focused on broadening the portfolio and market coverage.
Top-left sales bar chart and growth callouts, centre contribution donut with growth-driver box, right-hand highlights; lower half of the slide is intentionally empty.
Consumer Wellness sales were ₹11,223 mn, up 76.1% YoY but down 21.5% QoQ (14,292 in Q1 FY27), 14% of revenue. Domestic business grew 29% YoY; skin and hair care grew 37% and food and nutrition 25%; organized channels reached 38% of sales in H1 FY27 (modern trade 15%, e-commerce 23%); international business including CCL grew 12% like-for-like. Brand table (Nielsen and IQVIA MAT Sep 2026): Glucon-D 60.0% share, rank 1; Nycil 32.8%, rank 1; Sugar Free 96.0%, rank 1; Everyuth facial cleansing 8.4% rank 4, scrub 50.2% rank 1, peel-off 75.6% rank 1; Complan 3.9%, rank 4; Nutralite fat spread rank 1 (company estimate); RiteBite nutrition and protein bars and protein cookies and chips rank 1 (company estimates).
Upper half mirrors the segment template (bar chart, growth callouts, donut, drivers, highlights); lower band is a brand-logo table with market-share and market-rank pill rows grouped by brand family.
NCE research: new Phase III analysis of Saroglitazar Magnesium in primary biliary cholangitis presented at ACG 2026, and completion of the EVIDENCES-X global Phase II(b) trial in MASH. Biotech: approval to start Phase III trials for one monoclonal antibody in India. 505(b)(2) and specialty: USFDA accepted for review the BLA of Pembrolizumab biosimilar FYB206 developed by partner Formycon AG, described as the first publicly announced Keytruda biosimilar filing accepted in the US. Other: Sentynl Therapeutics licensed Alvelestat from Mereo BioPharma for Phase III development in AATD-associated lung disease.
Text-only slide with magenta section headers (Innovation Updates, Other Updates) and dark-teal sub-headers (NCE Research, Biotech R&D, 505(b)(2) and Specialty) over bullet points.
Company fact sheet: over US$3 bn global revenues (FY26, at ₹88.33/US$), US$13.1 bn market capitalization (3 November 2026, at ₹94.70/US$), ~57% of revenues from branded businesses, 3rd largest generic company in the US by prescriptions, among the top 3 in ~60% of product families marketed in the US, 7 brands in India's top 300, 44 manufacturing sites, 10 R&D centres, ~30,000 employees including more than 1,500 R&D scientists, and three firsts: Bilypsa (Saroglitazar) for MASH in India, Oxemia (Desidustat) oral drug for CKD anemia, and Tishtha, the world's first Nivolumab biosimilar, launched in India.
3x4 grid of rounded pill cards, each with a large circular numeral badge on the left and a short descriptor on the right; numbered source footnotes at bottom.
NSE Sustainability Ratings & Analytics scores rose from 65 (2024) to 70 (2025) to 71/100 (2026), moving Zydus to the 'Leader' (top 10%) category from 'Aspiring', ranked among the top 2 in Indian pharma (results released 15 October 2026), with core ESG rating up to 68 from 66. CRISIL ESG scores rose from 59 to 61 to 66/100 ('Strong' category), top 4 in Indian pharma, with core ESG rating up to 70 from 64.
Two horizontal bands separated by a dashed line, each with a rater logo, a three-step chevron timeline of scores and bullet points on the right.
Reported P&L in ₹ mn: total income from operations 79,096 in Q2 FY27 vs 61,232 (+29.2% YoY) and 80,170 in Q1 (-1.3% QoQ); H1 FY27 1,59,266 vs 1,26,969 (+25.4%). Gross contribution 57,552 (72.8% margin). Employee costs 12,335 (+33.7%), R&D 6,573 (+36.4%), other operating expenses 21,065 (+47.7%), forex gain 1,366 vs 4,141. EBITDA 18,945 (-6.0% YoY; margin 24.0% vs 32.9%); H1 EBITDA 38,239 (-6.8%). Finance cost 1,870 (+84.6%), depreciation and amortization 6,045 (+101.3%), PBT 12,617 (-25.5%), tax 3,340, reported net profit 9,255 (-26.6% YoY, -3.6% QoQ); H1 net profit 18,859 (-30.9%).
Full-width table with teal header row, magenta-shaded current-period columns (Q2 FY27, H1 FY27), bold subtotal rows and a footnote that employee and other operating expenses exclude research-related costs.
Forex impact on operating transactions above the EBITDA line (₹ mn, '+' = loss, '-' = gain): included in COGS 93 in Q2 FY27 vs 365 in Q2 FY26 (H1: 85 vs 437); in other operating expenses -1,366 vs -4,141 (H1: -1,935 vs -4,712); total -1,273 vs -3,776 (H1: -1,850 vs -4,275), i.e. a much smaller forex gain than a year earlier.
Single compact table centred in the upper half of the slide, with magenta current-period columns and a teal total row; rest of the slide is white space.
Closing slide with investor contact Arvind Bothra, the company website and LinkedIn page, and the registered office at Zydus Corporate Park, Khoraj (Gandhinagar), Sarkhej-Gandhinagar Highway, Ahmedabad 382 481, Gujarat, India.
Gradient header strip, large teal 'Thank you' on the left above a rounded contact box with web and LinkedIn icons; registered office address on the right.
Common questions about this slide and the underlying presentation content.
It is Zydus Lifesciences' 15-slide investor presentation for the quarter ended 30 September 2026, dated 4 November 2026 and filed with BSE/NSE. It covers headline KPIs, five-quarter financial trends, each business segment, innovation and ESG updates, and the reported consolidated P&L.
Indian companies use an April–March fiscal year, so FY27 runs from April 2026 to March 2027 and Q2 FY27 covers July to September 2026. H1 FY27 is April to September 2026.
Revenues from operations were ₹79,096 million (+29% YoY), EBITDA was ₹18,945 million at a 24.0% margin (-6.0% YoY), R&D spend was ₹6,573 million (8.3% of revenues) and reported net profit was ₹9,255 million (-26.6% YoY). Net debt was ₹51,998 million at 30 September 2026.
Zydus reports this deck in ₹ million (Rs. mn), and the page keeps the company's own units. Divide by 10 to convert to ₹ crore, so ₹79,096 million equals about ₹7,910 crore. The P&L table also uses Indian digit grouping, e.g. 1,59,266.
North America formulations are the largest at 43% of sales (₹33,145 million, +20.8% YoY), followed by India formulations at 24% (+18.3%), Consumer Wellness at 14% (+76.1%), International Markets formulations at 13% (+33.2%), and MedTech and API at 3% each.
Yes. Its structure — KPI card summary, four-chart financial trend slides, a repeatable segment page with growth callouts and contribution donuts, a pipeline update and a full P&L table — works well for any multi-segment listed company's quarterly results. Replace the figures and branding with your own.
The presentation was filed with India's stock exchanges, BSE and NSE, and is also available on the investor section of zyduslife.com. The version here is the presentation itself, with the exchange cover letter removed.
The slides are Zydus Lifesciences' own published earnings presentation, reproduced for reference and design study. Its disclaimer states it is not an offer of securities and contains forward-looking statements, and nothing on this page is investment advice.

Create Your Own Slides
Turn your ideas into professional presentations in seconds with 2slides AI.
Reference professional designs, choose your style, and generate slides with perfect text rendering. Powered by Nano Banana—start creating your presentation now.
Your AI Agent for slides. Save time, shine faster with intelligent presentation creation.


© 2026 2slides. All rights reserved.