
Part of Investor presentation examples · Japanese investor presentation examples
Yokogawa Electric H1 FY2026 Earnings Presentation: first-half results for the fiscal year ending March 2027 (April 1 to September 30, 2026), a revised full-year forecast, and the CEO's progress update on the GS2028 mid-term plan. This is a Japanese-language deck (2027年3月期 第2四半期 決算説明会) dated November 4, 2026 and released on TDnet, the Tokyo Stock Exchange's timely disclosure system. All amounts are in ¥100 million (億円) unless noted.
Uses this deck’s cover as a style reference for slides made from your own content. Or pick any page below to use its layout as the reference.
Quick Navigation
Tags
Share the slides
Yokogawa Electric H1 FY2026 Earnings Presentation: first-half results for the fiscal year ending March 2027 (April 1 to September 30, 2026), a revised full-year forecast, and the CEO's progress update on the GS2028 mid-term plan. This is a Japanese-language deck (2027年3月期 第2四半期 決算説明会) dated November 4, 2026 and released on TDnet, the Tokyo Stock Exchange's timely disclosure system. All amounts are in ¥100 million (億円) unless noted.
Detailed view of each slide page, including layout, key content and visual elements.
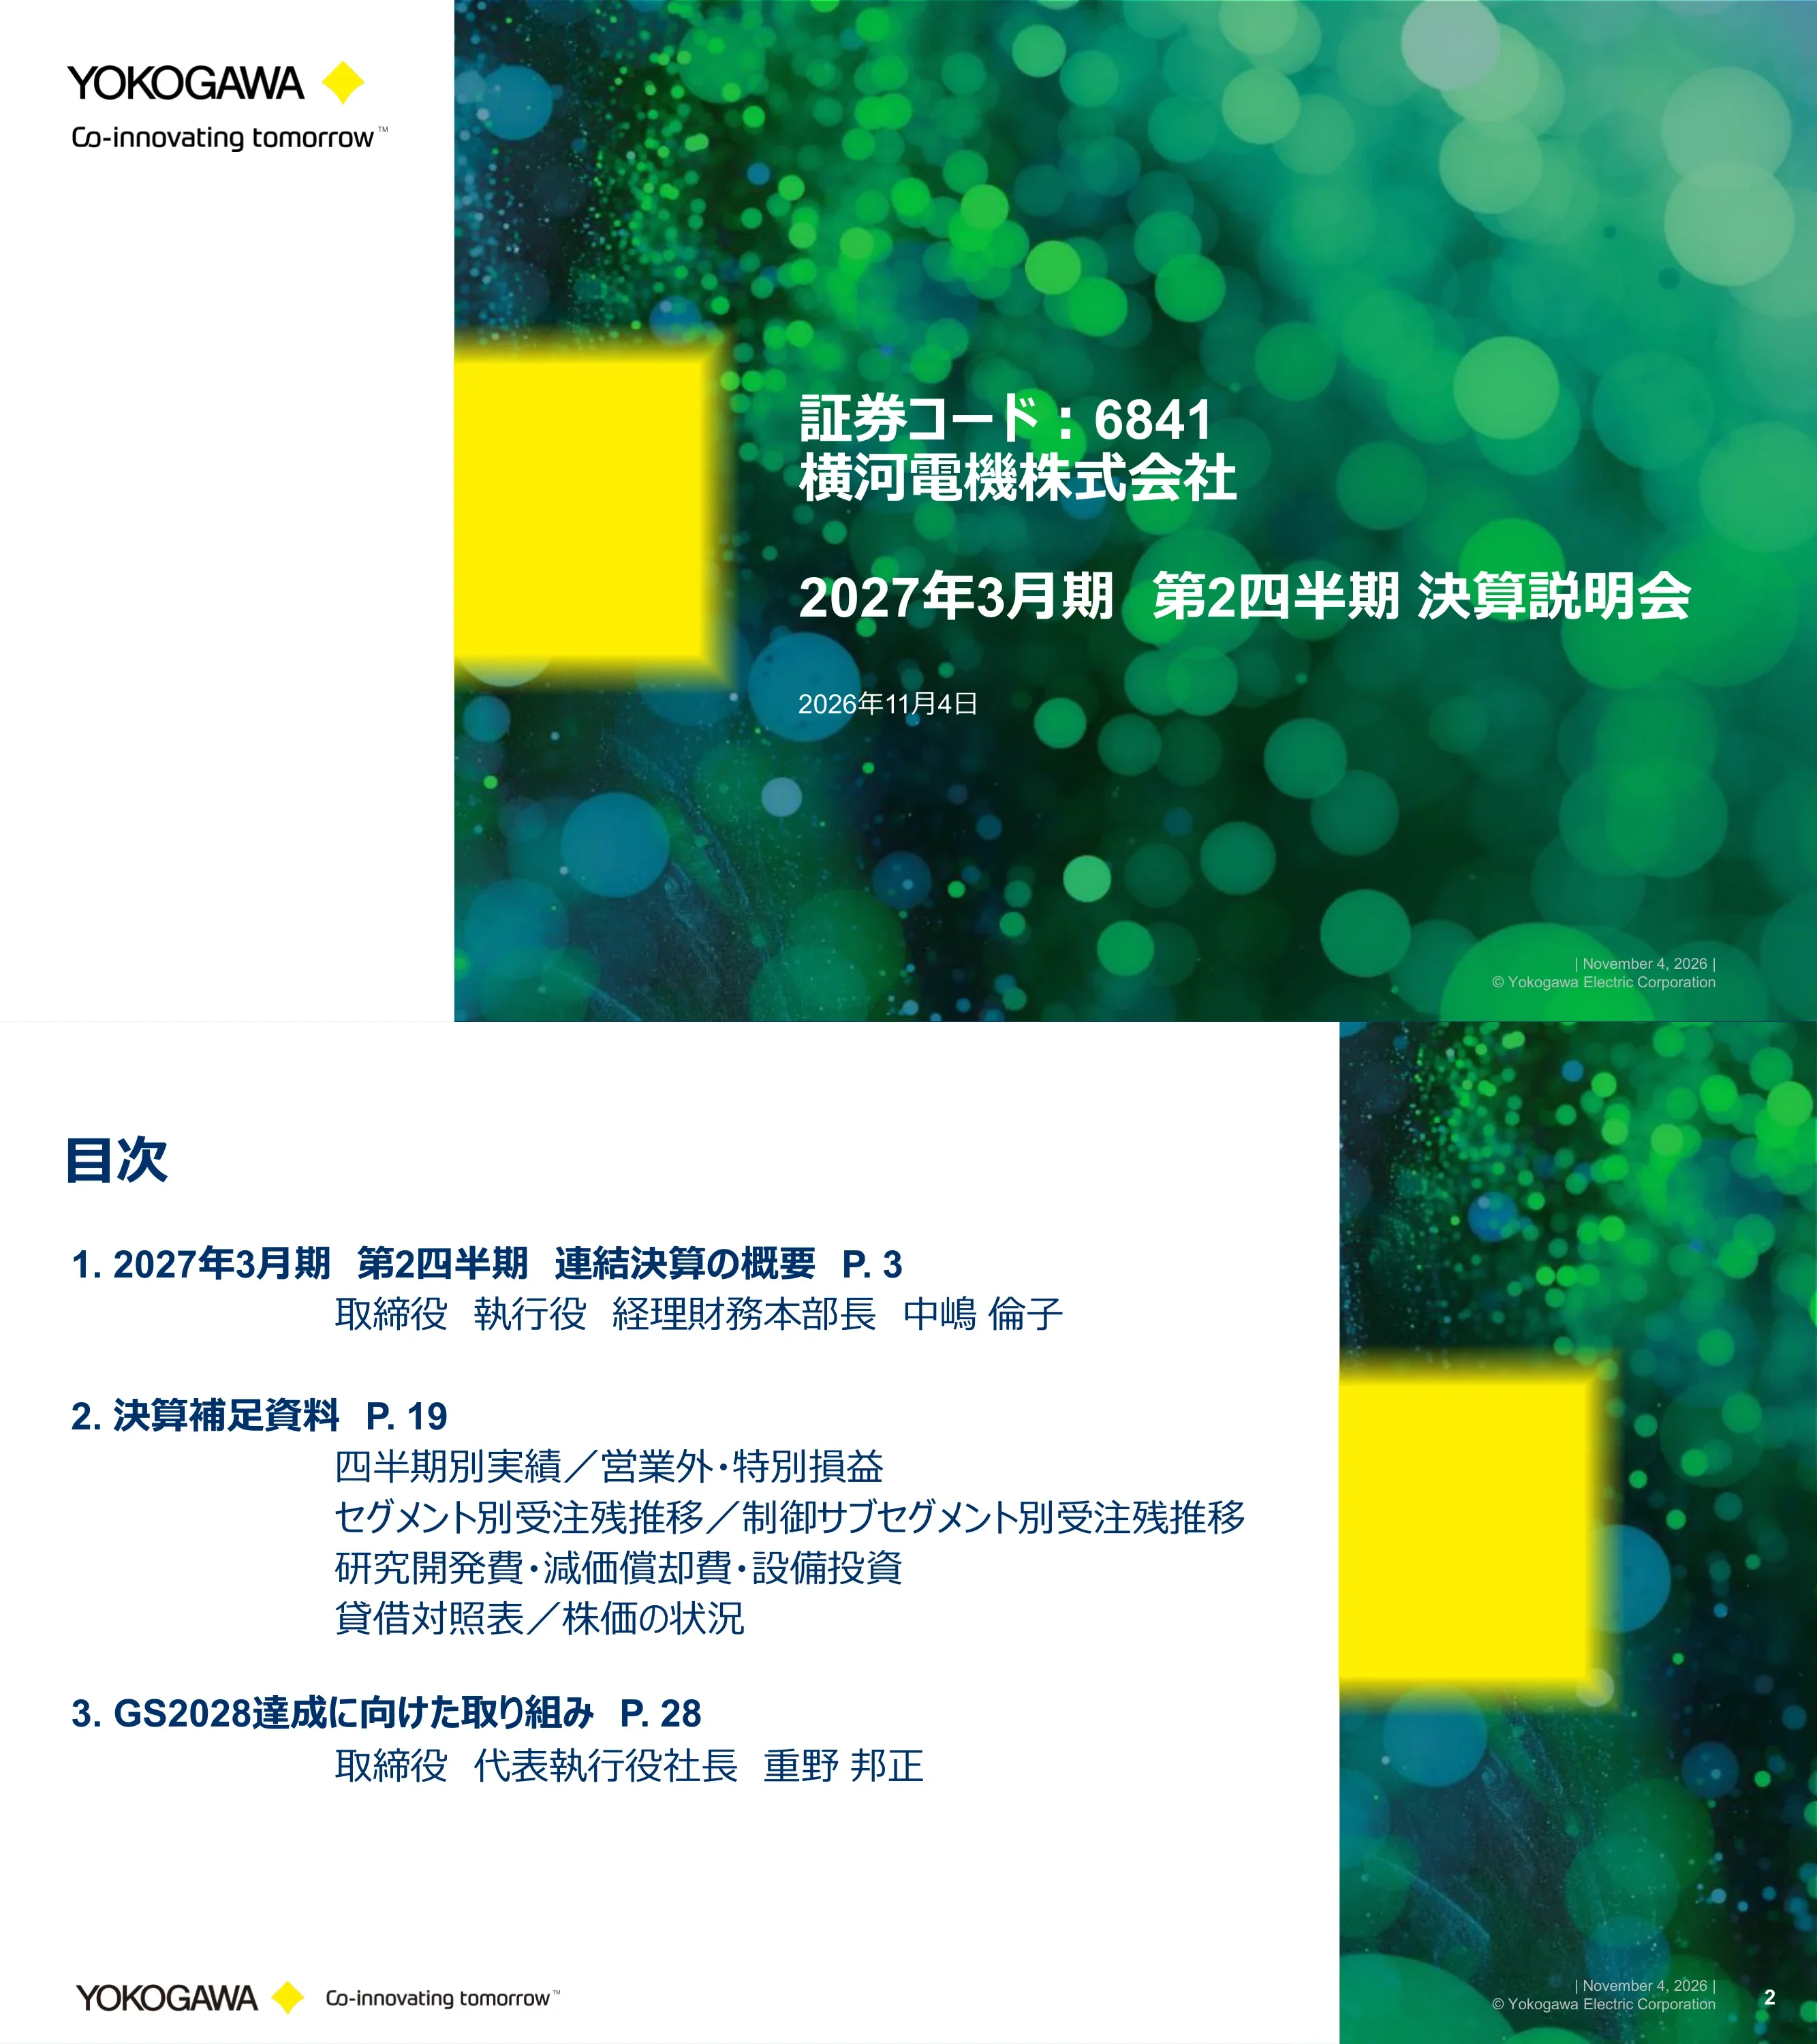
Title slide with securities code 6841, company name Yokogawa Electric Corporation, the title 'Financial results briefing for Q2 of the fiscal year ending March 2027' and the date November 4, 2026.
White left column with the YOKOGAWA logo and 'Co-innovating tomorrow' tagline; large green bokeh photo on the right with a yellow brand square and white title text.
Agenda in three parts: 1) Overview of consolidated results for Q2 FY ending March 2027 (p.3, Director and Executive Officer, Head of Accounting and Finance, Michiko Nakajima); 2) Supplementary materials (p.19: quarterly results, non-operating and extraordinary items, backlog by segment and sub-segment, R&D, depreciation and capex, balance sheet, share price); 3) Initiatives toward achieving GS2028 (p.28, Director, Representative Executive Officer and President Kunimasa Shigeno).
Numbered agenda list on white with presenter names indented under each section; green photo strip with yellow square on the right edge.
Opens the CFO section. Period covered: April 1, 2026 to September 30, 2026. Presenter Michiko Nakajima, Director, Executive Officer and Head of Accounting and Finance; dated November 4, 2026.
Same layout as the cover: logo column on the left, green bokeh image with yellow square and white headline on the right.
Q2 (H1) results: orders rose in both Control and Measurement, with Measurement growing sharply; sales increased mainly on Measurement growth and FX; operating profit declined. Control: higher sales mainly from FX, lower operating profit on a weaker gross margin and higher SG&A; Measurement: higher sales and profit. Full-year forecast revised: Control orders unchanged, sales +¥10 billion (100 億円), operating profit unchanged; Measurement orders +200 億円, sales +40 億円, operating profit +30 億円.
Navy title bar with yellow accent; two underlined headed blocks (H1 results, full-year forecast) with indented bullet text.
H1 FY2025 vs H1 FY2026 (億円): orders 3,004 to 3,656 (+652, +21.7%, FX +265); sales 2,820 to 2,982 (+162, +5.8%, FX +208); operating profit 390 to 357 (-32, -8.4%, FX +52); ROS 13.8% to 12.0% (-1.8pt); ordinary profit 397 to 363 (-34, -8.6%); interim net profit attributable to owners 294 to 231 (-63, -21.5%). USD/JPY 146.26 to 159.90. Excluding FX: orders +387 億円 (+12.9%) on small Control projects and AI data center demand in Measurement; sales -46 億円 (-1.6%); operating profit -84 億円 (-21.6%) on a weaker Control gross margin and higher SG&A.
Three diamond-bullet commentary lines above a financial table with navy row labels; the FY26 1H column is highlighted with a yellow border.
Waterfall from H1 FY2025 operating profit of 390 億円: -22 lower gross profit from lower sales (ex-FX), -21 gross margin deterioration, -42 higher SG&A (mainly personnel costs), giving 306 excluding FX; +52 FX effect brings H1 FY2026 operating profit to 357. FX inset: USD 146.26 to 159.90, EUR 168.84 to 184.48.
Bridge (waterfall) chart with dark-blue start and end bars, a light-blue ex-FX bar and red negative labels; FX rate table in a grey callout at upper right; final bar framed in yellow.
Three-year H1 comparison (FY24 1H / FY25 1H / FY26 1H, 億円). Orders 2,910 / 3,004 / 3,656 (Control 2,731 / 2,817 / 3,173; Measurement 158 / 163 / 473). Sales 2,666 / 2,820 / 2,982 (Control 2,506 / 2,645 / 2,759; Measurement 142 / 152 / 213). Operating profit 363 / 390 / 357 (Control 339 / 361 / 298; Measurement 29 / 30 / 62). Control ex-FX: orders +139 億円 (+4.9%), sales -75 億円 (-2.8%), operating profit -103 億円 (-28.7%). Measurement ex-FX: orders +262 億円 (+161.1%), sales +43 億円 (+28.4%), operating profit +21 億円 (+70.5%).
Commentary bullets on top; three side-by-side stacked bar charts (orders, sales, operating profit) with year-on-year deltas to the right; color legend pills for Control, Measurement and New businesses & others.
Control orders H1 FY25 to H1 FY26 (億円): Japan 720 to 793 (+73); Asia 864 to 1,081 (+216), including Southeast Asia & Far East 443 to 498, China 295 to 416 (+122), India 127 to 166; Europe & CIS 274 to 290; Middle East & Africa 653 to 612 (-41); North America 209 to 288 (+79); Latin America 97 to 110; overseas 2,098 to 2,380; total 2,817 to 3,173 (+356). Control sales: Japan 697 to 658 (-39), Asia 792 to 873, Middle East & Africa 520 to 574, North America 247 to 264, total 2,645 to 2,759 (+114). Orders grew mainly in Asia, North America and Japan despite a pullback from large Middle East orders.
Single commentary line above two parallel regional tables (orders left, sales right) with navy region labels and highlighted FY26 1H column.
Control orders (FY24 1H / FY25 1H / FY26 1H, 億円): Energy & Sustainability 1,526 / 1,639 / 1,688 (+49, +3.0%); Materials 989 / 929 / 1,216 (+287, +30.8%); Life 217 / 249 / 269 (+20, +8.2%); total 2,731 / 2,817 / 3,173 (+356, +12.6%). Control sales: Energy & Sustainability 1,264 / 1,430 / 1,518 (+88, +6.2%); Materials 1,033 / 989 / 1,005 (+16, +1.6%); Life 209 / 226 / 236 (+10, +4.4%); total 2,506 / 2,645 / 2,759 (+114, +4.3%). USD/JPY 152.40 / 146.26 / 159.90.
Two stacked bar charts side by side (orders, sales) in teal, purple and orange; change and growth-rate columns to the right; FX rate chips under each bar.
Quarterly orders from Q1 FY24 to Q2 FY26 for Energy & Sustainability, Materials and Life, each split into small and large orders. Large orders are defined as ¥300 million / US$3 million or more for E&S, ¥200 million / US$2 million for Materials and ¥100 million / US$1 million for Life, mainly CAPEX such as system installations; small orders are below those thresholds, mainly OPEX such as MRO and system upgrades. Small orders form the stable base in every sub-segment; Materials shows its highest quarter in Q2 FY26. Exact bar values are not labeled on the slide.
Three quarterly column charts side by side with two-tone stacks (small vs large) and a quarterly FX row beneath; definitions footnote at the bottom.
Quarterly orders Q1 FY25 to Q2 FY26 by industry (億円). Energy & Sustainability: Upstream 346 / 314 / 257 / 279 / 254 / 293, Downstream 283 / 280 / 267 / 287 / 346 / 246, plus Power, Renewable Energy, Water and Other E&S (Q2 FY26 Power 95, Renewable 42, Water 69, Other 96). Materials: Chemicals 225 / 242 / 217 / 290 / 256 / 275 and Mobility & Electric rising to 180 in Q2 FY26, plus Mining & Metals, Pulp & Paper and Other Materials. Life: Food & Beverage, Pharmaceutical and Other Life (Q2 FY26: 41, 26 and 66).
Large stacked column chart for Energy & Sustainability on the left; smaller stacked charts for Materials (top right) and Life (bottom right), with industry labels beside the latest bar.
Operating, investing and free cash flow (億円): FY24 1H 397 / -125 / 273; FY24 990 / -286 / 704; FY25 1H 358 / -114 / 244; FY25 860 / -331 / 528; FY26 1H 368 / -157 / 211.
Clustered column chart with green operating CF, red investing CF below the axis and purple FCF; period labels in navy (half years) and grey (full years) boxes; FY26 1H framed in yellow.
Revised on H1 results and the outlook. FY25 actual / FY26 May 7 forecast / FY26 November 4 forecast (億円): orders 6,178 / 6,450 / 6,650 (+200 vs prior, +7.6% YoY); sales 6,048 / 6,150 / 6,290 (+140, +4.0%); operating profit 826 / 850 / 880 (+30, +6.6%); ROS 13.6% / 13.8% / 14.0%; ordinary profit 843 / 850 / 880; profit before tax 789 / 850 / 880; income taxes 209 / 265 / 275; net profit attributable to owners 581 / 585 / 605 (+20, +4.1%); EPS ¥227.72 / ¥229.75 / ¥241.80. FX assumption unchanged at ¥150.00 per US dollar (FY25 actual ¥151.17).
Wide forecast table with navy row labels; columns for prior actual, original and revised forecasts, change vs prior forecast, YoY change and growth rate; revised column highlighted.
Full-year bridge from FY25 operating profit of 826 億円: +130 higher gross profit from higher sales (ex-FX), +15 gross margin improvement, -85 higher SG&A, reaching 886 excluding FX; -6 FX effect gives the FY26 forecast of 880. FX assumptions: USD 151.17 to 150.00, EUR 175.65 to 170.00.
Waterfall chart mirroring page 6: dark-blue FY25 bar, positive light-blue boxes, red negatives, light-blue ex-FX bar and yellow-framed forecast bar; FX inset at top right.
FY25 / FY26 May 7 forecast / FY26 November 4 forecast (億円). Orders 6,178 / 6,450 / 6,650: Control 5,709 / 6,030 / 6,030 (unchanged), Measurement 420 / 390 / 590 (+200). Sales 6,048 / 6,150 / 6,290: Control 5,655 / 5,730 / 5,830 (+100), Measurement 340 / 390 / 430 (+40). Operating profit 826 / 850 / 880: Control 752 / 765 / 765 (unchanged), Measurement 78 / 90 / 120 (+30), New businesses & others about -4 / -5 / -5.
Three stacked bar panels (orders, sales, operating profit) comparing actual, original and revised forecast, with change-vs-prior labels and a segment color legend.
Control FY25 actual vs FY26 forecast (億円). Orders: Japan 1,540 / 1,540; Asia 1,661 / 1,840 (+178), including Southeast Asia & Far East 810 / 850, China 555 / 630, India 297 / 360; Europe & CIS 608 / 585 (-24); Middle East & Africa 1,177 / 1,150 (-26); North America 517 / 670 (+153); Latin America 205 / 245 (+40); total 5,709 / 6,030 (+321). Sales: Japan 1,515 / 1,515; Asia 1,642 / 1,785 (+142); Europe & CIS 636 / 610; Middle East & Africa 1,153 / 1,100 (-53); North America 516 / 610 (+95); Latin America 193 / 210; total 5,655 / 5,830 (+175).
Two side-by-side regional tables (orders and sales) in the same style as page 8, with the forecast column highlighted.
Control orders FY25 / May 7 forecast / November 4 forecast (億円): Energy & Sustainability 3,258 / 3,485 / 3,375 (-110); Materials 1,952 / 2,020 / 2,130 (+110); Life 499 / 525 / 525; total 5,709 / 6,030 / 6,030. Control sales: Energy & Sustainability 3,148 / 3,215 / 3,235 (+20); Materials 2,018 / 2,025 / 2,085 (+60); Life 489 / 490 / 510 (+20); total 5,655 / 5,730 / 5,830 (+100). FX assumption ¥150.00 per US dollar.
Two stacked bar charts (orders, sales) with sub-segment colors and change-vs-prior column; FX chips below.
Interim dividend of ¥46 per share approved, with the FY26 annual dividend forecast unchanged at ¥92 (¥46 interim + ¥46 year-end). Dividends per share rose from ¥25 (2016) to ¥30, 32, 34, 34, 34, 34, 40 (2023), 58 (2024), 78 (2025) and a forecast ¥92 (2026), under a policy of stable, continuous dividend increases. The share buyback of up to ¥30 billion (300 億円) via market purchases, from May 8 to end of September 2026, is complete. The total payout ratio line, which includes buybacks, peaks at 87.4% for 2026 (subject to change with further buybacks); the 2026 dividend payout ratio is 38.0%.
Two diamond bullets on top; stacked dividend columns (interim and year-end) with an orange arrow labeled 'stable, continuous dividend increase policy'; payout ratio lines above; footnote on buyback inclusion.
Lists the appendix contents: quarterly results, non-operating and extraordinary items, backlog by segment, Control backlog by sub-segment, R&D, depreciation and capex, balance sheet, and share price.
White left area with a navy bullet list; green bokeh image with yellow square on the right.
Quarterly orders / sales / operating profit (億円). FY24: Q1 1,570 / 1,289 / 148; Q2 1,340 / 1,377 / 215; Q3 1,503 / 1,423 / 221; Q4 1,574 / 1,535 / 251. FY25: Q1 1,491 / 1,302 / 162; Q2 1,514 / 1,518 / 228; Q3 1,498 / 1,523 / 214; Q4 1,676 / 1,705 / 221. FY26: Q1 1,834 / 1,413 / 165; Q2 1,822 / 1,569 / 192. Average USD/JPY by quarter from 158.15 (Q1 FY24) to 159.36 (Q2 FY26).
Ten groups of three columns (orders, sales, operating profit) across FY24 to FY26, Q2 of each year outlined with dotted yellow frames and the latest quarter with a solid yellow frame; FX row beneath.
H1 FY25 vs H1 FY26 (億円): operating profit 390 / 357; non-operating income 34 / 36; non-operating expenses 27 / 31; ordinary profit 397 / 363; extraordinary gains 4 / 5; extraordinary losses 22 / 16; profit before tax 379 / 352; income taxes 69 / 107; interim profit attributable to non-controlling interests 16 / 15; interim profit attributable to owners of parent 294 / 231. Effective tax burden rose from 18.3% to 30.3%, a key reason net profit fell more than operating profit.
Narrow two-column table with navy row labels and the FY26 1H column outlined in yellow; tax burden ratio row below.
Backlog at each period-end rate (億円): FY24 Q4 4,282; FY25 Q2 4,509; FY25 Q4 4,662; FY26 Q2 5,272 (+610 vs FY25 Q4). FY26 Q2 split: Control Japan 1,286 (+157), Control overseas 3,611 (+206), Measurement 375 (+247), New businesses & others 1. Period-end USD/JPY 149.52, 148.88, 159.88 and 157.35.
Four stacked columns in blue shades with yellow Measurement caps; change labels to the right of the latest bar; period-end FX chips below.
Same backlog restated at a constant ¥157.35 per US dollar (億円): FY24 Q4 4,493; FY25 Q2 4,686; FY25 Q4 4,622; FY26 Q2 5,272 (+651). Control overseas 3,365 / 3,505 / 3,364 / 3,611 and Control Japan 1,079 / 1,118 / 1,129 / 1,286, with Control up +404 combined; Measurement 47 / 58 / 128 / 375 (+247).
Same stacked column format as page 22 with a bracket showing the combined +404 Control increase; all FX chips read 157.35.
Control backlog at period-end rates (億円): FY24 Q4 4,236; FY25 Q2 4,449; FY25 Q4 4,534; FY26 Q2 4,897 (+363: E&S +90, Materials +245, Life +28). At the FY26 Q2 rate of ¥157.35: 4,444 / 4,623 / 4,493 / 4,897 (+404: E&S +124, Materials +249, Life +30). FY26 Q2 split: Energy & Sustainability 3,348, Materials 1,274, Life 275.
Two stacked column charts side by side (period-end rate vs constant FY26 Q2 rate), each with sub-segment colors and change labels.
R&D expenses (億円, % of sales): FY18 262 (6.5%), FY19 276, FY20 275, FY21 285, FY22 305, FY23 324, FY24 321 (5.7%), FY25 1H 162, FY25 330 (5.5%), FY26 1H 173 (5.8%). Depreciation: FY18 177 rising to FY25 250 (4.1%); FY26 1H 133 (4.5%). Capex: FY18 150 rising to FY24 331 (5.9%) and FY25 322 (5.3%); FY26 1H 182 (6.1%). IFRS 16 (leases) applied from FY19.
Clustered column chart (blue R&D, orange depreciation, green capex) above a color-coded data table with ratios; FY26 1H column outlined in yellow.
Total assets (億円): FY24 7,183; FY25 1H 7,243; FY25 7,956; FY26 1H 7,624. FY26 1H assets: cash and deposits 1,905, notes and accounts receivable 2,462, inventories 577, other current assets 177, fixed assets 1,598, investments 904. Liabilities and equity: interest-bearing debt 242, other liabilities 2,269, capital stock 434, capital surplus 363, retained earnings and other 4,214, non-controlling interests 102. Capital surplus fell from 546 to 363 between FY25 1H and FY25.
Two stacked column panels (assets, liabilities and equity) with connecting lines between periods; pastel segment colors and period-end FX rates below.
Line chart of Yokogawa's share price versus TOPIX from March 2019 to October 23, 2026. Yokogawa: ¥2,291 (Mar-2019), ¥1,303 (Mar-2020), ¥3,494 (Mar-2024), ¥4,744 (Mar-2026), ¥5,635 (Jun-2026), ¥4,692 (Sep-2026), ¥4,527 (Oct 23, 2026). TOPIX: 1,592 (Mar-2019) to 3,966 (Oct 23, 2026). Yokogawa peaked above ¥6,000 in 2026 before pulling back.
Full-width line chart (blue Yokogawa, orange TOPIX) with a compact data table underneath.
Opens the CEO section of the Q2 briefing: initiatives toward the GS2028 mid-term business plan, presented by Kunimasa Shigeno, Director, Representative Executive Officer and President, on November 4, 2026.
Mirrored cover layout with the logo column on the left and the green bokeh image with yellow square and white text on the right.
Customer investment appetite remains high on solid energy demand, but the impact of Middle East tensions needs close watching. By region: rich Middle East pipeline; competitive but active India power and petrochemical investment; active North American LNG and shale investment; weak China economy but rising semiconductor investment; limited large European projects; Southeast Asian power and water infrastructure plus CCS/CCUS; solid Japan led by energy. By industry: upstream/downstream gas demand and DX (AI, security, labor saving), active hydrogen inquiries in renewables, long-term water demand, high-performance chemicals from semiconductors and AI data centers, mining decarbonization, and growth in biopharma and food. Risks: geopolitical instability, inflation squeezing margins, sharp FX moves. Overseas sales ratio 73.7% (FY25 1H) to 76.3% (FY26 1H).
Underlined two-line headline; dense region and industry text blocks with circular labels; world map with colored region bubbles; red risk star and overseas sales ratio table at lower left.
Investment appetite continues on energy demand, but normalization will take longer than assumed at the start of the year. At the FY26 start the company expected normalization in H2: Strait of Hormuz logistics recovering in stages, orders weak in H1 and recovering in H2, some sales shifting into FY27, and higher logistics and parts costs. As of November 2026 uncertainty continues: some customers have cut plant utilization or halted operations, maintenance (OPEX) demand is pushed back, some CAPEX projects are delayed but none cancelled, and the pipeline is largely unchanged. Outlook: order recovery later than first assumed, continued medium- to long-term energy investment, and active AI-led DX investment.
Headline across the top; teal box (start-of-year view) and navy box (current view) joined by a yellow arrow labeled 'normalization timing assumption revised'.
Control sales forecast raised from 573.0 billion yen (5,730 億円) by +100 億円, capturing growth opportunities. Gross profit impact: +50 億円 from higher sales offset by -50 億円 from margin deterioration (tougher competition, lower selling prices). Control operating profit forecast held at 765 億円, maintained by higher sales.
Headline over a three-column flow: original forecast (grey), revised forecast (blue/green) and key points (navy), connected by chevron arrows; middle box breaks out the gross profit effects.
Memorandum with Slovenia's state transmission operator ELES and state gas transmission operator Plinovodi to develop a hydrogen ecosystem, linking power, gas and hydrogen infrastructure for energy security, using Yokogawa's digital and automation technologies. Separately, Yokogawa received an order from Kawasaki Heavy Industries for control systems for the world's largest liquefied hydrogen carrier and a hydrogen-fueled vessel, part of NEDO Green Innovation Fund projects, building on its LNG carrier control experience.
Two stacked case blocks, each with a blue headline, a photo (MOU signing; hydrogen carrier rendering) and square-bullet text.
Yokogawa was selected as Main Automation Contractor (MAC) for LNG Canada's Phase 2 expansion, which doubles LNG capacity from 14 million to 28 million tonnes per year. Scope includes control systems, safety instrumented systems, operator training simulators and cybersecurity infrastructure, reusing the Phase 1 control platform to ease expansion and reduce integration risk.
Blue subheadline; aerial photo of the Kitimat, British Columbia LNG facility on the left; square-bullet text on the right; photo credit below.
Order for 5 x 800MW large thermal power units from India's state-owned National Thermal Power Corporation (NTPC) for new ultra-supercritical coal plants at Nabinagar and Gadarwara. Contract signed with EPC contractor Larsen & Toubro; Yokogawa supplies control and safety instrumented systems, supporting India's energy infrastructure as demand rises with population and industrial growth.
Blue subheadline; large photo of a coal power plant on the left (illustrative image of another NTPC plant); square-bullet text on the right.
Large orders for optical communication test instruments, led by optical spectrum analyzers, are increasing, and demand for power and waveform measuring instruments for power supply performance evaluation is growing. Measurement business orders by half (億円): FY24 H1 158, H2 145; FY25 H1 163, H2 257; FY26 H1 473. An illustration maps Yokogawa products (optical spectrum analyzer AQ6361, multi-application test system AQ2300, power analyzer WT5000, mixed-signal oscilloscope DLM3000) to AI data center optical device and power supply unit testing.
Two bullets on top; data center infographic with red-outlined Yokogawa products on the left; yellow half-year column chart with rising arrow on the right.
Four focus areas: CAPEX x India (fierce competition but booming infrastructure investment; roll out the ability to win in India to other emerging markets); Measurement business x Global (strong FY25 growth proved product competitiveness; further strengthen global expansion); AI x OT (many responses to the FKDPP autonomous control case; strength in total solutions including safety and security); OPEX x Europe and Southeast Asia (large installed base with good customer relationships; value-added proposals via solutions and services).
Four horizontal teal and navy banners with circular line icons along a diagonal line; bold labels on the left and two-line descriptions on the right.
Purpose statement in Japanese and English: 'Utilizing our ability to measure and connect, we fulfill our responsibilities for the future of our planet.' Supporting text explains that measuring is Yokogawa's origin and that connecting means linking information, building trust with customers and acting as a node between companies and industries.
Full-bleed dark blue image of hands holding a glowing globe network; large Japanese headline, English translation below, explanatory text on the right.
Introduces the reference section: topics, and ESG-related indexes that include Yokogawa.
White area with navy text on the left; green bokeh strip with yellow square on the right.
April: strengthened cybersecurity for the CENTUM VP and ProSafe-RS integrated control and safety system and related software. June: enhanced OpreX Collaborative Information Server for integrated operations. July: Yokogawa Test & Measurement launched the WT1500 precision power analyzer. August: launched CT500SA and CT200SA AC/DC split-core current sensors. September: distributor agreement with French container-logistics SaaS company BuyCo for supply chain optimization in materials industries. October: launched the OpreX Gas Density Meter with a color touch panel and digital communication.
Orange tab heading 'New products and solutions' over a light-blue band listing items by announcement month; website link at top right.
Partnerships: September MOU with ELES and Plinovodi on a hydrogen ecosystem across Slovenia; support for scaling up a tropical AI data center test facility in Singapore. Orders: September order from Kawasaki Heavy Industries for control systems for the world's largest liquefied hydrogen carrier and a hydrogen-fueled vessel. Other: June SBTi validation of its net-zero target; September publication of Yokogawa Report 2026 and Yokogawa Sustainability Report 2026.
Three category bands (teal partnerships, teal orders, grey other) with month labels and short items; two report cover thumbnails at bottom right.
As of October 2026 Yokogawa is included in or rated by: Dow Jones Best-in-Class Asia Pacific Index, FTSE4Good Index Series, FTSE JPX Blossom Japan Index and Sector Relative Index, MSCI Selection Indexes, MSCI Japan ESG Select Leaders Index, MSCI Japan Empowering Women Index (WIN), ISS ESG Corporate Rating Prime, Sustainalytics Top-Rated ESG Regional Performer, CDP Climate Change and Water Security A List, CDP Supplier Engagement Leader, SNAM Sustainability Index, S&P/JPX Carbon Efficient Index, EcoVadis Gold, and Morningstar Japan ex-REIT Gender Diversity Tilt Index.
Text list of indexes on the left; grid of index and rating logos on the right and bottom.
Forward-looking statements are based on currently available information and reasonable assumptions, and actual results may differ materially; the company is not obliged to update them except as required by law; copyright belongs to the company. The deck does not reflect retrospective revisions from finalizing provisional accounting for business combinations, so there are minor differences from the earnings release (決算短信). IR contact: Yokogawa Electric Corporation, Finance & IR Department, phone 0422-52-6845, https://www.yokogawa.co.jp/about/ir/.
Paragraph disclaimer with navy accent bar; light-blue contact box below.
Closing slide with the YOKOGAWA logo, the 'Co-innovating tomorrow' tagline and a trademark notice stating that corporate, product and logo names are trademarks of Yokogawa Electric Corporation and their respective holders.
White left half with logo and large blue tagline; green bokeh image with yellow square on the right.
Common questions about this slide and the underlying presentation content.
It is Yokogawa's 43-slide briefing on results for April 1 to September 30, 2026. It covers the results summary, an operating profit bridge, segment, regional, sub-segment and industry breakdowns, cash flow, the revised full-year forecast, shareholder returns, an appendix (quarterly results, backlog, R&D and capex, balance sheet, share price) and the CEO's update on the GS2028 mid-term plan.
The original is in Japanese. It is Yokogawa's earnings briefing material (決算説明会資料) for Q2 of the fiscal year ending March 2027, dated November 4, 2026 and released on TDnet, the Tokyo Stock Exchange's timely disclosure system. This page summarizes every slide in English, and the downloadable PDF is the original Japanese file.
Yokogawa's fiscal year runs from April to March. In Japanese the period is written 2027年3月期 (fiscal year ending March 2027), while the deck's own charts label it FY26. So H1 FY2026 means April to September 2026, and the 'Q2 earnings briefing' title refers to the cumulative first half.
Orders were ¥365.6 billion (3,656 億円, +21.7%), sales ¥298.2 billion (2,982 億円, +5.8%), operating profit ¥35.7 billion (357 億円, -8.4%) and net profit attributable to owners ¥23.1 billion (231 億円, -21.5%). The yen averaged ¥159.90 per US dollar, versus ¥146.26 a year earlier. Excluding FX, sales fell 1.6% and operating profit fell 21.6%.
The November 4 forecast raises orders to 6,650 億円 (+200), sales to 6,290 億円 (+140), operating profit to 880 億円 (+30) and net profit to 605 億円 (+20), with EPS of ¥241.80. Measurement drives the increase. Control sales go up by 100 億円 but its operating profit stays at 765 億円, because the company expects weaker gross margins.
Investment in AI data centers drove large orders for optical communication test equipment, especially optical spectrum analyzers, and for power and waveform analyzers that test power supplies. Measurement orders reached 473 億円 in H1 FY2026, up from 163 億円 a year earlier.
Yes. The original PDF can be downloaded from this page. Its navy-and-yellow design, waterfall bridges, stacked segment bars, regional tables and backlog charts are a good model for a quarterly earnings deck. With 2Slides you can build a similar deck around your own numbers and replace Yokogawa's data and branding.
Original Japanese-language earnings briefing material released via the Tokyo Stock Exchange timely disclosure system.
Official IR site cited on the deck's contact slide.

Create Your Own Slides
Turn your ideas into professional presentations in seconds with 2slides AI.
Reference professional designs, choose your style, and generate slides with perfect text rendering. Powered by Nano Banana—start creating your presentation now.
Your AI Agent for slides. Save time, shine faster with intelligent presentation creation.


© 2026 2slides. All rights reserved.