
Part of Investor presentation examples
XP Inc. Q3 2026 Earnings Presentation (3Q26) - Brazil's leading investment platform reports client assets, revenue, profitability, capital management and credit data; filed with the SEC as an exhibit to Form 6-K on 16 November 2026
Uses this deck’s cover as a style reference for slides made from your own content. Or pick any page below to use its layout as the reference.
Quick Navigation
Tags
Share the slides
XP Inc. Q3 2026 Earnings Presentation (3Q26) - Brazil's leading investment platform reports client assets, revenue, profitability, capital management and credit data; filed with the SEC as an exhibit to Form 6-K on 16 November 2026
Detailed view of each slide page, including layout, key content and visual elements.
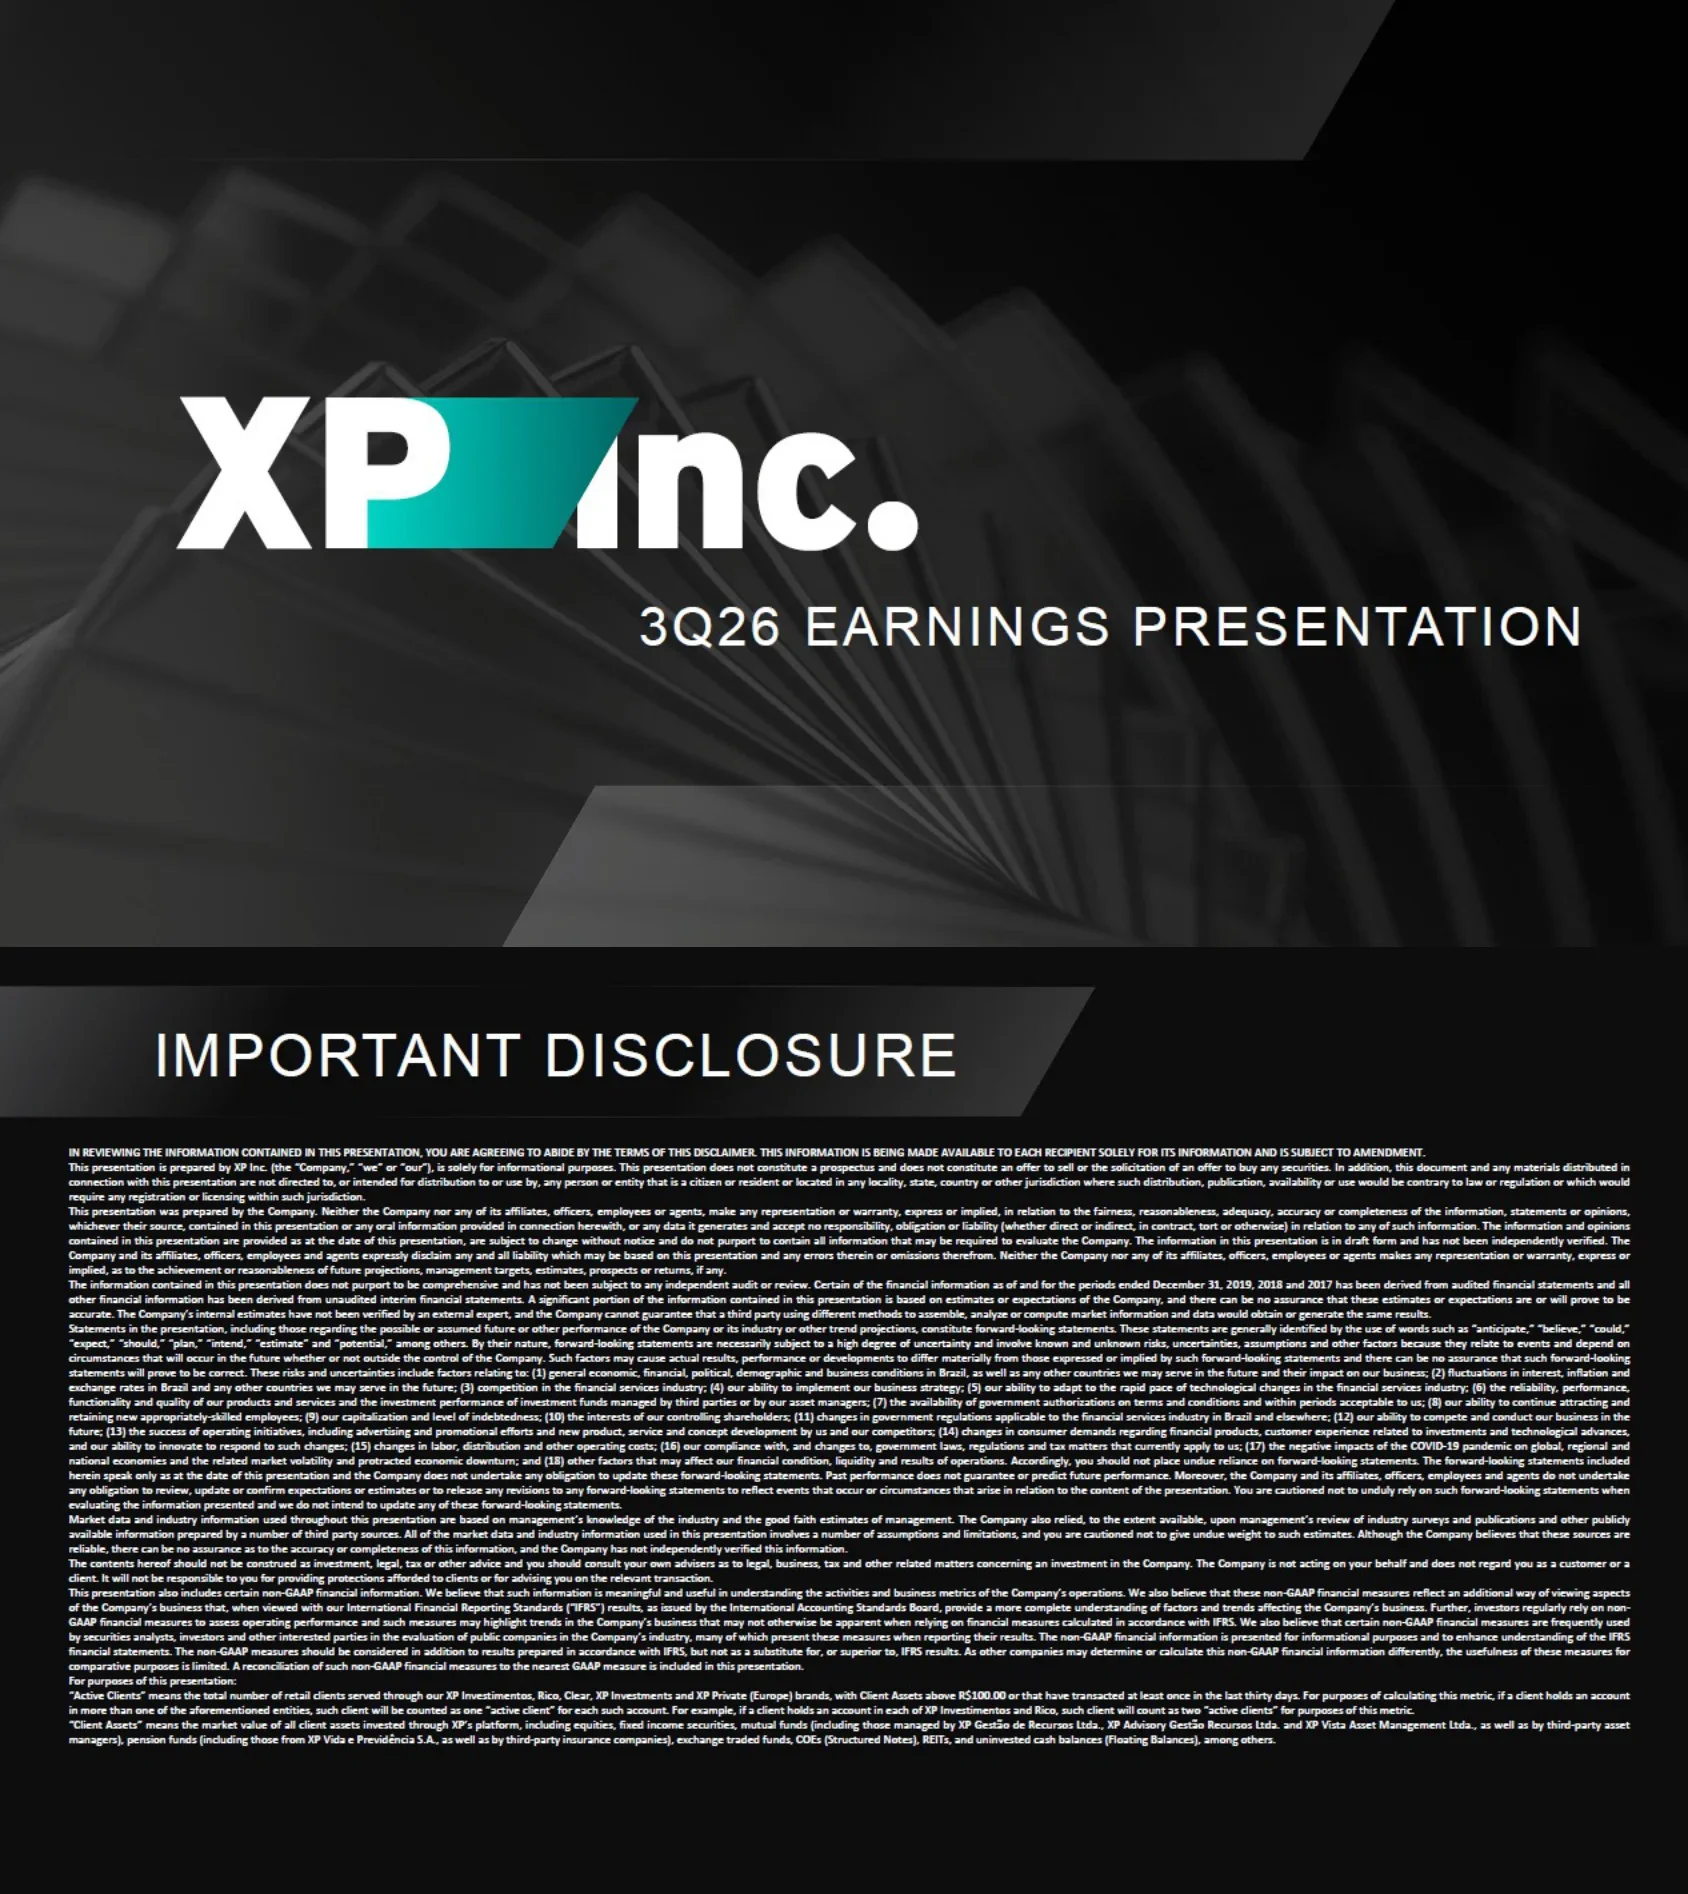
Title slide for XP Inc.'s 3Q26 earnings presentation. It shows the XP Inc. logo with a teal parallelogram accent and the title '3Q26 EARNINGS PRESENTATION'.
Full-bleed dark grayscale background image of folded panels; large logo left of center, title text right-aligned below it; angular translucent bars at top and bottom.
A full-page legal disclaimer covering forward-looking statements, market data, non-GAAP financial measures and definitions. The visible headings and the definitions of 'Active Clients' and 'Client Assets' can be read, but the body text is very small and mostly not legible, so no further detail is cited here.
Dark background with a title banner at top left and a single dense block of small white text in justified paragraphs filling the page.
Agenda listing four sections with page numbers: Key Highlights and Strategy (04), 3Q26 Financials (07), Q&A (17) and Appendix (18).
Dark candlestick-chart background image; large teal 'INDEX' heading at top left; four numbered teal tiles with right-aligned section names separated by thin rules on a translucent angled panel.
Subtitled 'High profitability and returns through different market cycles'. KPI groups show R$2.2 trillion client assets, AUM and AUA (+15% YoY), 18.4K total advisors (+1% YoY), 4.8 million active clients (+1% YoY), R$5.3 bn gross revenue (+8% YoY), R$1.6 bn adjusted EBT (+13% YoY), R$1.4 billion adjusted net income (+4% YoY), 21.7% ROE, 20.3% BIS ratio and 9% adjusted diluted EPS growth YoY. A line chart of adjusted diluted EPS in R$ from 2019 to 2026 is labeled 26% CAGR.
Teal gradient header banner; left column of three KPI groups (Core Investment KPIs, Income Statement, Balance Sheet and Profitability) with three tiles each; right panel with a line chart and large CAGR callout; footnotes at bottom.
Total client assets, AUM and AUA reach R$2,241 bn in 3Q26 versus R$1,947 bn in 3Q25 (+15%) and R$2,173 bn in 2Q26; the 3Q26 split is 1,574 / 303 / 363. Retail net new money is R$17.5 billion, and the net new money chart shows 29, 28 and 22 (R$ bn) for 3Q25, 2Q26 and 3Q26, with the retail part at 20, 20 and 17. A caption notes net new assets expanding R$294 billion YoY.
Teal header with the slide's title; two side-by-side stacked bar charts (three periods each) with legends above and a highlighted takeaway caption box under each chart.
Three strategic pillars under the message 'Resilient business with diversified revenues': Investments (27% of retail AuC under fee-based model, +15 p.p. FinPlan penetration, 29% CAGR in offshore AuM 2022-3Q26), Wholesale Banking (Corporate, SMB, Issuer Services) and Consumer Banking, where ex-investments retail revenues rise from 7% of total revenues in 2021 to 20% in 3Q26. A band of strategic enablers lists AI, Discipline, and People and Culture.
Three numbered columns (01, 02, 03) with metric rows or icon rows, a small bar graphic with +9x arrow in the third column, and a dark teal strategic-enablers band across the bottom; footnotes below.
Section divider introducing the financial results part of the deck. It shows the XP Inc. logo with a teal label reading '3Q26 Financials'.
Dark abstract background of overlapping glass-like bars; centered logo with a teal rectangular label beneath it and a thin horizontal line at left.
Gross revenue posted +8% growth YoY: R$4,942 mn in 3Q25, R$5,056 mn in 2Q26 and R$5,339 mn in 3Q26. In 3Q26 Retail is 4,127 (77%) and Wholesale Banking 1,212 (23%); 3Q25 also included Other of 169 (3%).
Two stacked-bar charts side by side under teal gradient headers: absolute R$ million on the left, percentage mix on the right; shared legend line at the bottom.
Retail revenue grew 11% YoY to R$4,127 mn in 3Q26 from R$3,704 mn in 3Q25 (2Q26: R$3,881 mn). The 3Q26 mix is Equities 29%, Fixed Income 22%, Funds Platform 10%, New Verticals 17% and Other Retail 22%, under the subtitle 'Increasing revenue diversification'.
Left single-series bar chart with +11% bracket; right 100% stacked bars for five revenue lines across three periods; legend beneath.
Wholesale banking revenue grew 13% YoY to R$1,212 mn from R$1,069 mn in 3Q25 (2Q26: R$1,175 mn). 3Q26 splits into Corporate 631, Issuer Services 194 and Institutional 387; the slide highlights another good performance of the Corporate segment.
Split layout: pale left panel with large title and subtitle text; right panel with a teal header and a three-period stacked bar chart with legend below.
SG&A was R$1,873 mn in 3Q26, up 12% from R$1,672 mn in 3Q25 (2Q26: R$1,640 mn), split into People 1,214 and Non-people 659. LTM efficiency ratio is 34.6% (vs 34.8% in 3Q24) and the compensation ratio is 23.1% (vs 23.6% in 3Q24), shown over nine quarters.
Left stacked bar chart of people vs non-people costs; right two-line chart of efficiency and compensation ratios across 3Q24-3Q26; footnote about excluded incentive revenue.
Adjusted EBT was R$1,580 mn in 3Q26, +13% versus R$1,404 mn in 3Q25 and close to R$1,565 mn in 2Q26. The EBT margin line reads 29.7%, 32.0% and 30.7%; the takeaway says EBT grows on a yearly basis and remains stable sequentially.
Left: bold title and a gray takeaway box; right: bar chart with an overlaid margin line, current quarter in darker teal.
Adjusted net income was R$1,382 mn in 3Q26, +4% versus R$1,330 mn in 3Q25 and flat versus R$1,384 mn in 2Q26. Adjusted net margin is 28.1%, 28.3% and 26.9%; the slide says net income remains stable QoQ with higher ETR.
Pale left panel with large title and takeaway text; right bar chart with margin line and YoY bracket, latest quarter in darker teal.
Dividends paid plus executed share repurchases total R$1,815 mn (2022), 3,542 (2023), 3,354 (2024), 2,394 (2025) and 5,318 for 10M26 including 1,500 and 1,300 of open buyback and dividends to be paid. Payout ratio is 51%, 91%, 74%, 46% for 2022-2025 and above 60% for 2026E; the message is more than R$15 bn in dividends and share repurchases.
Left stacked bar chart with dashed outlines for amounts still to be executed; right single-series payout ratio bars with the 2026E bar darker; centered takeaway line and footnotes at the bottom.
Diluted EPS (R$) is 2.47 in 3Q25, 2.67 in 2Q26 and 2.69 in 3Q26, +9% YoY. Annualized ROTE is 28.0%, 27.2% and 26.2% (28.6% adjusted for buybacks and dividends in 3Q26), while ROAE is 23.0%, 22.5% and 21.7% (23.3% adjusted).
Two charts under the title: left bar chart of EPS with YoY bracket; right bar chart of ROTE with overlaid ROAE lines (solid and dashed) and a dashed box for the adjusted 3Q26 value.
BIS ratio is 20.3% in 3Q26 (21.2% in 3Q25, 20.3% in 2Q26), composed of Common Equity Tier 1 17.2%, Additional Tier 1 1.5% and Tier 2 1.7%. Risk-weighted assets are shown as 108, 127 and 132 with RWA at 27%, 31% and 31% of total assets; VaR is R$44mm, or 17bps of equity.
Split-screen: dark left half with BIS ratio stacked bars and a highlighted callout; light right half with RWA stacked bars, a line for RWA % of total assets, and bps labels beneath each bar.
Divider slide opening the question-and-answer part of the earnings call. It shows the XP Inc. logo and a teal label reading 'Q&A'.
Same dark abstract geometric background as other dividers; centered logo with a teal label bar below.
Divider slide introducing the appendix. It shows the XP Inc. logo and a teal label reading 'APPENDIX'.
Same dark abstract geometric background; centered logo with a teal label bar below.
Table in R$ billion of secured, unsecured and total balances: Loans 16.5 / 7.5 / 24.0, Credit Card 7.6 / 1.4 / 9.0, Corporate Securities 5.1 / 48.1 / 53.1 and Credit Portfolio 29.1 / 57.0 / 86.2. A side panel lists main activities: Investment Banking, Fixed Income Distribution and Corporate Credit.
Dark photo header band with title; four-column table with icons above column headings, a highlighted teal row for Corporate Securities and a bold total row; sidebar with a teal 'Main Activities' tab.
Bridge from Accounting P&L to Managerial P&L for 3Q26 in R$ mn: gross revenues 5,339, net revenues 5,158 accounting vs 5,139 managerial, gross profit 3,629 vs 3,610, total SG&A (1,879) vs (1,867), EBT 1,572 vs 1,580, tax expense (190) vs (199) and net income 1,382 in both.
Three-column financial table (Accounting P&L, Reclassifications and Adjustments, Managerial P&L) with shaded numeric columns, dashed separators and bold subtotal rows under a teal subtitle.
Closing slide repeating the '3Q26 EARNINGS PRESENTATION' title with the XP Inc. logo. It adds an Investor Relations contact block with an email address and the investors.xpinc.com website.
Same layout as the cover: dark photographic background, large logo and title, with a small contact text block at bottom left.
Common questions about this slide and the underlying presentation content.
It covers XP Inc.'s 3Q26 results in 21 slides: key highlights and strategy, client assets and net new money, gross revenue by retail and wholesale banking, SG&A and efficiency, adjusted EBT and net income, dividends and buybacks, EPS and ROTE, BIS ratio and VaR, plus an appendix with the loan portfolio and a non-GAAP reconciliation. Amounts are in R$ (Brazilian reais).
It is XP Inc.'s own 3Q26 earnings presentation (Nasdaq: XP), filed with the SEC as an exhibit to Form 6-K on 16 November 2026. The content belongs to XP Inc.; this gallery entry is a presentation-format copy for reference and design inspiration.
Slide 4 shows R$2.2 trillion in client assets, AUM and AUA (+15% YoY), 4.8 million active clients, 18.4K advisors, R$5.3 bn gross revenue (+8% YoY), R$1.6 bn adjusted EBT (+13%), R$1.4 billion adjusted net income (+4%), 21.7% ROE and a 20.3% BIS ratio.
Yes. The sequence of cover, disclosure, index, highlights, strategy, section dividers, chart pages, Q&A, appendix and contact slide is a solid investor-relations structure. Replace the XP Inc. branding and figures with your own before reuse.
The deck is offered as a PDF for viewing and printing and as an editable PPTX so you can change text, charts and colors in PowerPoint or compatible tools.
Nearly all slides are clear. The Important Disclosure slide (page 2) has very small dense legal text that is mostly not legible at normal size, so refer to the original SEC filing for the exact wording.
The appendix has a divider, a Total Loan Portfolio table (R$ billion, secured vs unsecured: loans, credit card, corporate securities, credit portfolio) and a Non-GAAP Reconciliation bridging the 3Q26 Accounting P&L to the Managerial P&L.
Yes. The final slide lists Investor Relations contact information, including an email address and the investors.xpinc.com website, below the 3Q26 earnings presentation title.

Create Your Own Slides
Turn your ideas into professional presentations in seconds with 2slides AI.
Reference professional designs, choose your style, and generate slides with perfect text rendering. Powered by Nano Banana—start creating your presentation now.
Your AI Agent for slides. Save time, shine faster with intelligent presentation creation.


© 2026 2slides. All rights reserved.