
Part of Investor presentation examples · Semiconductor investor presentation examples
Winbond Q3 2026 Earnings Presentation: the 33-slide 3Q26 Investor Conference deck from Winbond Electronics (TWSE: 2344), the Taiwanese specialty memory maker, presented on November 3, 2026 and filed in English on Taiwan's Market Observation Post System (MOPS) for the investor conference (法說會). It reports record results in NT$ (New Taiwan dollars): consolidated net sales of NT$82,331 million (+37.6% QoQ, +278.2% YoY), a 70.6% gross margin, net income of NT$35,138 million and EPS of NT$7.58, driven by CMS (DRAM) revenue up 50% QoQ and Flash revenue up 34% QoQ, plus an outlook on tight NOR, SLC NAND and DDR4/LPDDR4 supply into 2027 and a forecast for server NOR Flash demand in AI servers.
Uses this deck’s cover as a style reference for slides made from your own content. Or pick any page below to use its layout as the reference.
Quick Navigation
Tags
Share the slides
Winbond Q3 2026 Earnings Presentation: the 33-slide 3Q26 Investor Conference deck from Winbond Electronics (TWSE: 2344), the Taiwanese specialty memory maker, presented on November 3, 2026 and filed in English on Taiwan's Market Observation Post System (MOPS) for the investor conference (法說會). It reports record results in NT$ (New Taiwan dollars): consolidated net sales of NT$82,331 million (+37.6% QoQ, +278.2% YoY), a 70.6% gross margin, net income of NT$35,138 million and EPS of NT$7.58, driven by CMS (DRAM) revenue up 50% QoQ and Flash revenue up 34% QoQ, plus an outlook on tight NOR, SLC NAND and DDR4/LPDDR4 supply into 2027 and a forecast for server NOR Flash demand in AI servers.
Detailed view of each slide page, including layout, key content and visual elements.
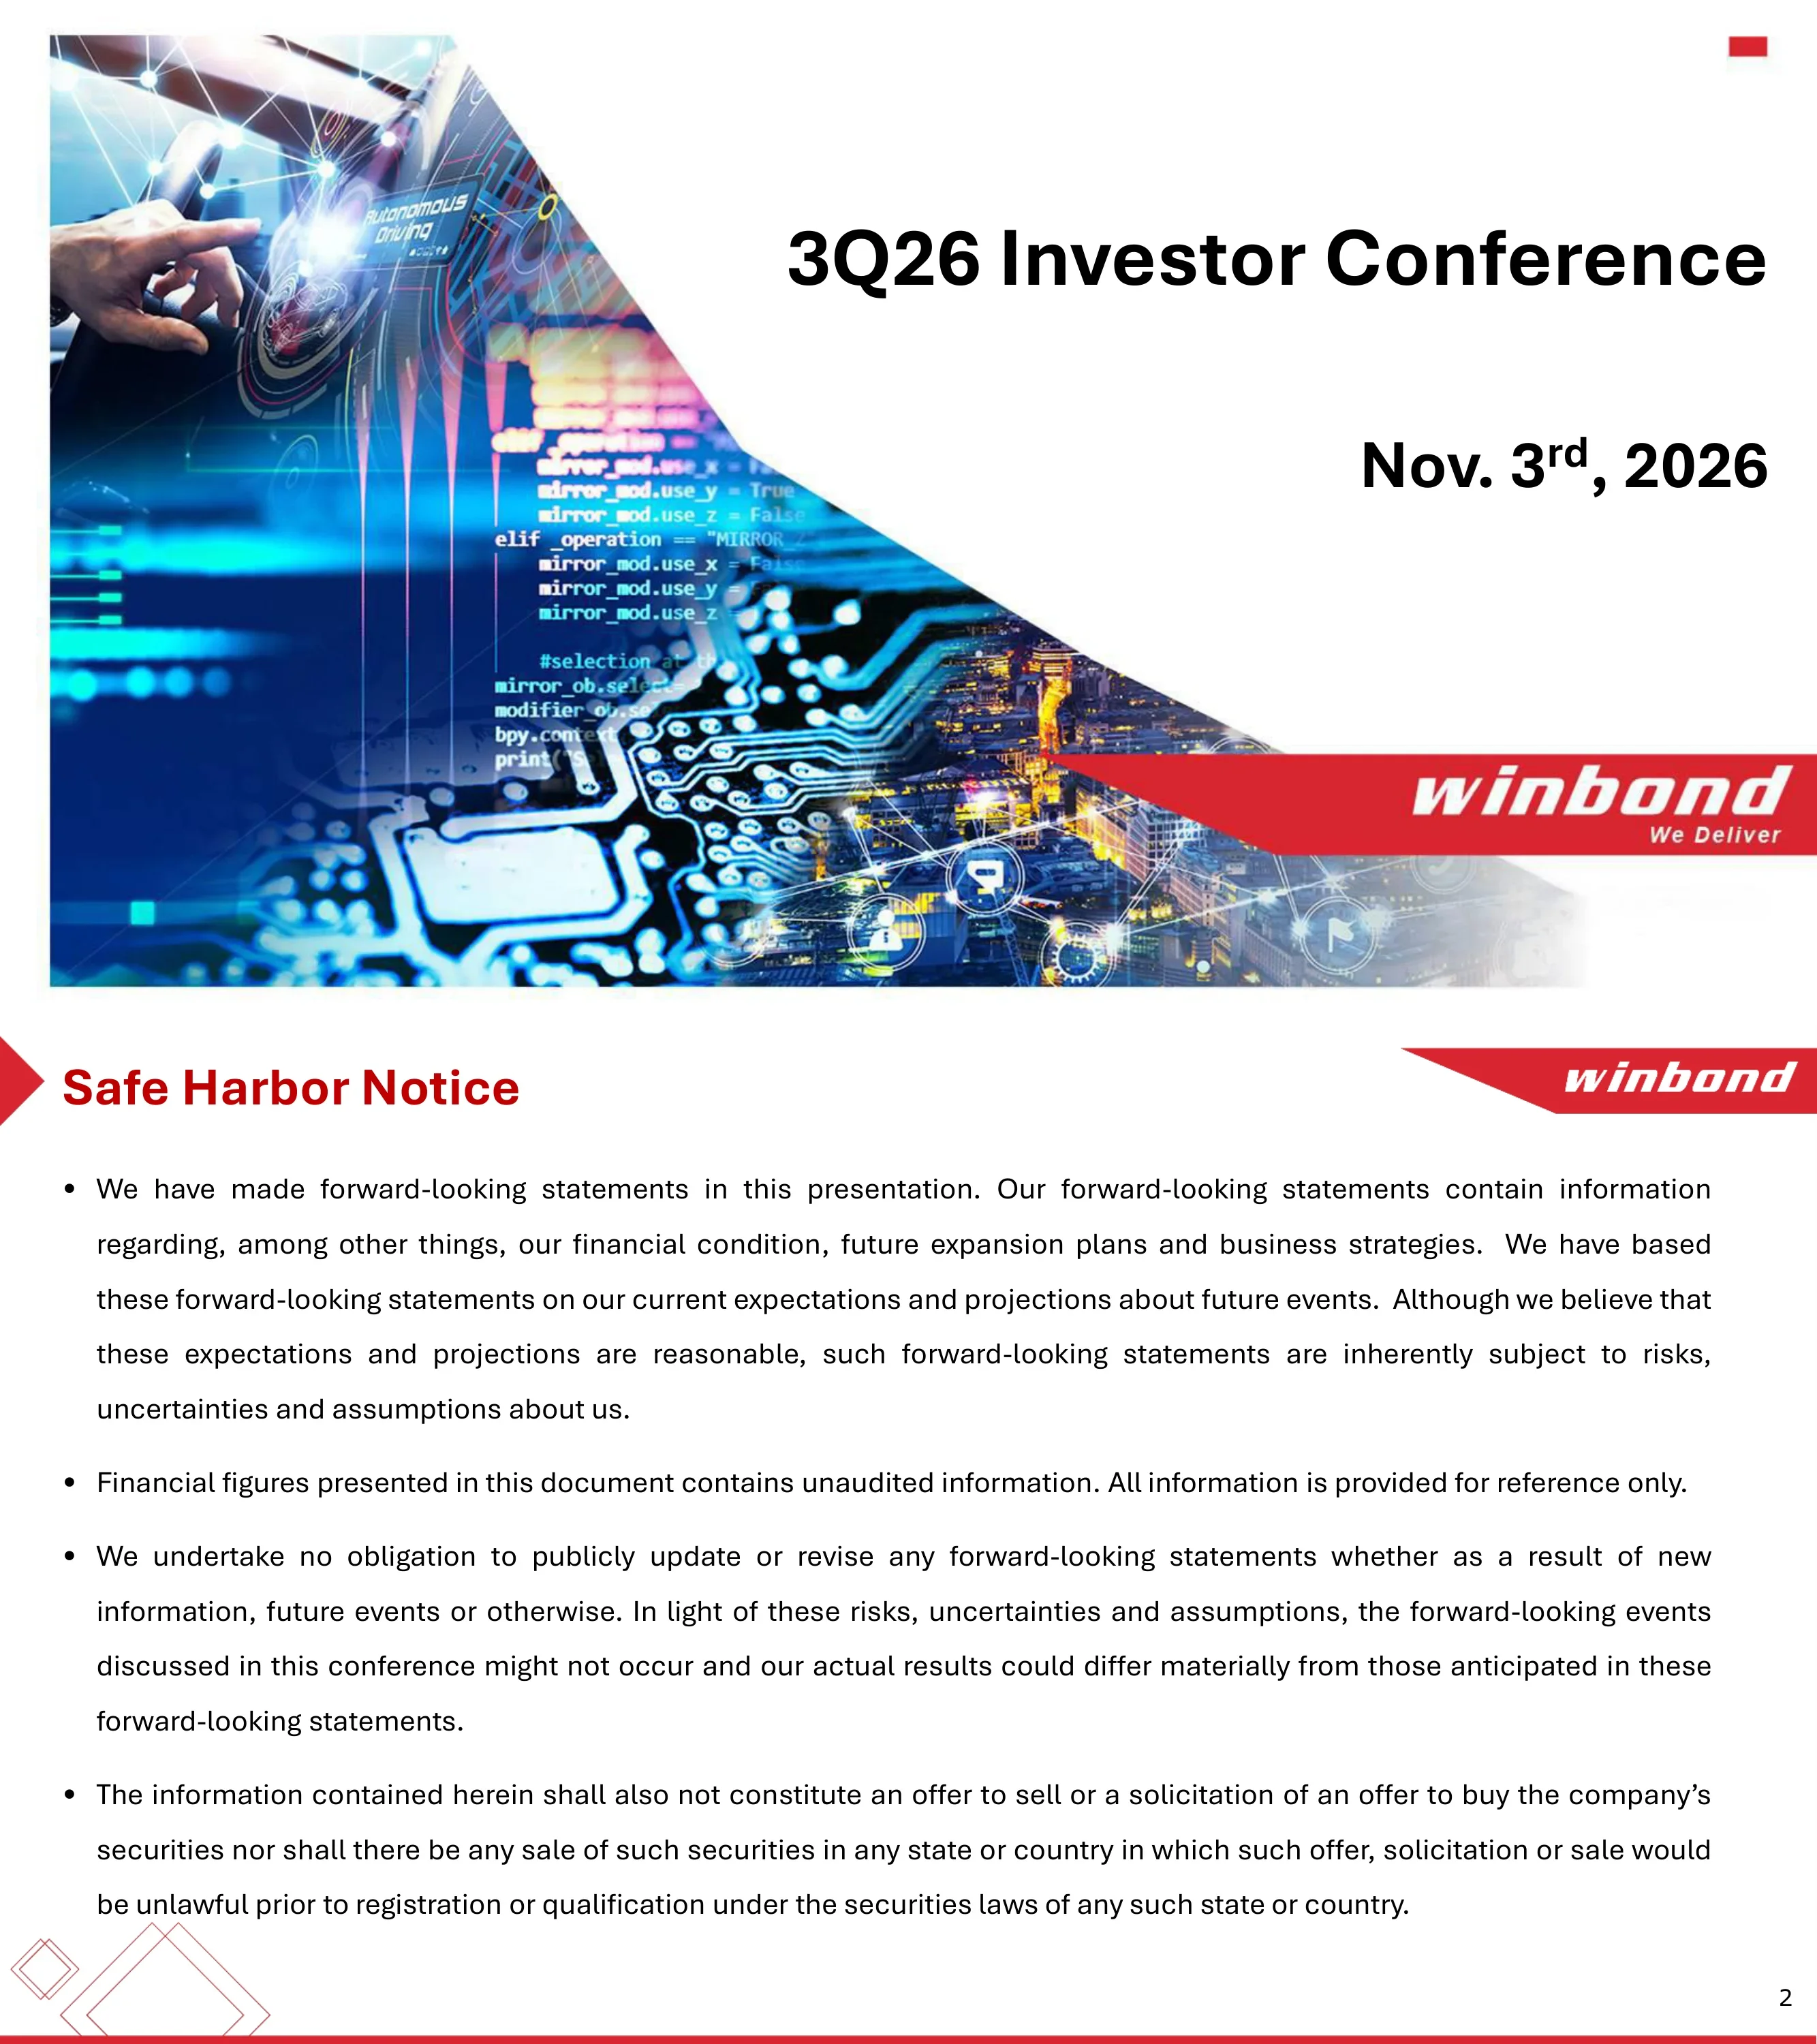
Cover slide announcing Winbond's 3Q26 Investor Conference dated November 3rd, 2026, with the Winbond 'We Deliver' logo.
Diagonal split: a full-bleed technology photo (circuit board, code and an autonomous-driving interface) on the left, title and date right-aligned on white, red logo band at the bottom right.
Standard forward-looking statement disclaimer; notes that financial figures in the deck are unaudited and for reference only, and that the deck is not an offer to sell or a solicitation to buy securities.
Red title with arrow marker top left, Winbond logo tab top right, four justified bullet paragraphs filling the slide.
Four agenda sections with presenters: 01 Financial Results (Hsiang-Yun Fan, EVP), 02 Business Recap & Outlook (James Chen, President), 03 Excellence & Forward (Jason Lin, VP), 04 Q&A.
Blue digital-hand image on the left third; numbered agenda items in red numerals with black headings and grey presenter names, connected by thin leader lines.
Section divider opening the Financial Results part of the presentation.
Angled photo of a green circuit board with chips across the top right, large black section title bottom center, red outlined diamond shapes bottom left.
3Q26 net sales NT$82,331M (+37.6% QoQ, +278.2% YoY vs. NT$21,771M); gross profit NT$58,101M with gross margin 70.6% (66.2% in 2Q26, 46.7% in 3Q25); operating profit NT$43,784M, operating margin 53.2%; net income NT$35,138M (net margin 42.7%), net income to parent NT$35,422M; EPS NT$7.58 (2Q26 NT$5.40, 3Q25 NT$0.65), 3Q26 YTD EPS NT$15.32; EBITDA NT$51,781M; average USD/NTD rate 31.99.
Financial table with five columns (3Q26, 2Q26, QoQ, 3Q25, YoY) under blue and black header cells; margin rows shaded grey and bolded; EBITDA and exchange rate in a boxed footer block.
Nine-quarter stacked bar chart of revenue by CMS (Customized Memory Solution, formerly DRAM), Flash, Logic IC and Others, rising from NT$21,312M in 3Q24 to NT$82,331M in 3Q26, with CMS reaching 58% of revenue in 3Q26 and Logic IC falling to 9%; consolidated gross margin line climbs from 29% to 71%. Side charts show 3Q26 revenue change: QoQ CMS +NT$15,841M, Flash +NT$6,743M, Logic IC -NT$142M; YoY CMS +NT$40,974M, Flash +NT$19,178M, Logic IC +NT$375M. Footnote: Others is software service revenue from AMTC and METC, under 3% of total.
Large stacked bar chart with overlaid red margin line on the left two-thirds; two small bar charts on the right for QoQ and YoY change by product; footnotes at bottom.
Memory panel: memory revenue grew from NT$12,941M (3Q24) to NT$74,284M (3Q26), with CMS share rising to 64% and Flash 36%; memory gross margin rose from 21% to 74% (10% low in 1Q25). Logic IC panel: revenue steady between NT$6,981M and NT$8,305M per quarter (NT$7,593M in 3Q26) with gross margin of 34%-41% (37% in 3Q26).
Two side-by-side framed chart panels labelled Memory and Logic IC, each with bars and a margin line over nine quarters.
Memory business 3Q26 net sales NT$74,284M (+43.7% QoQ, +425.6% YoY); gross profit NT$54,872M, gross margin 73.9% (70.3% in 2Q26, 50.8% in 3Q25); operating expenses NT$10,418M; operating income NT$44,454M, operating margin 59.8% (56.9% in 2Q26, 29.7% in 3Q25); capacity utilization about 100% in all three quarters.
Same five-column financial table style as page 5 occupying the top half, with a separate boxed capacity utilization row below and white space beneath.
At 09.30.2026: cash, cash equivalents and hedging financial assets NT$84,856M (25% of assets), accounts receivable NT$49,307M, inventories NT$29,384M, investments NT$49,839M, PP&E and ROU NT$116,431M; total assets NT$336,301M (vs. NT$293,034M at 06.30.2026 and NT$182,603M at 09.30.2025); total liabilities NT$110,763M; equity NT$225,538M; book value per share NT$46.04; debt/equity 0.49 (0.80 a year earlier); current ratio 2.50. Footnote: 4,720 million shares outstanding.
Balance sheet table with three date columns, each showing amount and percentage of total assets; totals shaded; ratio rows boxed; footnote bottom.
3Q26 operating cash flow NT$45,868M (2Q26 NT$23,306M, 3Q25 NT$2,836M); depreciation and amortization NT$7,596M; investing cash flow -NT$16,518M including CAPEX of -NT$15,948M; financing cash flow -NT$6,483M including bank loan repayment of NT$6,063M; net change +NT$23,030M; ending balance NT$84,856M; free cash flow NT$29,920M (defined as operating cash flow minus CAPEX).
Narrow centered three-column table with section subtotals shaded grey, ending balance and free cash flow separated by rules, definitions in footnotes.
Stacked bars of operating expenses by R&D-Memory, SG&A-Memory, R&D-Logic IC and SG&A-Logic IC from NT$5,974M (3Q24) to NT$14,317M (3Q26); in 3Q26 R&D-Memory NT$5,914M, SG&A-Memory NT$4,954M, R&D-Logic IC NT$2,531M, SG&A-Logic IC NT$918M. OPEX-to-revenue fell from 28%-31% to 18% in 2Q26 and 3Q26.
Full-width stacked bar chart with a red ratio line above, legend and footnote below.
Nuvoton (logic IC subsidiary) 3Q26 net sales NT$7,856M (-1.1% QoQ, +8.0% YoY); gross margin 37.4%; operating expenses NT$3,448M; operating margin -6.5%; net loss NT$559M (net margin -7.1%); EPS -NT$1.24 (2Q26 -NT$0.58, 3Q25 -NT$1.22).
Five-column income statement table matching page 5 formatting, with negative margins shown in the shaded rows.
Nuvoton at 09.30.2026: cash NT$7,586M, receivables NT$4,258M, inventories NT$7,703M (up from NT$6,869M at 06.30.2026), long-term investments NT$2,841M, PP&E and ROU NT$7,342M; total assets NT$32,162M; total liabilities NT$15,852M; equity NT$16,310M; book value per share NT$36.05; debt/equity 0.97; current ratio 1.76.
Balance sheet table with three date columns and percentage sub-columns, shaded totals and a boxed ratio block.
Three charts: EPS by year 2021 NT$3.41, 2022 NT$3.23, 2023 (NT$0.29), 2024 NT$0.14, 2025 NT$0.88 and 3Q26 YTD NT$15.32; book value per share from NT$20.71 (2021) to NT$46.04 (3Q26); EBITDA NT$30,085M (2021), NT$27,690M, NT$12,151M, NT$15,005M, NT$18,680M (2025) and NT$101,552M for 3Q26 YTD, with EBITDA-to-revenue at 56% YTD versus 16%-30% in prior years.
Dashboard grid: EPS bar chart top left, BVPS line chart bottom left, tall EBITDA bar-and-line chart on the right, each in a framed panel with a colored tab label.
Memory CAPEX on a cash basis as of November 3, 2026: NT$40.8B (2022), NT$12.7B (2023), NT$15.5B (2024), NT$5.5B (2025) and an estimated NT$39.5B for 2026, of which wafer fab equipment (WFE) is about 95%; 3Q26 YTD CAPEX was NT$23.4B.
Simple five-bar column chart with the 2026 bar split into paid (solid) and estimated (hatched) portions, plus a boxed two-bullet callout below.
Section divider opening the Business Recap & Outlook part presented by the President.
Same angled circuit-board photo divider design as page 4 with a two-line section title.
CMS revenue +50% QoQ and +620% YoY; CMS bit shipments decreased high-single digits QoQ but increased mid-single digits YoY; CMS blended ASP (US$) increased approximately in the sixties percent QoQ and over 500% YoY. Flash revenue +34.0% QoQ and +255% YoY; Flash bit shipments flat QoQ and up low-teens percent YoY; Flash blended ASP up low-thirties percent QoQ and approximately 200% YoY. Exchange rate effect +1.3% QoQ, +7.4% YoY.
Grid table with QoQ and YoY column groups, CMS and Flash sub-header bands, and rows for revenue, bit shipment, blended ASP and exchange rate.
Memory revenue by application: in 3Q26 Communication 31%, Computer 17%, Consumer 26%, Car & Industrial 26% (2Q26: 29%, 15%, 28%, 28%). Quarter-on-quarter growth: Car & Industrial +36%, Communication +55%, Consumer +35%, Computer +66%. The small bar charts have no data labels, so exact NT$ values per application are not stated.
Two pie charts (3Q26 above 2Q26) on the left and a 2x2 grid of small 2Q26-vs-3Q26 bar charts on the right, each with a growth label.
Flash revenue rose 34% QoQ and over 200% YoY in 3Q26; 24nm revenue contribution kept expanding with technology migration and mix optimization; high-density NOR revenue and shipments reached record highs. 3Q26 process mix: 58nm 52%, 32nm 17%, 46nm 16%, 24nm 7%, 90nm 5%, 45nm 3%.
Three checkbox bullets across the top, nine-quarter stacked bar chart of revenue share by process node below, with the latest quarter bold.
CMS revenue rose 50% QoQ and over 600% YoY in 3Q26; 20nm remained the key growth driver on strong DDR4/LPDDR4 sales; 16nm began ramping with significant revenue expected from 2027. 3Q26 process mix: 20nm 66%, 25nm 17%, 38nm and above 8%, 25Snm 6%, 16nm 3%.
Same format as page 19: checkbox bullets on top, stacked bar chart of revenue by node over nine quarters below.
Code Storage Flash: high-density NOR remains tight with positive pricing momentum into 2027; strong design-ins support a favorable SLC NAND pricing outlook into 2027; demand from AI servers, automotive and AI-related applications. Customized Memory Solution: further upside potential in 4Q contract pricing; supply constrained with tight conditions expected into 2027; demand from AI servers, edge AI, automotive and infrastructure.
Two-level bullet list: bold black headings with red checkbox markers, blue sub-bullets with red diamond markers.
Overall market: inflation and interest rate uncertainty may weigh on consumer and traditional electronics demand, amid market debate over CSP CAPEX; robust AI demand supports a resilient memory upcycle. Winbond: profitability momentum remained strong; DDR4 and LPDDR4 are the 2027 focus; Kaohsiung (KH) Fab Module B breaks ground in late 2026 with cleanroom planned at 50K-60K wafers per month; Module B long-term agreement (LTA) negotiations underway; CUBE on track for mass production in 2027; the acquisition of Infineon's NOR Flash and F-RAM business awaits regulatory approval, with closing expected in 2H27.
Same two-level bullet hierarchy as page 21 with Overall Market and Winbond Business headings.
Section divider for the Excellence & Forward strategy section on code storage Flash.
Angled circuit-board photo divider with the section title placed bottom left.
Product map of Winbond Flash families by density from 2Mb to 8Gb: NOR (QSPI NOR 1.2V W25Q-NE; QSPI NOR 1.8V/3V W25Q series; Octal NOR W35T-NW), Secure NOR (QSPI Secure NOR W77Q and Octal Secure NOR W77T-NW with PQC), NAND (QSPI NAND W25N, Octal NAND W35N-JW, ONFI NAND W29N) and MCP (W71N, 4+4/8+8).
Horizontal range chart: category labels in grey cells on the left, colored bars spanning the density axis at the bottom showing each family's coverage.
Three growth markets for code storage Flash: Automotive (ADAS/IVI/sensors, central compute/SDV), IoT (healthcare, wearable, IIoT) and AI Devices (servers including GP enterprise servers, AI servers, hyperscalers, AI accelerators and HP interconnect, plus edge AI and physical AI).
Three equal cards with navy header bars and bullet lists on light grey backgrounds.
Two AI demand pools: AI Servers (GP enterprise servers, AI servers, hyperscalers, AI accelerators, HP interconnect; silicon such as CPU, GPU/ASIC, DPU, BMC/PRoT, FPGA and interface controllers) and AI Devices (gen AI, agentic AI, device AI, personal AI, ambient AI, IIoT/physical AI, networking; silicon such as CPU/GPU/FPGA and MPU/MCU).
Two side-by-side cards with teal headers, each above an outlined 'Silicon' box listing the host chips that need code storage Flash.
An AI server rack contains multiple independent firmware and recovery domains (compute tray, switch tray, SmartNIC, power shelf, cooling unit). High-value NOR domains: BIOS/UEFI (host boot and recovery), GPU/xPU (VBIOS and board firmware), BMC firmware, SmartNIC (boot and config data) and switch (config and fabric firmware). Implication: multiple NOR Flash devices of various QSPI NOR densities per AI server. Source cited on slide: 'QSPI NOR in Server Strategy, 23 Sep 2026'.
Illustrated rack diagram with colored infrastructure tags on the left and server module thumbnails, plus a right-hand panel listing high-value domains and an implication note.
AI server demand for NOR Flash spans four connected ecosystems: AI server racks, accelerators, hyperscalers and SmartNIC/DPU (source: Winbond internal analysis).
Photo collage of server hardware connected by glowing lines on the left, four checkmarked rounded labels stacked on the right.
Winbond forecasts server NOR Flash demand reaching 240 million units in 2027, a 2025-2028 CAGR of 33% and 2027 YoY growth of 48%, driven by servers, AI servers, hyperscalers, AI accelerators and SmartNICs with density migration. Bars for 2025, 2026 and 2028 are unlabelled; read against the axis they are roughly 115M, 160M and 275M units (approximate). Source: Winbond internal collected and estimated.
Four-bar column chart with the 2027 bar highlighted in orange, headline arrow statement above and a rounded callout box with CAGR and growth drivers on the right.
Estimated 2027 server NOR Flash density mix: 512Mb 43%, 256Mb 18%, 1Gb 17%, 128Mb 12%, 64Mb 5%, 2Gb 5%; densities range from 16Mb to 2Gb, and 512Mb and above is estimated at 65% of 2027 server NOR demand. Source: Winbond internal collected and estimated.
Donut chart on the left with density labels inside segments, two rounded text callouts on the right.
Stacked bars of Winbond server NOR Flash bit shipments in petabits by density group (32Mb and below, 64/128/256Mb, 512Mb and above) for 2025, 2026(e) and 2027(e), with growth rates of 46% (2025), 112% (2026e) and 67% (2027e). Bars are not labelled; against the axis they are roughly 20, 43 and 72 pBits, with 512Mb and above the largest component.
Three stacked column bars with a red growth-rate line overlaid, petabit axis on the left, legend below.
Divider slide opening the question-and-answer session.
Angled circuit-board photo divider with large 'Q & A' text center left.
Closing slide with 'Thank you' and the Winbond logo.
Mirror of the cover: italic 'Thank you' on the left, technology photo cut diagonally on the right, red logo bottom left.
Common questions about this slide and the underlying presentation content.
It is the 33-slide deck Winbond Electronics (TWSE: 2344, 華邦電) used at its 3Q26 Investor Conference on November 3, 2026. It covers consolidated financial results, the memory and Nuvoton logic businesses, market outlook, and a strategy section on code storage Flash for AI servers.
This is the English version Winbond filed on Taiwan's Market Observation Post System (MOPS, 公開資訊觀測站) for its investor conference (法說會). Winbond also files a Traditional Chinese version of the same deck on MOPS; the figures are the same.
Consolidated net sales were NT$82,331 million (New Taiwan dollars), up 37.6% QoQ and 278.2% YoY. Gross margin reached 70.6%, operating margin 53.2%, net income NT$35,138 million and EPS NT$7.58, bringing 3Q26 year-to-date EPS to NT$15.32. The deck notes the figures are unaudited.
Pricing. CMS (Customized Memory Solution, Winbond's DRAM business) revenue rose 50% QoQ even though bit shipments fell high-single digits, because blended ASP rose roughly sixty percent. Flash revenue rose 34% QoQ on flat bits and an ASP up in the low thirties percent.
It expects tight high-density NOR and constrained CMS supply to persist into 2027, sees further upside in 4Q contract pricing, will focus on DDR4 and LPDDR4 in 2027, plans to break ground on Kaohsiung Fab Module B in late 2026, targets CUBE mass production in 2027, and expects to close the acquisition of Infineon's NOR Flash and F-RAM business in 2H27 subject to approvals.
Each AI server holds several independent firmware domains (BIOS/UEFI, GPU VBIOS, BMC, SmartNIC, switch), each needing NOR Flash. Winbond forecasts server NOR demand reaching 240 million units in 2027 (2025-2028 CAGR of 33%), with 512Mb and higher densities making up an estimated 65% of 2027 demand.
Yes. It follows a clear structure many semiconductor companies use: safe harbor, agenda with presenters, consolidated income statement, balance sheet and cash flow tables, segment charts, qualitative shipment and ASP guidance, outlook bullets, and a strategy section. The red-white corporate style with blue-teal charts is easy to adapt.
Yes. The original PDF is available to download from this page, and every slide is described above with its figures so you can find the data you need before opening the file.
Original English deck filed by Winbond Electronics (2344) for its November 3, 2026 investor conference.

Create Your Own Slides
Turn your ideas into professional presentations in seconds with 2slides AI.
Reference professional designs, choose your style, and generate slides with perfect text rendering. Powered by Nano Banana—start creating your presentation now.
Your AI Agent for slides. Save time, shine faster with intelligent presentation creation.


© 2026 2slides. All rights reserved.