
Part of Investor presentation examples
UOB Investor Presentation November 2026 - United Overseas Bank (SGX: U11) investor deck covering 3Q26 and 9M26 results, asset quality, strategy and appendices. Lodged with SGX on 10 November 2026.
Uses this deck’s cover as a style reference for slides made from your own content. Or pick any page below to use its layout as the reference.
Quick Navigation
Tags
Share the slides
UOB Investor Presentation November 2026 - United Overseas Bank (SGX: U11) investor deck covering 3Q26 and 9M26 results, asset quality, strategy and appendices. Lodged with SGX on 10 November 2026.
Detailed view of each slide page, including layout, key content and visual elements.
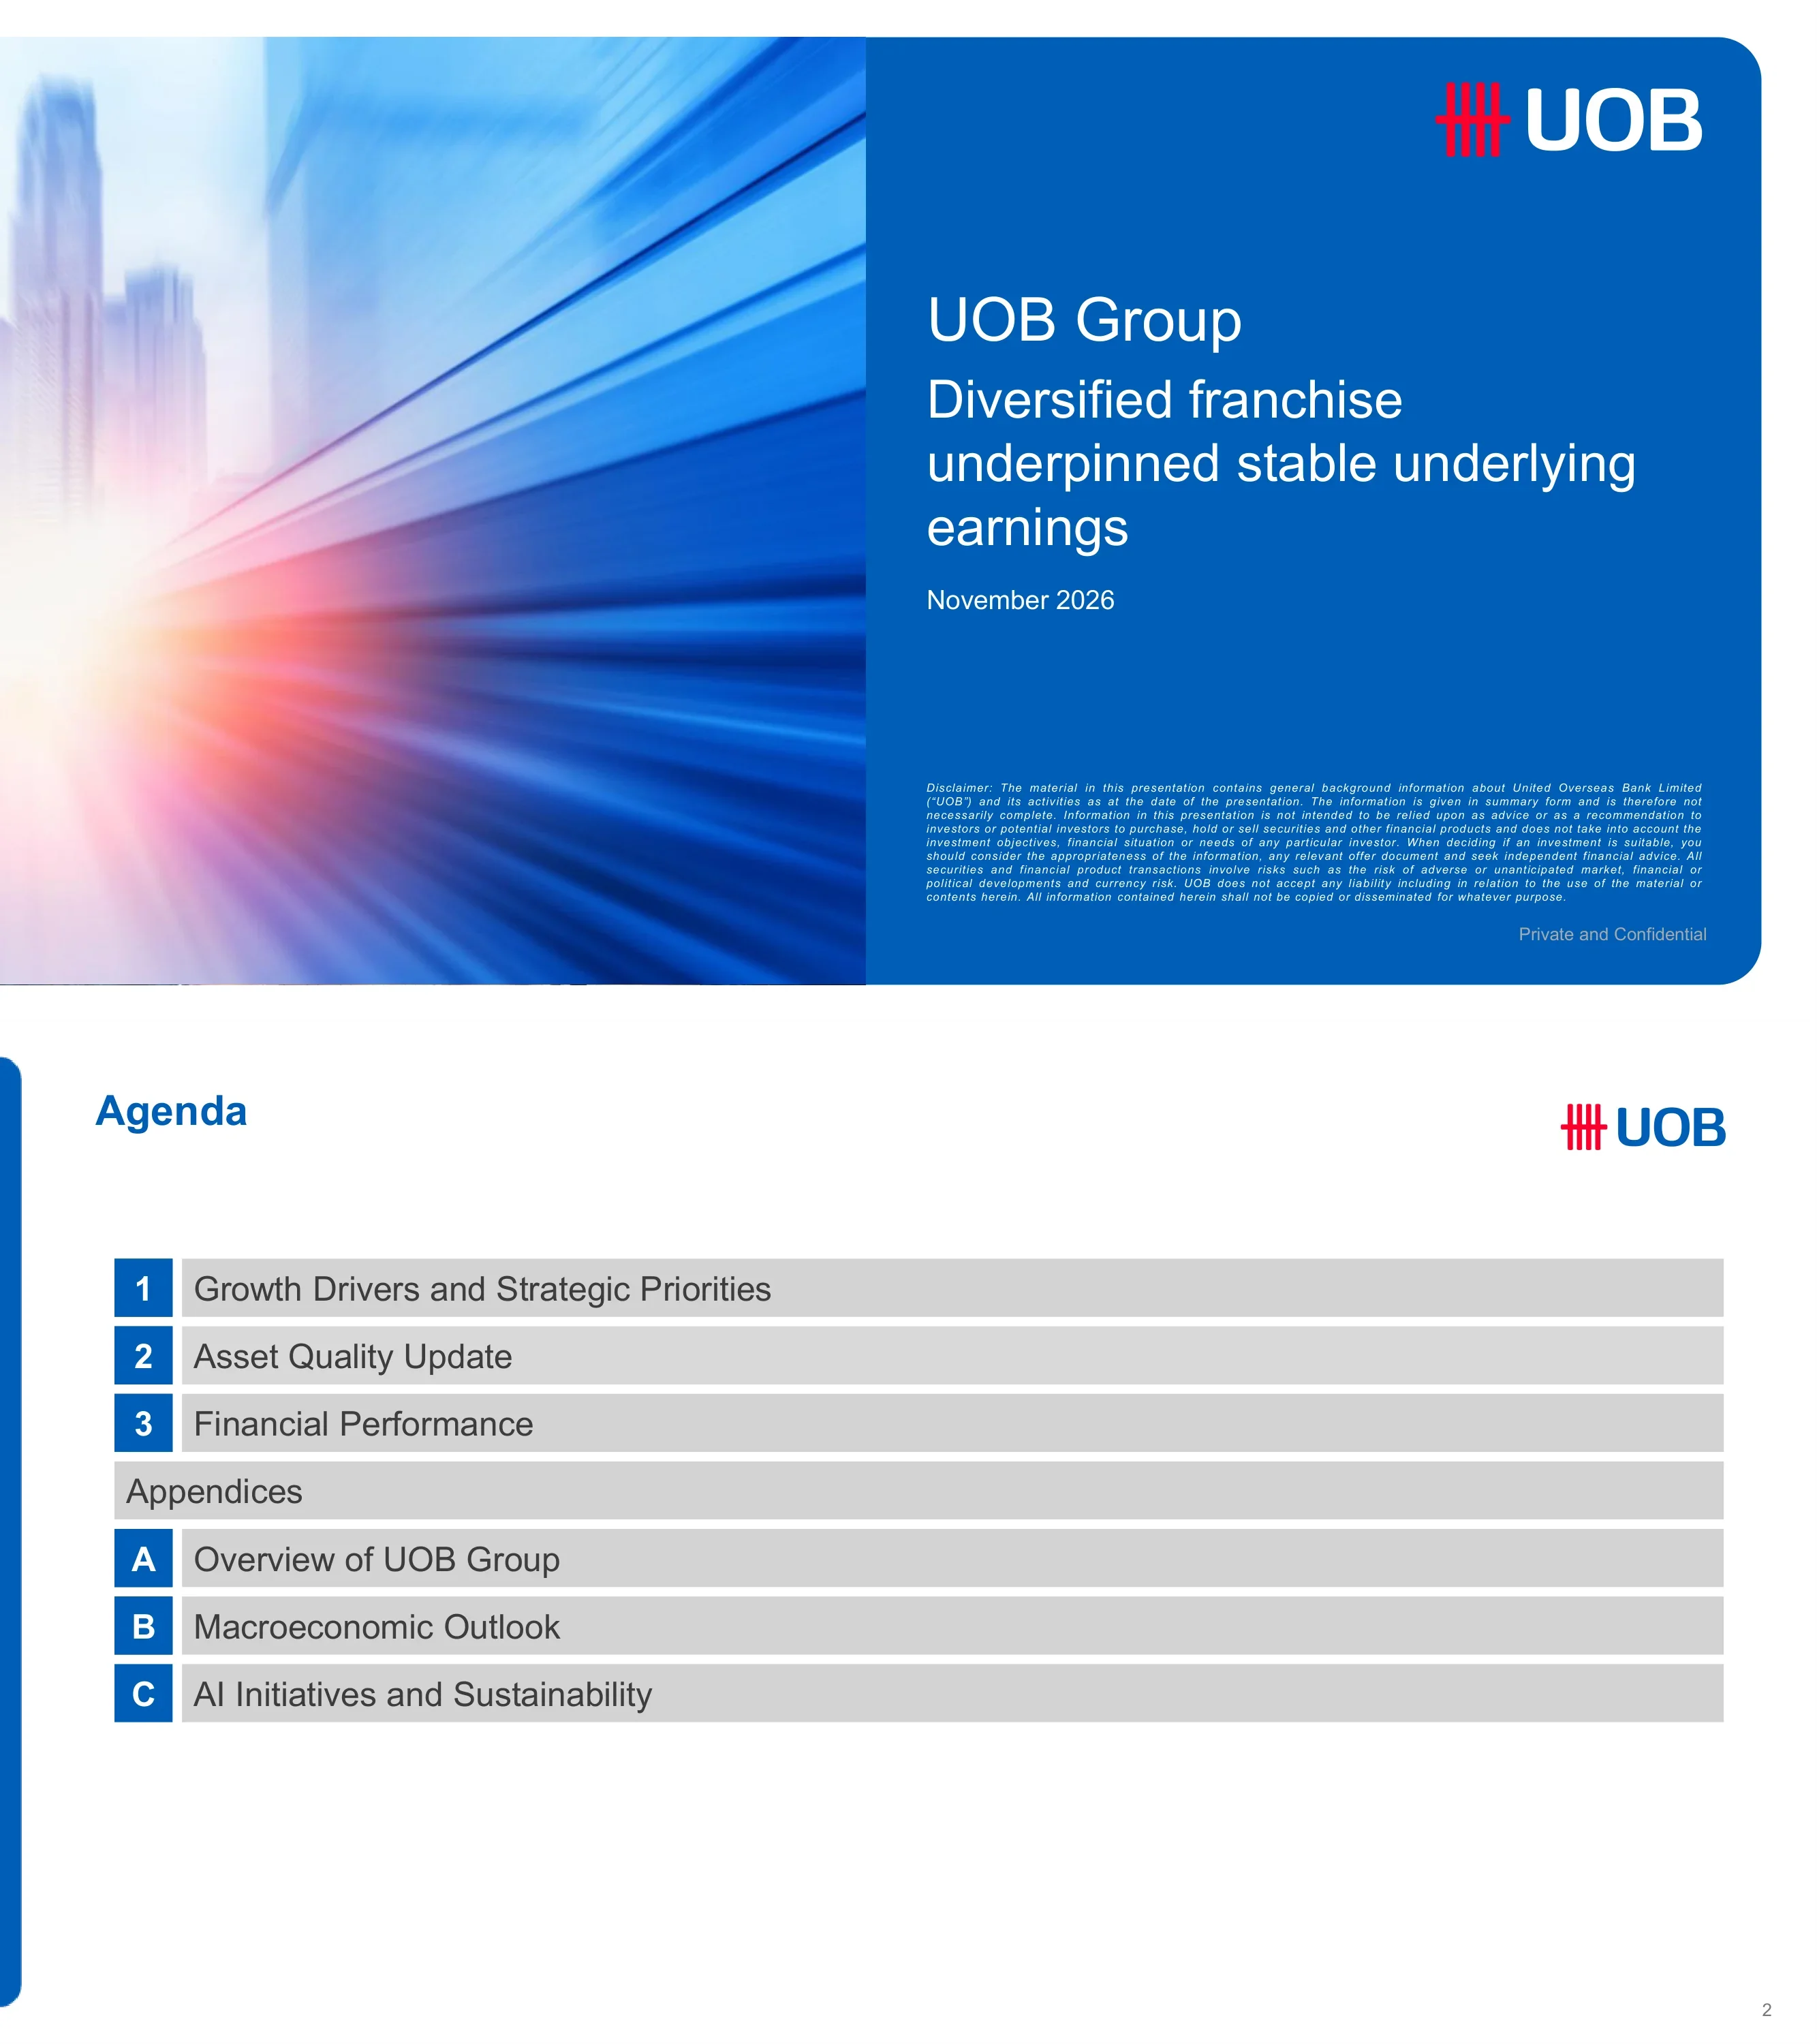
Title slide of the UOB Group investor presentation dated November 2026, headlined 'Diversified franchise underpinned stable underlying earnings'. A small-print disclaimer and a 'Private and Confidential' marker sit at the bottom.
Split cover: blurred skyline-and-light-streak photo on the left, solid blue panel on the right with the UOB logo, title, subtitle, date and disclaimer.
Lists three main sections - 1 Growth Drivers and Strategic Priorities, 2 Asset Quality Update, 3 Financial Performance - plus appendices A Overview of UOB Group, B Macroeconomic Outlook and C AI Initiatives and Sustainability.
Vertical stack of grey bars; numbered or lettered blue squares on the left of each row, an 'Appendices' divider bar in the middle.
Section divider introducing the growth drivers and strategic priorities part of the deck (Group Retail and Wholesale Banking pages follow).
Full-bleed blue rounded panel with a single large white section title on the left and the UOB logo at the top right.
UOB Group Retail serves more than 8 million customers with more than S$5b (Singapore dollars) of income, about S$200b of AUM and more than S$60b of consumer spend. UOB is the number 1 card issuer in ASEAN with S$60b of FY25 card billings and about 20% market share in its mature markets; ASEAN-4 card billings are shown growing at a +26% CAGR from 2022 to 9M26.
Left panel: dot-matrix Asia map with customer counts per country (Thailand 2.5m, Malaysia 1.7m, Vietnam 300k, Singapore 2.5m, Indonesia >1m) and a highlighted stats box. Right panels: card leadership icons, stacked bar chart of card billings 2022-9M26 (bars unlabelled), and Dine/Shop/Travel/Entertainment lifestyle tiles. Callout banner at the bottom.
Tailored propositions for three client tiers: Private Bank, Affluent (~1m customers, ~65% engagement rate, 1 in 2 convert to wealth) and Emerging Affluent (~7m customers, 1 in 2 unit-trust sales done digitally, S$2b invested in retail CIO funds). UOB won Best DPM at the Euromoney Private Banking Awards 2026 for the second year; its Balanced Discretionary Portfolio returned 9.0% over one year versus an 8.6% peer average, and DPM assets under management grew more than 40%.
Left: three horizontal rows (segment label, customer icon, value proposition bullets, two blue KPI boxes joined by an arrow). Right: three rounded stat cards under the heading 'What we do best: CIO led Advisory'. Footnotes at the bottom.
Group wealth income grew at a +19% CAGR from 2022 to 2025 and ASEAN-4 wealth income rose +22% YoY in 9M26; the target is to double wealth income by 2030 from S$1.28b in 2025, with cross-sell from the Citi acquisition. Four pillars - People, Advisory, Products, Platform - underpin the plan.
Left panel: two bar charts (group wealth income by year, ASEAN-4 9M25 vs 9M26) with callout boxes. Right panel: four icon columns with sub-items. Full-width takeaway banner below.
ASEAN-4 income contribution rose from 23% (2022) to 26% (9M26) of GWB income; trade loans increased from 15% to 21% of total loans and CASA from 47% to 55% of deposits. Growth rates shown: transaction banking income +3% CAGR, loan and trade fees +2%, customer treasury +4%, gross loans +6%, deposits +3%.
Two large panels, each with a pair of mini-charts: line and stacked-bar charts for income mix on the left, loans and deposits on the right; summary banner at the bottom.
ASEAN has combined GDP above US$4.3 trillion (2025), US$4.4 trillion of total trade and 20.5% intra-ASEAN trade. UOB's FSCM anchors are up 65% and spokes up 104% since 2022; trade loans and CASA deposits each grew at a 12% CAGR and digital volume at 16%. A case study covers TMT/data centres and renewable energy/BESS.
Top-left fact panel, top-right anchor-and-spoke metrics with three bar charts (2022-9M26), bottom-left sector icon row, bottom-right case-study checklist, footnote on FSCM.
ASEAN FDI inflows grew from US$115b (2015) to US$244b (2025), more than 2x, lifting ASEAN's share of global FDI about 3x to 15%. Top recipients in 2025: Singapore 151, Indonesia 21, Vietnam 20, Thailand 19, Malaysia 15 (US$b). UOB has supported more than 5,500 companies and facilitated more than S$55 billion of investment, with case studies on Gold Peak Technology (RM670m) and FIC Global in JS-SEZ.
Top: annual FDI bar chart and a horizontal bar chart of five markets. Bottom: icon stats panel and two-column case-study panel with a concluding banner.
Three strategic pillars - Revenue uplift, Cost optimisation and Capital efficiency - each with bulleted actions such as Strategic Client 2.0, FSCM anchors, AI-driven productivity, RWA efficiency and de-risking real estate hot spots in Greater China and the US. Aspirations: No. 1 ASEAN trade bank, No. 2 wholesale lender at home market and double-digit Global Markets customer income growth.
Single framed panel with a blue header, three columns with icon headings, sub-heading chips and check-mark bullet lists; aspiration banner at the bottom.
Section divider for the asset quality update (NPL, coverage, credit cost and real estate exposure pages follow).
Full-bleed blue rounded panel with a single large white section title on the left and the UOB logo at the top right.
NPL ratio was 1.5% in 3Q26 (1.6%, 1.5%, 1.5%, 1.6% in prior quarters). Total non-performing assets were S$5,827m in 3Q26 versus S$5,809m in 3Q25, split Singapore 793, ASEAN-4 2,160, Greater China 2,456 and rest of world 418. Non-individual new NPAs were 500m against upgrades, recoveries and write-offs of (361)m.
Line of NPL ratio over five stacked columns by geography (3Q25-3Q26), with a two-row table of new NPAs and upgrades below.
Total allowances including RLAR were S$4,983m at Sep-26 (specific 1,232, general 3,372, RLAR 379) versus S$5,787m at Sep-25. NPA coverage was 86% and unsecured NPA coverage 269% after collateral; specific allowance/NPA was 21% and general allowance including RLAR to performing loans 0.9%.
Two trend lines on top, stacked columns for Sep-25 to Sep-26 in the middle, and a shaded table of coverage ratios below.
Total credit costs were 24bps in 3Q26 and 26bps for 9M26 (versus 68bps in 9M25); specific credit costs were 22bps and 30bps. Allowances on loans were S$695m for 9M26 (specific 795, general write-back 100) versus S$1,729m for 9M25, and S$218m in 3Q26.
Left: 9M25 vs 9M26 stacked columns with line overlays; centre divider; right: five-quarter columns and lines for 3Q25-3Q26.
Greater China: customer loans S$49b at Sep-26 with real estate and hospitality (REH) S$20b, a 40% mix, NPL ratio 5.0% and NPA coverage 40%. United States: loans S$17b, REH S$6b (34% mix), NPL 1.3%, NPA coverage 214%. REH NPL, special mention and pass shares of Group loans are also shown.
Two side-by-side framed panels (Greater China, United States), each with stacked columns Sep-25 to Sep-26, a small split bar, and rows of REH mix, NPL ratio, NPA and unsecured coverage.
Section divider introducing the financial performance pages (3Q26 and 9M26 results, segments, margins, capital).
Full-bleed blue rounded panel with a single large white section title on the left and the UOB logo at the top right.
3Q26 net profit was S$1.3 billion. 9M26 wealth income rose 13% YoY, credit card income 25% and invested AUM 9%; trade loans grew 31%, CASA 9% and loans 9%; Global Markets income rose 6%. NII was broadly stable QoQ with 2027 NII guidance above 2026; NPL ratio improved to 1.5%, credit costs 24bps in 3Q26 (26bps YTD), 2027 credit cost guidance 25-30bps; dividend payout ~50% and ~42% of the S$2 billion buyback completed.
Four horizontal bands separated by blue rules, each with a left-hand icon and bold headline plus bullets.
3Q26 net profit was S$1,250m (QoQ -15%, vs S$443m in 3Q25) and 9M26 net profit S$4,165m, +27% YoY. 3Q26 total income was S$3,381m (NII 2,278, fees 733, other 370), expenses S$1,570m and operating profit S$1,811m; subtitle notes underlying earnings were stable after prior-quarter divestment gains.
Full-width P&L table with columns 9M26, 9M25, YoY, 3Q26, 2Q26, QoQ, 3Q25, YoY; bold subtotal rows.
Net profit after tax moved from S$3,271m (9M25) to S$4,165m (9M26), with allowances falling S$1,258m (-65%) offsetting lower NII (-109m), other non-interest income (-101m), higher expenses (-93m) and tax/NCI (-200m). Key indicators: NIM 1.75%, cost/income 45.4%, ROE 11.1% (9.0% in 9M25).
Top: waterfall bridge from 9M25 to 9M26 with percentage changes. Bottom: key-indicators table with oval value highlights.
Net profit after tax fell from S$1,478m (2Q26) to S$1,250m (3Q26): other non-interest income -262m (-41%) and higher allowances (-47m) outweighed fee income +68m and lower expenses +59m. NIM 1.68% (1.74% in 2Q26, 1.82% in 3Q25), cost/income 46.4% and ROE 10.1% (11.8% in 2Q26, 3.5% in 3Q25).
Waterfall bridge from 2Q26 to 3Q26 over a key-indicators table with QoQ and YoY change columns.
9M26 income S$3,844m (+1%): lending and deposits 2,029 (-10%), wealth 1,099 (+13%), credit cards 716 (+25%); profit before tax S$1,547m (+1%). AUM was S$204b at Sep-26 (invested 88, deposits 117), net new money S$5b, invested AUM mix 43% versus 41%; cost/income 54.2%, credit costs 21bps, loans S$120b, deposits S$203b.
Upper left: income-statement table; upper right: highlights text box; bottom: key-metrics table, AUM stacked-bar chart and card billings bar chart.
9M26 income S$4,425m (-8%): transaction banking 2,050, loans 1,555, investment banking 324, customer treasury 496; profit before tax S$2,818m (+32%) as allowances fell to S$377m. Gross loans reached S$273b (+9%) and deposits S$239b (+13%); cost/income 27.8%, credit costs 23bps, non-real-estate income mix 72%.
Same dashboard layout as Group Retail: P&L table, highlights box, key metrics, loans and deposits stacked-bar charts.
Global Markets total income was S$1,806m in 9M26 (+6% vs 1,704m): treasury customer 897 and non-customer 909. 3Q26 income was S$564m (-3% QoQ vs 584m). Total assets excluding derivatives were S$173b (+12%).
Left bar pair (9M25 vs 9M26), divider, five-quarter bars on the right and a row of total-asset boxes at the bottom.
9M26 NII was S$6,900m (-2%) with NIM 1.75% (1.91%), loan margin 2.05% (2.26%) and interbank margin 1.14%. 3Q26 NII S$2,278m (-1% QoQ) with NIM 1.68%, loan margin 1.95%; average interest-bearing assets rose to S$538b.
Margin trend lines above stacked NII bars, 9M comparison on the left and five quarters on the right, asset boxes underneath.
NIM fell from 1.74% in 2Q26 to 1.68% in 3Q26: asset repricing -0.01, funding cost -0.07, volume/mix +0.02. Loan margin moved from 2.05% to 1.95%; SGD repricing -0.02 (3M SORA average +0.10) and USD -0.03 (3M SOFR -0.01).
Single waterfall chart with margin boxes at the top and rate reference lines below.
9M26 fee income was S$2,675m (+2%) with wealth 720, credit card 871, loan/trade 796 and others 289. 3Q26 fees reached S$945m (+8% QoQ): wealth 258, credit card 299, loan/trade 293, others 95.
Stacked columns split into 9M comparison and five-quarter series with growth callouts.
9M26 expenses were S$4,722m (+2%): staff 2,688, IT 884, other 1,150; cost/income 45.4% vs 44.0%. 3Q26 expenses S$1,570m (-4% QoQ), cost/income 46.4%.
Cost/income line above stacked expense bars for 9M and quarterly views.
Repeats the credit-cost chart from page 14: total credit costs 26bps (9M26) and 24bps (3Q26), with allowances of S$695m for 9M26.
Identical to page 14: 9M panel, divider and five-quarter panel.
Customer loans were S$372b at Sep-26. Geography: Singapore 187, ASEAN-4 79, Greater China 49, rest of world 57. Largest industries: building and construction 24%, housing 23%, general commerce 12%, FIs 11%, manufacturing 10%. Group Retail is 32% and GWB and others 68%.
Three panels: industry donut, stacked column chart by geography, two segment donuts.
Funding totalled S$533b at Sep-26 (CASA 244, FD and others 203, wholesale 86). LCR 152%, NSFR 112%, loan/deposit ratio 82.5%; CASA/deposit ratio 54.6% (57.0% a year earlier).
Three ratio lines above stacked funding bars and a CASA ratio table.
CET1 ratio 14.6% at Sep-26 (fully loaded 14.0%); RWA S$284b; leverage ratio 6.3%.
CET1 lines above RWA columns and a leverage ratio table.
Strategic divestment with purchase consideration of S$555 million, pre-tax gain ~S$330 million and ~14bps CET1 uplift. A strategic partnership with Allianz Global Investors expands investment solutions and open architecture and reinforces the advisory-led approach.
Two columns divided by a vertical timeline arrow.
Appendix divider introducing the UOB group overview pages.
Full-bleed blue rounded panel with a single large white section title on the left and the UOB logo at the top right.
Founded August 1935; about 430 branches and offices in 19 markets. Key 9M26 statistics: gross loans S$372b, deposits S$447b, loan/deposit 82.5%, NSFR 112%, LCR 152%, CET1 14.6%, leverage 6.3%, ROE 11.1%, ROA 0.95%, NIM 1.75%, cost/income 45.4%, NPL 1.5%. Ratings Aa1/AA-/AA- with stable outlook.
Left: Founding and Expansion boxes; right: key statistics list with ratings table.
Group Retail, Group Wholesale Banking and Global Markets are the three franchises. UOB shows awards (Euromoney ASEAN Best Retail Bank 2026, Best SME Bank in the World 2026, Global Finance Best Bank in Asia-Pacific 2025) and SGD market shares of 20% (deposits) and 24% (loans).
Org chart at top, awards row left and domestic share bars right.
NPAT trend from S$92m (1980) to S$2,696m (2010), S$4,343m (2019), S$2,915m (2020), S$6,045m (2024) and S$4,682m (2025, including pre-emptive general allowance). Acquisition history spans 1971-2005 and Citi consumer businesses (Malaysia, Thailand 2022; Vietnam, Indonesia 2023).
Bullets on top, a long-run NPAT line over a growth arrow with acquisition boxes.
Branches: Thailand 139, Indonesia 82, Malaysia 55, Singapore 42, Greater China 20, Vietnam 5, Myanmar, Philippines and Australia 1 each. Group Retail income S$3.8b (30% of PBT) with AUM S$204b; GWB and Global Markets income S$4.4b (70% of PBT), trade loans +31%.
Left: branch map; right: segment performance tiles.
UOB cost/income 45%, ROA 1.0%, loan/deposit 83%, ratings Aa1/AA-/AA-. Peers compared: OCBC, DBS, HSBC, SCB, BOA, Citi, CBA, NAB, RBC, TD, CIMB, MBB.
Dense table with bars and UOB highlighted.
UOB CET1 14.6% (fully loaded 14.0%) versus DBS 15.9%, OCBC 15.5%; UOB ROE 11.1% and leverage 6.3%.
Two bar charts: CET1 and leverage ratios.
Ratings Aa1/P-1 (Moody's), AA-/A-1+ (S&P), AA-/F1+ (Fitch). S$25b equivalent of public issuances broken down by currency, debt class, issue date and maturity.
Rating header and four donut charts.
Four themes: Stable management, Integrated regional platform, Strong fundamentals (CET1 14.6%, loan/deposit 82.5%) and Balanced growth with stability.
Four pale-blue cards with icons and bullets.
Appendix divider introducing macroeconomic outlook pages.
Full-bleed blue rounded panel with a single large white section title on the left and the UOB logo at the top right.
GDP growth projections (2025/2026F/2027F, %): China 5.0/4.6/4.5, Vietnam 8.0/9.2/8.8, Thailand 2.4/1.9/2.0, Malaysia 5.2/5.0/4.6, Singapore 5.0/5.7/3.2, Indonesia 5.1/5.2/5.4. FDI into ASEAN10 US$243.9b in 2025.
Left: map with clustered bars; right: two trade line charts and an FDI bar chart.
Fed funds 3.75-4.00% after a September 2026 hike; US 10-year 5.28%; SG 3M SORA 1.23%; forecasts through 3Q27.
Rates table above commentary.
Four comparison charts for Singapore, Malaysia, Thailand and Indonesia: foreign reserves, current account, debt to equity and foreign-currency loan mix.
2x2 chart grid.
Housing price indices, savings rates, unemployment and price-to-income ratios; Singapore PIR 5.9.
2x2 grid of charts.
Regulatory minimums for BCBS, Singapore, Malaysia, Thailand and Indonesia: CET1, Tier 1, total CAR, buffers, leverage, LCR and NSFR.
Comparison matrix.
Appendix divider introducing AI and sustainability pages.
Full-bleed blue rounded panel with a single large white section title on the left and the UOB logo at the top right.
AI strategy pyramid: Agentic AI, more than 30 BYOB bots, more than 30,000 staff on Copilot, Gen-AI software development, foundations, workforce. More than 27k active Copilot users, ~1.5m prompts per month, 30+ bots, UOBuddy cuts tasks from ~30 minutes to seconds.
Left pyramid with descriptions; right usage-stats panel; closing banner.
Three cases: Private Bank wealth advisory, Program AURA, FDI leads (>1,500 leads in 1H26).
Left: four-pillar flow; right: four-step FDI panel; bottom: AURA bar.
Five-part talent strategy: Literacy, Acceleration, Acquisition, Mobility, Assurance.
Five columns with a four-box bottom row.
Timeline 2015-2026: Establishing, Improving, Strengthening, with net zero commitment and coal and palm oil policies.
Four-phase timeline.
From 2019 qualitative assessment to improved methodology 2022-2026; metrics aligned to ISSB.
Four columns with future plan bar.
Targets per sector: Power 64%/98%, Automotive 58%/net zero, Real estate 36%/97%, Construction 31%/85%, Steel 20%/92%; covers ~60% of corporate lending.
Left: two sector groups; right: rationale panel.
Five emissions intensity charts, each trending below reference pathway: Power 39%, Automotive 8%, Real estate 8%, Construction 4%, Steel 3%.
Five charts in two sector panels.
About 20% of loan book with high impacts; five sub-sectors identified.
Left: gradient bar and sector photos; right: bullets.
Opportunity matrix for Agriculture, Construction and Mining with legend.
3x4 matrix.
Closing slide with the UOB Chinese seal logo and tagline 'Right By You'.
Centered logo on white.
Common questions about this slide and the underlying presentation content.
It covers UOB Group's growth drivers (Group Retail and Wholesale Banking), asset quality, 3Q26 and 9M26 financial performance, and appendices on the group overview, macroeconomic outlook, AI initiatives and sustainability.
The period is 3Q26 and 9M26 (to 30 September 2026). Net profit was S$1,250m in 3Q26 and S$4,165m (+27% YoY) in 9M26, NIM 1.68% in 3Q26, NPL ratio 1.5% and CET1 ratio 14.6%.
UOB lodged the announcement 'UOB Investor Presentation_Nov 2026' with the Singapore Exchange (SGX) on 10 November 2026.
Singapore listed companies report half-yearly, so the Q1 and Q3 updates are business updates rather than full financial statements.
Yes, the gallery page offers the slides for download, subject to the availability on the page.
Yes. The deck's waterfall charts, stacked bars, KPI tables and section dividers make a good starting point for a bank or finance results presentation. Replace UOB's figures and branding with your own.
Figures are in S$ (Singapore dollars) unless marked otherwise, for example US$ on macro pages.
Yes, three appendices: A overview of UOB Group, B macroeconomic outlook, C AI initiatives and sustainability.
Official investor relations site with results and presentations.

Create Your Own Slides
Turn your ideas into professional presentations in seconds with 2slides AI.
Reference professional designs, choose your style, and generate slides with perfect text rendering. Powered by Nano Banana—start creating your presentation now.
Your AI Agent for slides. Save time, shine faster with intelligent presentation creation.


© 2026 2slides. All rights reserved.