
Part of Investor presentation examples
Unilever Investor Event 2024 CEO Presentation - Growth Action Plan 2030
Quick Navigation
Tags
Share the slides
Unilever Investor Event 2024 CEO Presentation - Growth Action Plan 2030
Detailed view of each slide page, including layout, key content and visual elements.
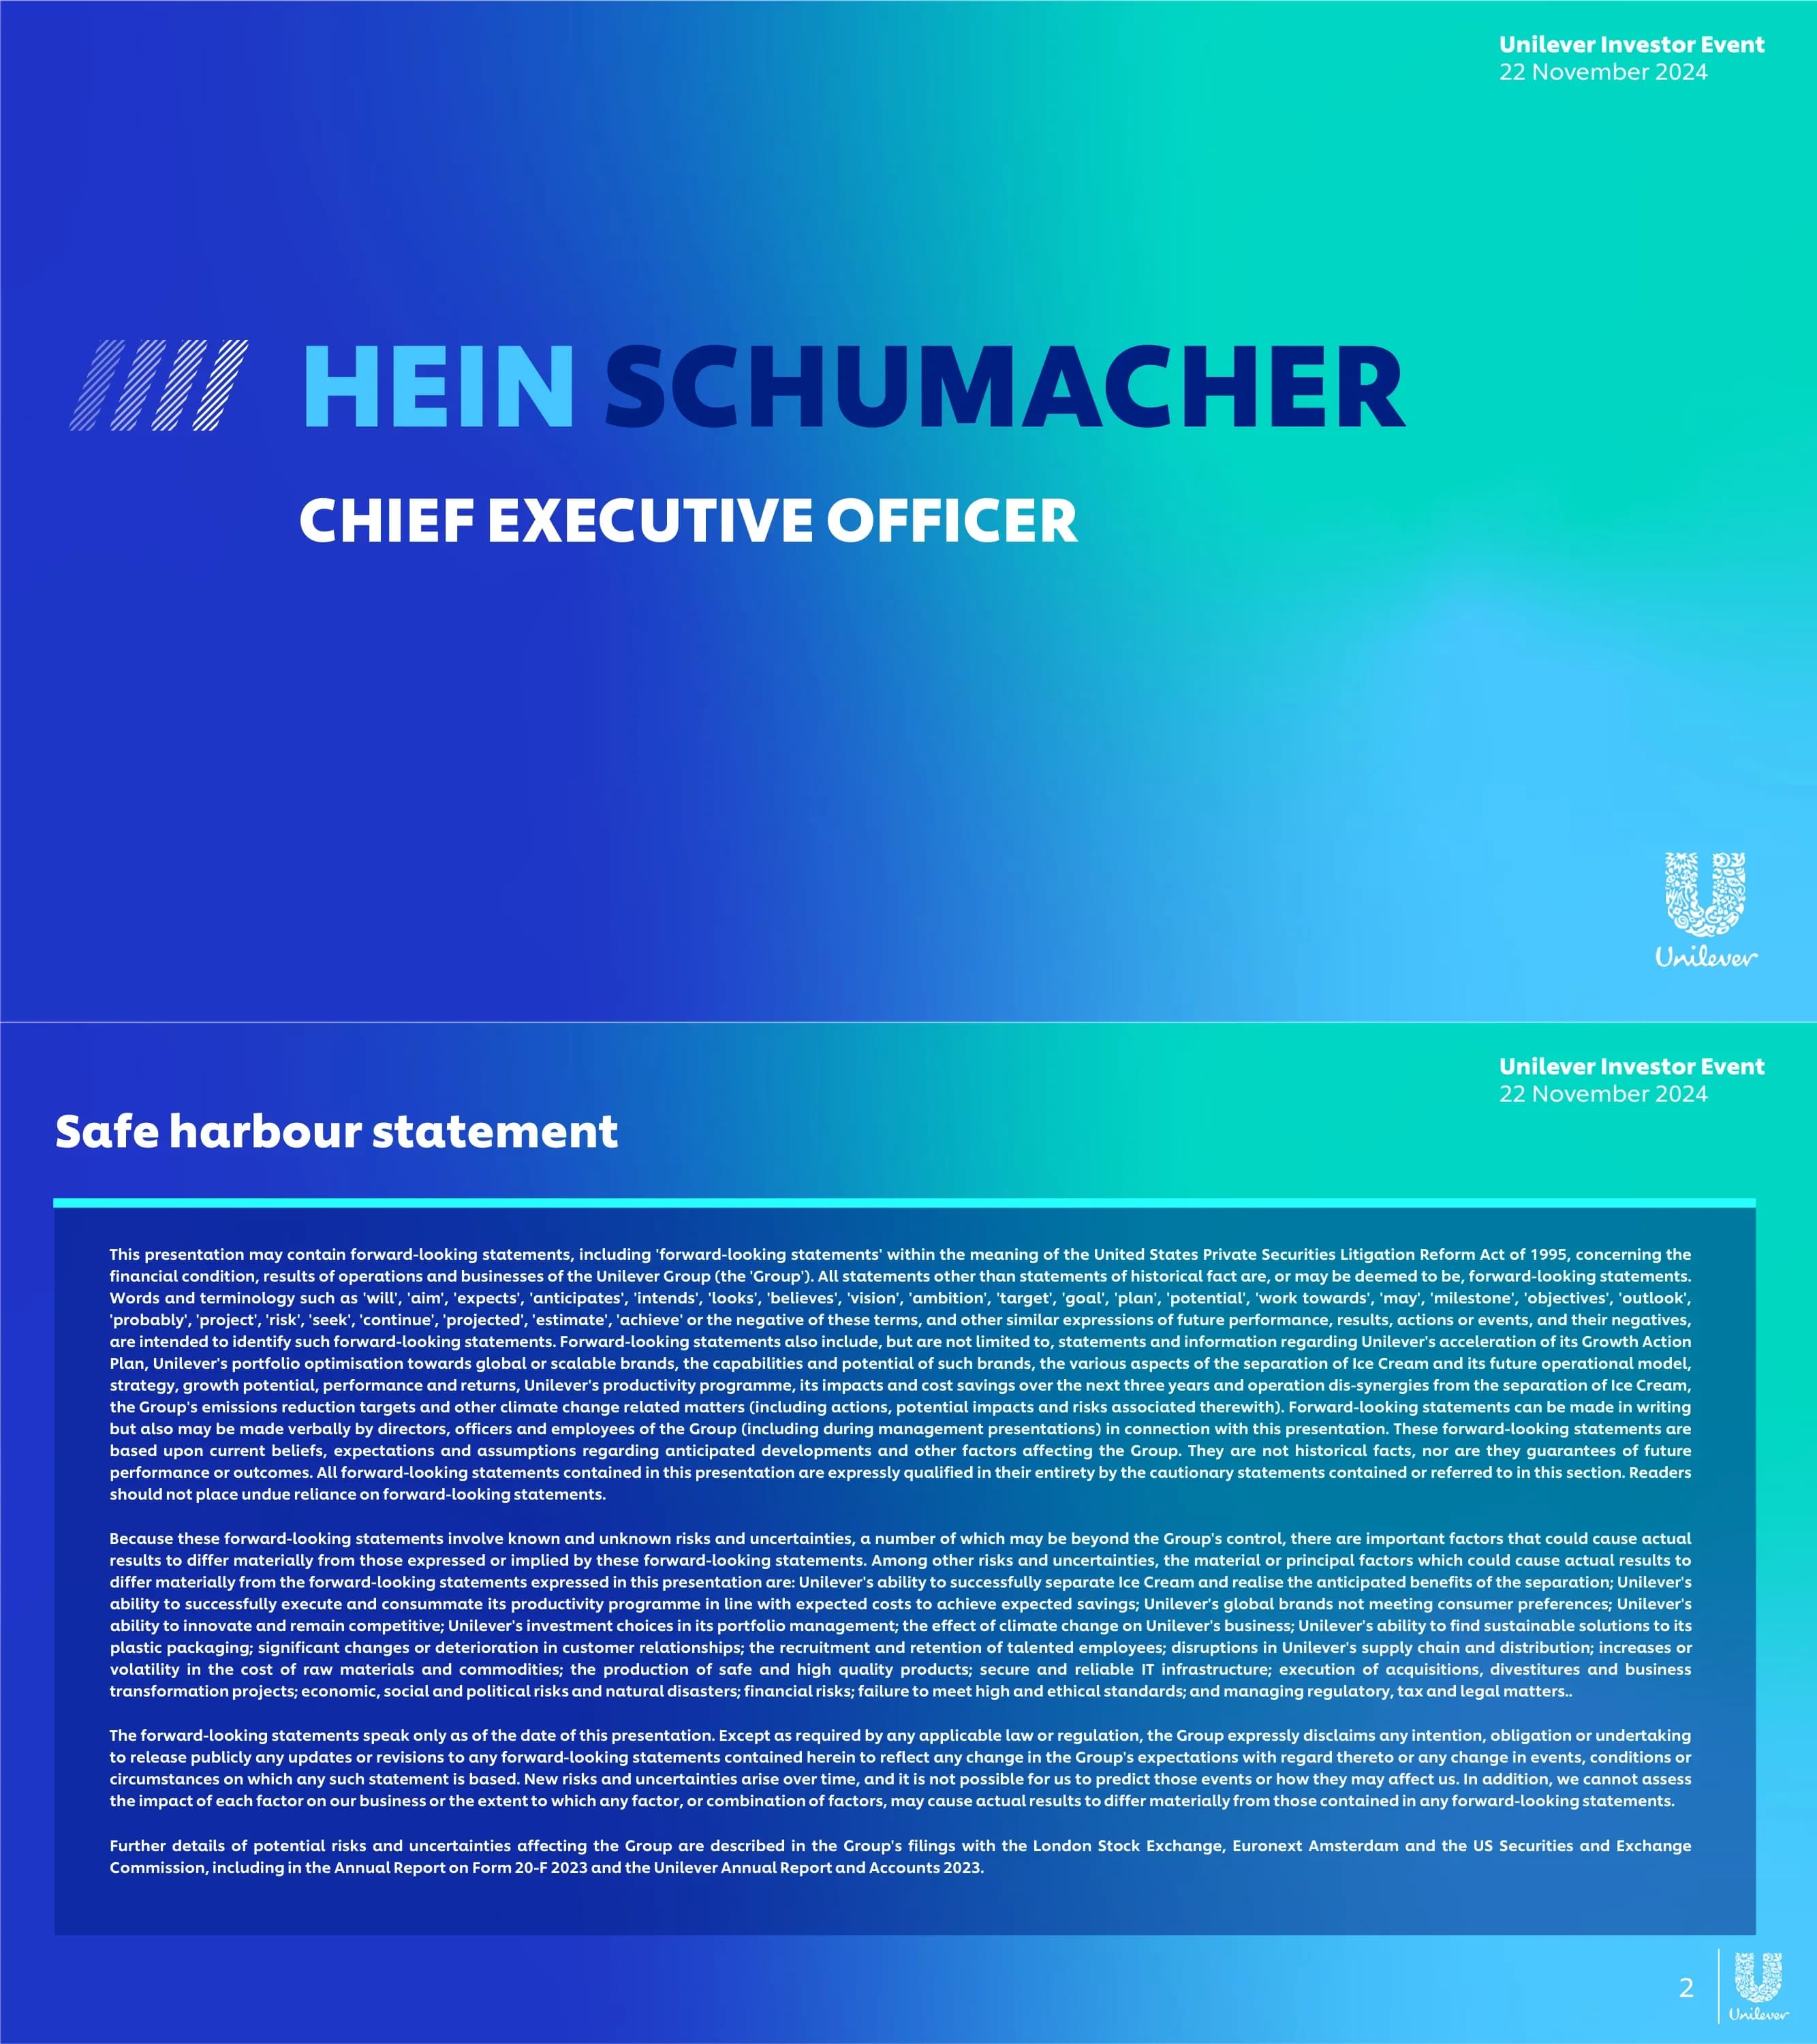
Title slide introducing CEO Hein Schumacher at the Unilever Investor Event, 22 November 2024
Full gradient background with large name and title text
Legal disclaimer covering forward-looking statements and risk factors
Dense text on gradient background
Five-section agenda: Growth Action Plan 1 year progress, GAP 2030, Accelerating transformation, Value creation, Q&A
Five horizontal pill-shaped buttons with arrow icons
Timeline of key milestones: K18 acquisition, Ice Cream separation, disposals (Dollar Shave Club, Elida), 800m productivity programme, 1.5bn buyback, Russia sale, European Works Council consultation
Horizontal timeline with milestone cards
>60% ULE in new roles, >40% SVPs, >20% Directors/VPs. 25% external appointments, 9 nationalities in ULE, 5 non-exec director changes
Split layout with bar chart left, metrics right
Three focus areas: 1) Step up volume growth, 2) Rebuild Gross Margins, 3) Consistent delivery for improved competitiveness
Three numbered items in cyan highlight box
Four quadrants: Volume growth (4 consecutive positive quarters up to 3.6%), Gross Margin expansion (+420bps H1 2024), BMI reinvestment (15.1%), Strong EPS growth (16% vs 7% peer avg)
2x2 grid with charts in each quadrant
9M 2024: Unilever 4.3% growth, Power Brands 5.6%. Shows all 30 Power Brand logos
Split layout with stacked bars left, brand logo grid right
12 big bold innovations in 2024, 2x average project size, 100m+ average year 3 incremental turnover. Examples: Liquid IV, Comfort Botanical Duo, Magnum Euphoria
Split layout with metrics left, innovation examples right
MAT value share improving from -74bps trough, H2 sequentially improving, aim to return positive in FY 2025
Split layout with trend chart left, three insights right
Brand superiority at 71-73% vs 80% target. Premium portfolio: over-indexed at mainstream (117) but under-indexed at premium (91)
Two-panel comparison layout
Four priorities: 1) Fewer things done better, 2) Scaling strengths, 3) Stepping up underperformance, 4) Shaping a winning culture
Four numbered items in cyan highlight box
Five trend pillars: Macro-economic dynamics, Consumers living differently, Changing retail landscape, Digital & technology first, Sustainability
Five-column matrix with trend items
Transition from Growth Action Plan to Growth Action Plan 2030
Arrow flow diagram from old to new strategy
Purpose: Brighten everyday life for all. Strategy: Focus, Excel, Accelerate. Plus Sustainability and Winning Culture layers
Strategic framework diagram with three horizontal layers
Consumer-centric purpose placing consumers at the heart of everything Unilever does
Split layout with text left, large circular graphic right
Growth Action Plan 2030 framework with Focus pillar highlighted
Strategic framework with Focus emphasized
Focus means concentrating on 4 Business Groups, 30 Power Brands, and 24 Top Markets
Large bold statement slide with three key numbers
Beauty & Wellbeing (25%), Home Care (24%), Personal Care (26%), Foods (25%). Ice Cream separation by end 2025
Donut chart center with four group descriptions
30 Power Brands drive >75% of turnover and profit growth. Shows additions (Olly, K18, Hourglass, Nexxus) and Ice Cream removals
Split layout with criteria left, brand wheel center, additions right
Top 24 markets = 85% turnover with end-to-end category expertise. 1UL markets = 15% for 100+ smaller markets
Split layout with donut chart left, market regions right
Strategic approach: Deliver BG strategies, end-to-end category focus, dedicated customer teams, resources prioritised in-market
Split layout with donut chart left, four strategic points right
1UL Markets: Ruthless portfolio prioritisation, in-market demand creation, competitive cost base & streamlined operations
Split layout with donut chart left, three points right
Five key opportunities: Double-down India, Accelerate Prestige & Wellbeing, Premiumise the US, Grow emerging markets, Shift to premium in Europe
Five horizontal items with country flag icons
Section header for India focus area
Statement slide with Indian flag icon
9 in 10 households use Unilever brands, >85% portfolio in leadership, 80% UBS. Turnover 8% CAGR, GM +245bps, EBITDA +710bps, market share +200bps
Three-column: Consistent, Profitable, Resilient
USG growth improving (0.7% to 2.3%), +120bps YTD gross margin, winning share in last 3 months
Three-column: Growth, Margin, Competitive Momentum
India households by income: 2005 (219M), 2018 (293M), 2030e (386M). FMCG growth shifting from penetration to consumption increase
Three time-period comparison with income pyramid
Three pillars: Unmissably Superior Brands, Premiumising Portfolio (Surf Excel, Dove, Ponds, Vim, Horlicks), Digitising Value Chain (AI-powered)
Three-column strategy with brand logos
Fabric Cleaning example: India GDP/capita at inflection point, 85% GDP increase expected, >2bn+ 10Y turnover upside in UL India Fabric Cleaning
Scatter chart left, metrics right
Section header for Prestige & Wellbeing focus area
Statement slide with multi-country flags
US first priority, selective international expansion (2x turnover outside US by 2030), selective bolt-on acquisitions. Brands: Liquid IV, Olly, Nutrafol, Hourglass, K18, Paula's Choice, Dermalogica
Split layout with strategy left, brand logos right
Growth Action Plan 2030 framework with Excel pillar highlighted
Strategic framework with Excel emphasized
Five pillars: Unmissable Brand Superiority, Multi-year Scalable Innovations, Premiumisation, Social First Demand Generation, Growth Channels
Five-column card layout with descriptions
Five pillars with Unmissable Brand Superiority emphasized
Five-column layout with first pillar highlighted
UBS evaluates 6Ps: Proposition, Packaging, Product, Promotion, Place, Pricing. 21 input metrics, proprietary data, bespoke weighting by brand/country
Split layout with 6Ps diagram left, capabilities right
UBS trajectory: Proposition and Packaging need improvement (red), Product/Promotion/Place/Pricing trending up. Two imperatives identified
Split layout with 6Ps scorecard left, improvements right
Before/after case study using 21 metrics across 6Ps. Actions: squeezy pack format, superior flavour, NBA collaboration
Before-after comparison with metrics and product photos
Five pillars with Multi-year Scalable Innovations emphasized
Five-column layout with second pillar highlighted
Bigger and Bolder (2x innovation sales), Unmissable Superiority (3 science platforms), Accelerated Pipelines (increased R&D investment)
Three horizontal pill/card layout
Innovation examples: B&W (Dove hair treatments, Fibreshield), Personal Care (whole body deodorant), Home Care (short cycle wash, Pro-S), Foods (flavoured mayo, Obelix)
2x2 grid of innovation examples
Five pillars with Premiumisation emphasized
Five-column layout with third pillar highlighted
1) Elevating core (premium in developed, market development in emerging), 2) Scaling Prestige & Wellbeing (accelerate US + internationalise), 3) Rotating portfolio (acquisitions: K18, Liquid IV, Hourglass; divestments: Elida, Suave, DSC)
Complex layout with three thrusts and product examples
Five pillars with Social First Demand Generation emphasized
Five-column layout with fourth pillar highlighted
Evolution: Traditional (1:1) to Modern (1:Many) to Social-First (Many:Many) - embedding brands in culture at scale
Three-stage evolution diagram
Six shifts: Content Factory (20x social, 90% utilisation), Media (50%+ social), Insights (integrated real-time), Dynamic Plans, AI-enhanced creation, Expert marketers
Split layout with TikTok screenshots left, from/to table right
Five pillars with Growth Channels emphasized
Five-column layout with fifth pillar highlighted
Four channels: Modern trade (AI perfect store), Traditional trade (digitalisation), dComm (tailored solutions), Health & beauty (specialist channels)
Four-column card layout
Recap of all five Excel pillars equally weighted
Five-column layout all highlighted
Growth Action Plan 2030 framework with Accelerate pillar highlighted
Framework with Accelerate emphasized
Science & Technology, Lean Agile Supply Chain, Net Productivity, Scaled AI
Four-column card layout
Four capabilities with Science & Technology emphasized
Four-column layout with first highlighted
Three platforms: Microbiome (probiotics, biome-enhancing), Biotechnology (Rhamnotech, plant-based), Next Gen Materials (GlutaGlow, Pro-S, Pro-ceramides). Underpinned by digital, AI and partnerships
Three-column with examples and product photos
Digital R&D (AI-powered), Fragrance (100m new creation house), Packaging (premium + sustainability), Partnerships (cutting-edge science)
Four-column card layout with photos
Four capabilities with Lean Agile Supply Chain and Net Productivity emphasized
Four-column with columns 2-3 highlighted
Procurement: ~1% material cost savings p.a. vs inflation. Production & logistics: -2% cost per unit reduction p.a.
Two-column metric display
Supply chain capex: from 30% (2019-2022) to 55%+ (2025+). Key network transformations in North America and Europe
Split layout with bar chart left, globe flags right
Four capabilities with Scaled AI emphasized
Four-column with fourth highlighted
6 big tech/AI investments (customer centric, unmissable marketing, digital R&D, autonomous factories, AI procurement, optimised fulfillment) + 3 foundations (integrated data, ERP, cyber security)
Two-section layout: investments + foundations
Complete Growth Action Plan 2030 showing all layers equally
Full strategic framework diagram
Full framework with details: Focus (30 Power Brands, 24 Markets), Excel (5 sub-pillars), Accelerate (4 capabilities), Sustainability (4 pillars), Culture (Values, People, Behaviours)
Comprehensive framework with all sub-items
Growth Action Plan 2030 with Sustainability layer highlighted
Framework with sustainability emphasized
Evolution: 2010 (Sustainable Living Plan), 2020 (Embedding across value chains), 2024 (GAP 2030 - greater focus, higher impact)
Three-era timeline with logos
Climate (100% Scope 1&2 reduction), Nature (1M hectares regen ag), Plastics (40% virgin reduction, 100% recyclable), Livelihoods (50% living wage). Supported by 1bn Climate & Nature Fund
Four-column layout with targets
1) Drive delivery against goals, 2) Advocate for policy change (WEF, COP28, COP16), 3) Capitalise with retailers (Walmart, Amazon, Tesco)
Three-column with icons/logos
Framework with Culture layer highlighted
Framework with culture emphasized
Values (Pioneering, Respect, Integrity, Responsibility), People (Best talent, Inclusive, Diverse, Engaged), Behaviours (Care deeply, Focus on what counts, Stay ahead, Deliver with excellence)
Three-column card layout
Four behaviours: Care Deeply, Focus on What Counts, Stay Three Steps Ahead, Deliver with Excellence. Four shifts: Upgrade goals, Higher standards, Performance development, Transparency vs competition
Split layout with behaviours left, shifts right
Implemented: Remuneration aligned with shareholders, line of sight for employees, streamlined goal setting. Underway: Simplified incentives, talent cultivation, employee engagement in growth
Two-column implemented vs underway
Common questions about this slide and the underlying presentation content.
The Growth Action Plan (GAP) 2030 is Unilever's comprehensive corporate strategy presented by CEO Hein Schumacher at the November 2024 Investor Event. Built around the purpose of 'Brighten everyday life for all,' it has three strategic pillars: Focus (30 Power Brands, 4 Business Groups, 24 Top Markets), Excel (5 areas including Unmissable Brand Superiority, Multi-year Innovations, Premiumisation, Social First Demand Generation, and Growth Channels), and Accelerate (Science & Technology, Lean Supply Chain, Net Productivity, and Scaled AI). It also includes Sustainability commitments and a Winning Culture framework.
In the first year, Unilever achieved four consecutive quarters of positive volume growth (up to 3.6%), Gross Margin expansion of +420bps in H1 2024, BMI reinvestment at 15.1%, and underlying EPS growth of 16% (vs 7% peer average). Key actions included acquiring K18, announcing Ice Cream separation, completing a 1.5bn buyback, divesting Dollar Shave Club and Elida Beauty, selling Russia operations, and launching an 800m productivity programme.
Unilever's 30 Power Brands span four business groups and include Dove, AXE, Rexona, LUX, Vaseline, Paula's Choice, Dermalogica, K18, Nutrafol, Liquid IV, Sunsilk, Clear, TRESemme, Ponds, Close Up, Pepsodent, Lifebuoy, Knorr, Hellmann's, Horlicks, Magnum, Cornetto, Ben & Jerry's, Surf, Comfort, Domestos, Cif, Dirt is Good, Radiant, and Sunlight. Post-Ice Cream separation, new brands like Olly, K18, Hourglass, and Nexxus will be added while ice cream brands are removed.
Unilever plans to 'double-down' in India, one of its five key geographic priorities. Hindustan Unilever reaches 9 in 10 Indian households, holds 85%+ leadership positions, and delivered 8% turnover CAGR and +710bps EBITDA margin expansion over the past decade. The strategy focuses on three pillars: building unmissably superior brands, premiumising the portfolio through science-led innovation, and digitising the value chain with AI-powered operations.
Unilever is scaling AI through six big tech investments: customer-centric demand creation, unmissable marketing, digital R&D, autonomous factories, AI-enabled procurement, and optimised fulfillment. Three foundational priorities support this: integrated data, ERP & tech ecosystem, and cyber security resilience. The company is also shifting to social-first marketing with AI-enhanced content creation, targeting 20x social content and 50%+ social media spend.
The presentation features a distinctive blue-to-teal gradient throughout, with bold white and cyan typography. It uses a branded visual system including striped arrow icons, numbered circles, and the GAP 2030 logo. The design is vibrant with deep blue, cyan, magenta/pink accents, and white. It uses frameworks, donut charts, and card layouts to present strategic concepts clearly.
Unilever has 15 sustainability targets across four pillars, supported by a 1 billion euro Climate & Nature Fund: Climate (100% Scope 1&2 reduction, 42% Scope 3 reduction), Nature (1M hectares regenerative agriculture, zero deforestation), Plastics (40% virgin reduction by 2028, 100% reusable/recyclable packaging), and Livelihoods (50% suppliers signed Living Wage Act, 250K small farmers). The delivery strategy focuses on direct goal delivery, policy advocacy, and retailer partnerships.
Unilever is premiumising through three thrusts: 1) Elevating the core through innovation and branding in developed markets while driving progression from powders to liquids to capsules in emerging markets; 2) Scaling Prestige & Wellbeing brands (Liquid IV, Olly, Nutrafol, Hourglass, K18, Paula's Choice, Dermalogica) with US as first priority and 2x international turnover by 2030; 3) Rotating portfolio towards premium through acquisitions and divestments of underperforming brands.

Create Your Own Slides
Turn your ideas into professional presentations in seconds with 2slides AI.
Reference professional designs, choose your style, and generate slides with perfect text rendering. Powered by Nano Banana—start creating your presentation now.
Your AI Agent for slides. Save time, shine faster with intelligent presentation creation.




© 2026 2slides. All rights reserved.