
Part of Investor presentation examples · Japanese investor presentation examples
Tokyu H1 FY2026 Earnings Presentation: a Japanese-language earnings briefing deck (決算説明会資料) from Tokyu Corporation (TSE: 9005) covering H1 of the fiscal year ending March 2027 (April-September 2026), whose original was published on TDnet (Tokyo Stock Exchange timely disclosure) on November 11, 2026. FY2026 = fiscal year ending March 2027; H1 = April-September 2026.
Uses this deck’s cover as a style reference for slides made from your own content. Or pick any page below to use its layout as the reference.
Quick Navigation
Tags
Share the slides
Tokyu H1 FY2026 Earnings Presentation: a Japanese-language earnings briefing deck (決算説明会資料) from Tokyu Corporation (TSE: 9005) covering H1 of the fiscal year ending March 2027 (April-September 2026), whose original was published on TDnet (Tokyo Stock Exchange timely disclosure) on November 11, 2026. FY2026 = fiscal year ending March 2027; H1 = April-September 2026.
Detailed view of each slide page, including layout, key content and visual elements.
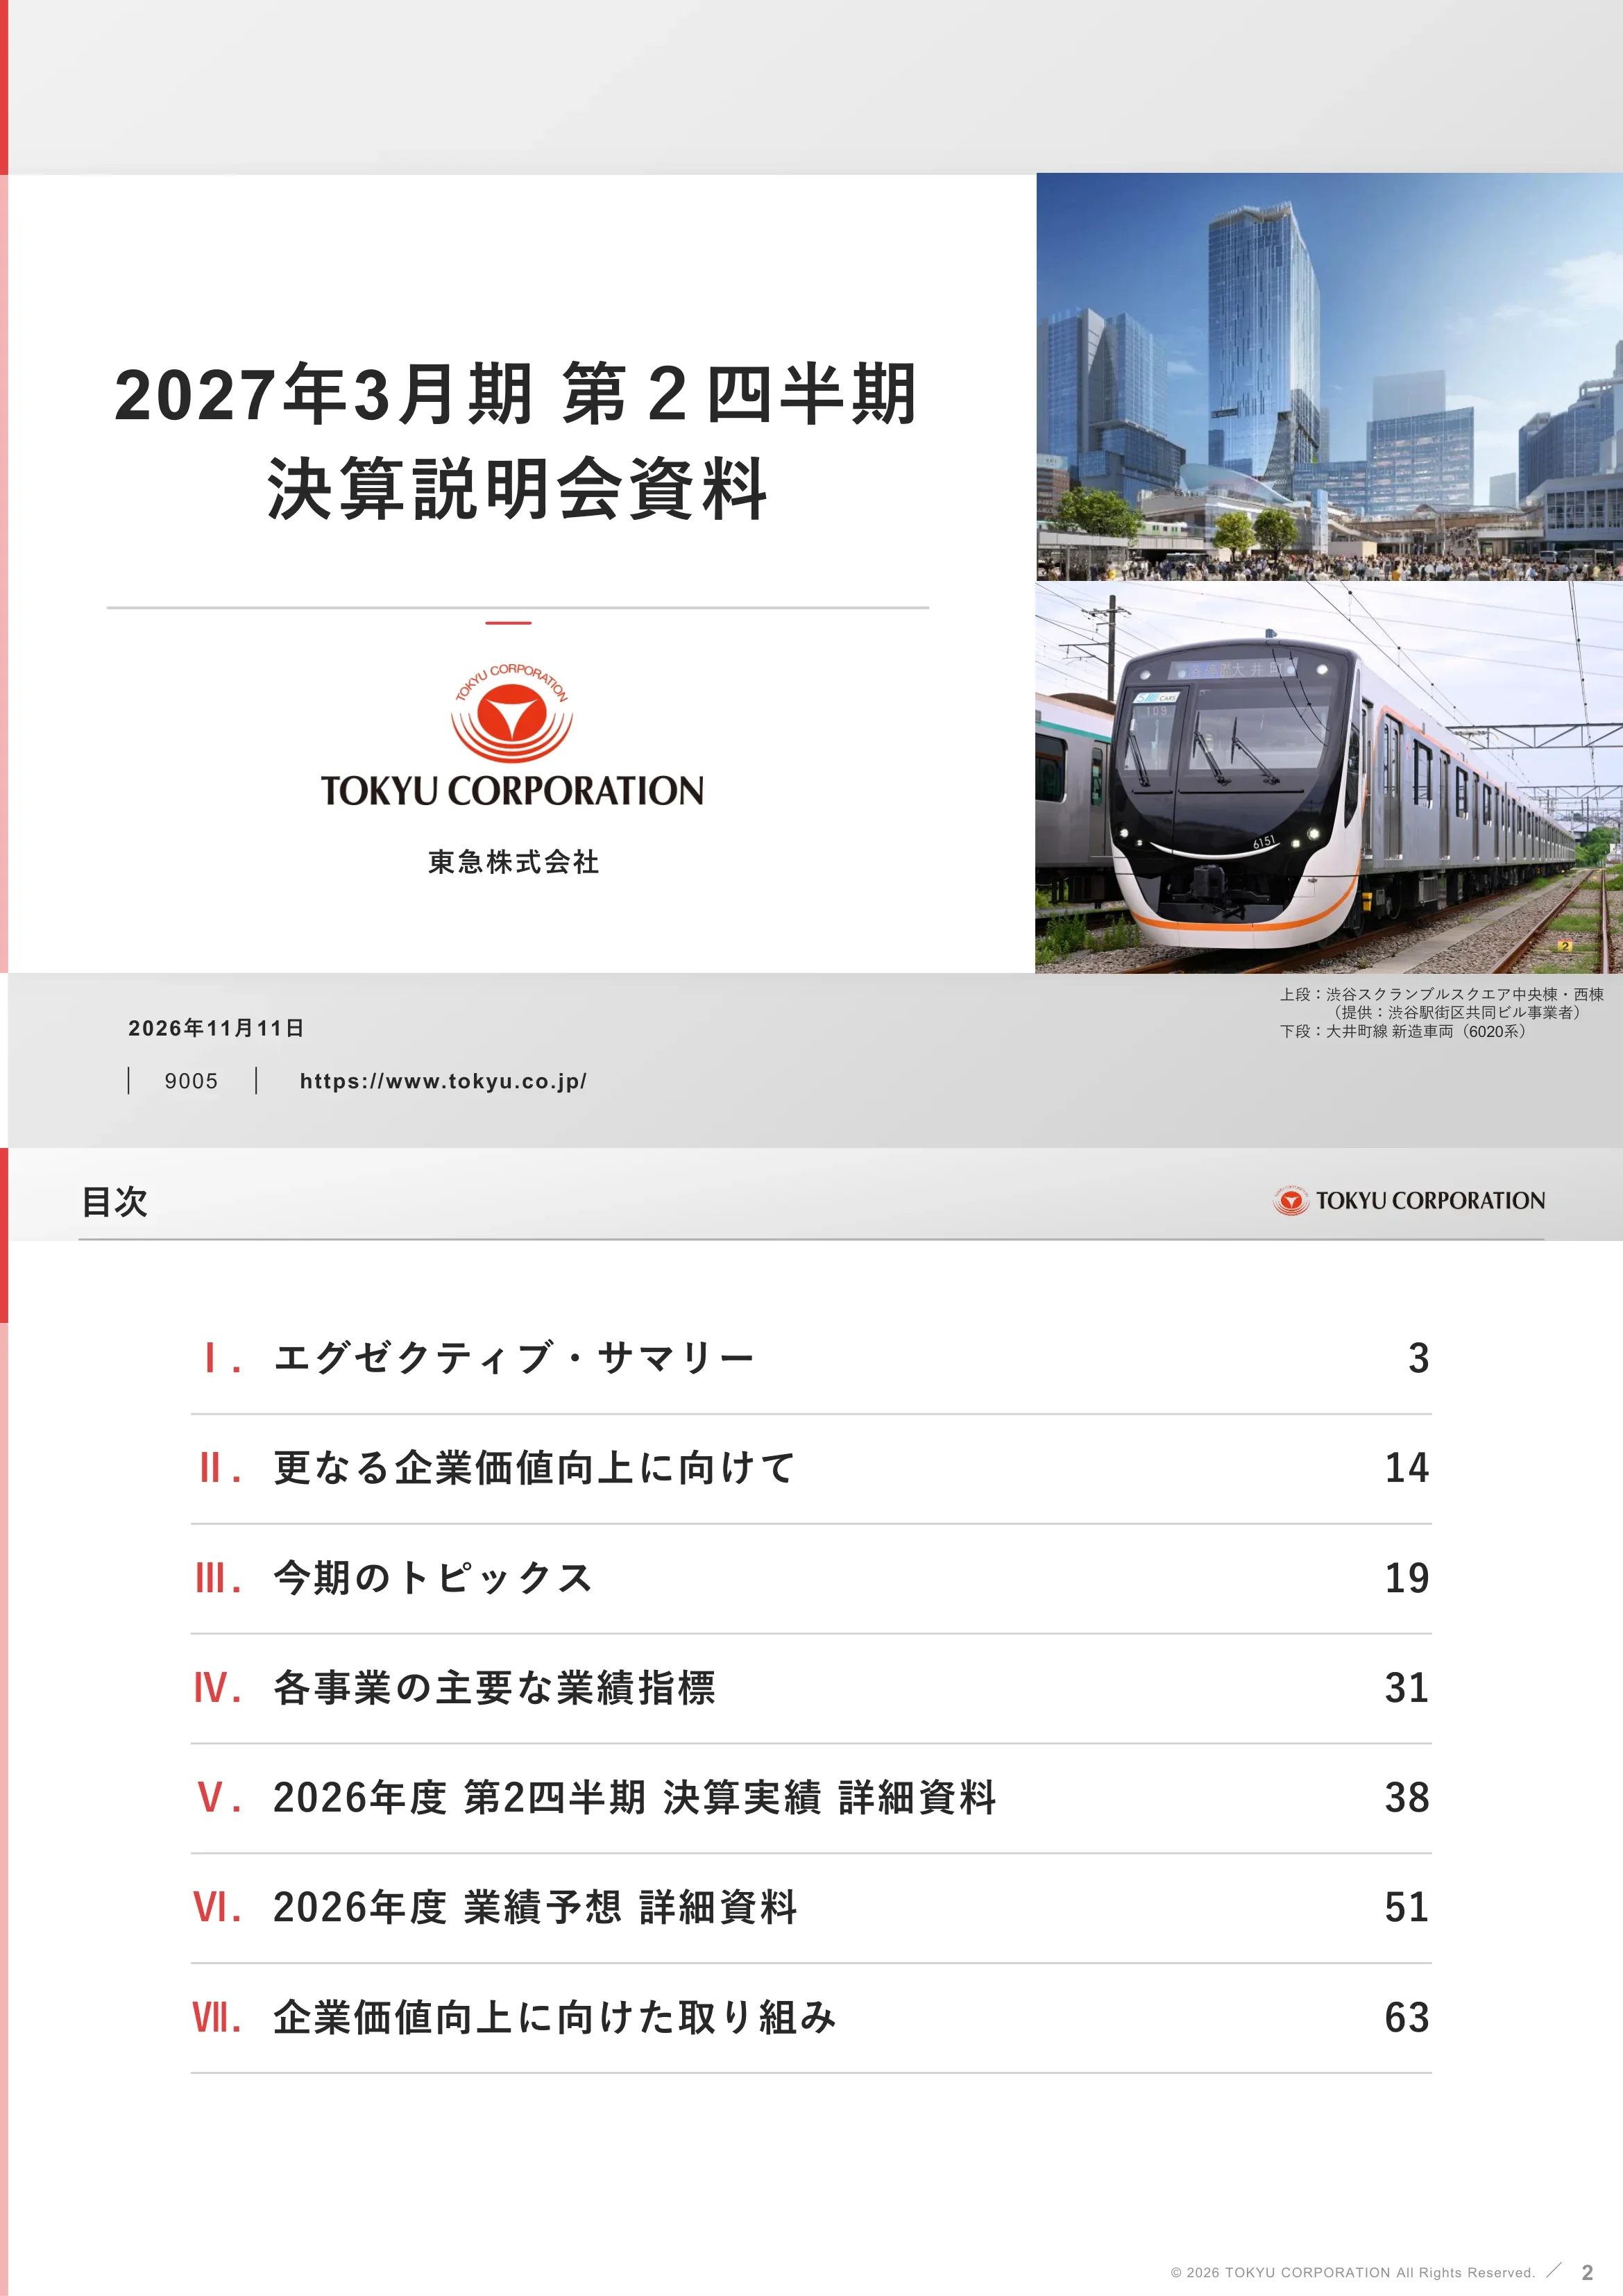
Title slide of Tokyu Corporation (TSE code 9005), dated November 11, 2026, covering the second quarter (H1) of the fiscal year ending March 2027. Includes the IR website URL.
Title text on the left with two photographs (Shibuya Scramble Square central and west towers; new Oimachi Line 6020 series train) on the right.
Agenda with seven parts: I Executive Summary (p.3), II Toward Further Corporate Value Enhancement (p.14), III Topics of the Period (p.19), IV Key Business Indicators (p.31), V H1 FY2026 Results Detail (p.38), VI FY2026 Forecast Detail (p.51), VII Initiatives for Corporate Value Enhancement (p.63).
Numbered Roman-numeral list with dotted leader page numbers.
Section divider introducing the executive summary (pages 3-13).
Large centered section title on plain background.
Operating revenue ¥540.1 billion (5,401 in ¥100 million units, 億円), +4.1% YoY; operating profit ¥54.2 billion, down 7.8%; real estate sales operating profit up 57.0% to ¥8.5 billion; profit attributable to owners of parent ¥58.4 billion, +4.0%; EPS ¥103.63; Tokyu EBITDA ¥110.4 billion. Compares actuals to prior year and to the May forecast.
Left commentary bullets (vs prior year, vs May forecast) with a dense comparison table on the right (FY2025 H1, FY2026 H1, change, forecast, difference).
Operating profit bridge from ¥58.8 billion (H1 FY2025) to ¥54.2 billion (H1 FY2026): real estate sales +31 and rental -32 (¥100 million), ICT/media -18 (Tokyu Power Supply -19), retail -9, hotels -16, transport about flat.
Waterfall chart across the top with segment annotation callouts underneath.
Bridge from the May forecast of ¥60.2 billion to the actual ¥54.2 billion: real estate rental -37, ICT/media -7 (Tokyu Power Supply -13), retail -12 (Tokyu Store -10), hotels +2, transport +4.
Waterfall chart with segment notes listed below the bars.
Six-year H1 trend (FY2021-FY2026): operating revenue rose from 4,430 to 5,401 and operating profit went 249, 218, 455, 653, 588, 542 (¥100 million). Commentary: large real estate sale offset by higher rental costs and power procurement costs.
Combined bar-and-line chart with a commentary bullet at the top.
Four mini charts for transport, life services, real estate, and hotels/resorts. Transport profit up on ridership (passengers +2.5%, fare revenue +2.4%); life services down on Tokyu Store customer decline and power costs; real estate revenue up with profit about flat; hotel occupancy 79.6%, +0.1pt.
Four-quadrant layout, each with a headline note and a small bar chart over six H1 periods.
Outlook assumptions by business: ridership 1,145 million (+2.5%), fare revenue ¥157.3 billion (+2.9%); more condominium handovers (259 units); hotel occupancy 79.5% (-0.1pt) and ADR ¥28,106 (+¥1,425); Tokyu Department Store sales +0.4% and Tokyu Store +4.3%; office vacancy 2.21% as of September 2026 (some detail small).
Table-like grid of business rows with assumption bullets and company logos/labels at left.
November forecast: operating revenue ¥1,135.0 billion (+4.5% YoY, -0.4% vs May); operating profit ¥100.0 billion (-3.1% YoY, -9.1% vs May); real estate sales profit ¥16.5 billion; business profit ¥101.5 billion; ordinary profit ¥102.4 billion (-11.8% YoY).
Single comparison table with YoY and vs-May-forecast columns plus footnotes.
Management indicators: EPS ¥160.56, ROE 9.5%, ROA 3.4%, Tokyu EBITDA ¥227.9 billion, EBITDA ¥194.1 billion, EBITDA yield on total assets 6.5%, interest-bearing debt/Tokyu EBITDA 6.5x, net debt/EBITDA 7.3x.
KPI table with columns for forecast, YoY and vs May forecast; footnote definitions at bottom.
Full-year operating profit bridge from ¥103.1 billion (FY2025) to ¥100.0 billion forecast: transport +22, real estate sales +22, real estate rental -41, ICT/media -35 (Tokyu Power Supply -27), retail -12, hotels +14.
Waterfall chart with detailed callouts for each segment.
Bridge from ¥110.0 billion (May forecast) to ¥100.0 billion (November): real estate rental -64, retail -24 (Tokyu Store -14), ICT/media -29 (Tokyu Power Supply -29), real estate sales +21, transport +1, hotels +2.
Waterfall chart with callouts, same style as the previous page.
Section divider for pages 14-18 on share price, NAV and growth strategy.
Large centered section title.
Management views the share price as extremely undervalued. Charts show PER/PBR (May 2024 to October 2026) falling while EPS rises (105.84, 134.81, 152.25, 160.56, 164.88 yen for FY2023-FY2027E) and ROE of 8.3-10.0%. Analyses causes (growth expectations, cost of equity, MSCI ACWIC exclusion) and countermeasures.
Two charts on top (PER/PBR lines; EPS bars with ROE line), cause analysis table and response bullets below.
NAV per share is about ¥2,749 and P/NAV about 0.6x, so the stock looks deeply discounted to asset value. Unrealized gains on rental real estate grew to about ¥855.6 billion (FY2025) on a book value of about ¥587.7 billion; BPS ¥1,700.81.
Left stacked bars of book value vs unrealized gain, right bars comparing share price, BPS and NAV per share, plus BPS trend table.
Plan: grow rental income and optimize the asset portfolio including sales to improve capital efficiency and ROA. Unrealized gains are concentrated in Shibuya (65%) and along the lines (26%), and station-connected assets (75%); these are hard to sell but offer rent upside.
Left text on portfolio characteristics, middle pie charts of gain composition by area and location, right strategy steps.
Operating profit is about 80% from the Tokyu lines area (Shibuya 20%, other lines 60%) and 20% elsewhere. Growth levers: population attraction and wallet share along the lines, Shibuya development, and overseas expansion.
Pie chart at left and three area-based strategy panels at right.
Section divider for pages 19-30.
Large centered section title.
Portfolio management and asset sales: planned asset sales of ¥70.0 billion over three years now expected to reach about ¥100.0 billion. Exits and restructuring include meat processing at Central Foods, hotel network and membership resort business. Three properties contributed to Tokyu REIT in April and October 2026; sold-property examples shown.
Two-column layout of initiatives, a small bar chart of investment property sales, and property photos/lists.
H1 passenger numbers on the Tokyu Shin-Yokohama Line were up 9.6% YoY. Railway operating profit is expected to rise from 228 to 251 (¥100 million) in FY2026 with cost control; GREEN x EXPO 2027 (March 2027) is flagged as a demand opportunity.
Bar chart at left, outlook text blocks at right with three numbered themes.
Strategy: shorter lease terms, CPI-linked clauses (introduced for some tenants), and contract-method reviews. Top Shibuya rent is above 90% of the market benchmark; commercial and hotel rents rose (commercial 43,173 million yen with 10.0% variable; hotels 9,019 million yen with 28.7% variable) (some chart labels small).
Mixed layout: three strategy boxes, rent charts, tenant renewal results tables.
Sales revenue by category (domestic housing, domestic income-producing property, overseas, other) for FY2023-FY2026 H1, totalling 1,218, 1,511, 2,155 and 2,801 (¥100 million); explains competitive advantage by business and the portfolio composition of investor-held properties (office 58%).
Stacked bar chart at left, three text columns and a pie chart at right.
Lists major handover properties: Viegstage Saginuma (103 units, July 2026), Dresse Chidoricho (32 units, Jan 2027), Dresse Minami-Machida Residence (78, Feb 2027), Dresse Saginuma Raison Vert (40) and Dresse Minami-Machida Front (78) (March 2027). A pipeline timeline shows about 1,800 units secured.
Property table at left, pipeline timeline by fiscal year at right, with a project photo.
Overseas assets are about ¥163.0 billion at H1 FY2026, around 5% of total assets: Vietnam about ¥100.0 billion, Thailand about ¥17.0 billion, Australia about ¥45.0 billion. Business profit target of about ¥15.0 billion by FY2035 (some chart values small).
Bar chart of overseas profit plans, country asset breakdown, and Vietnam/Australia project panels.
Shows Tokyu-involved floor area in the Shibuya area growing from about 650,000 sqm to about 860,000 sqm, with a map of projects including Shibuya Scramble Square Phase II (central and west towers, under development), Shibuya Upper West Project and Miyamasuzaka redevelopment.
Area map with labeled buildings and a stacked bar chart of floor area.
Plan to operate Shibuya commercial facilities as one integrated mall, evolve existing facilities, collaborate with IP content, and open the new Shibuya Upper West Project retail.
Concept diagram of the Shibuya mall with text panels and facility photos.
Combines hardware (development) and software (entertainment, information) to raise working, resident and visitor populations; highlights a new brand called Tokyu Entemate and a Shibuya Snack Alley opening beside Shibuya Hikarie in early December.
Text bullets with photo callouts of events and venues.
Tokyu Store comparable sales -0.6% with average basket +2.0% and customers -2.5%; Tokyu Power Supply factors; hotel network changes (Naha Tokyu REI closure, new Fukui, Kojimachi and Kaga properties) and foreign guest ADR rising to ¥34,992 versus ¥28,106 overall forecast.
Two-column layout (life services left, hotel/resort right) with small tables.
Tokyu was selected for major ESG indices (FTSE, MSCI) for the third straight year; green bonds (24th and 25th unsecured bonds) totaling ¥45.0 billion were issued; GREEN x EXPO 2027 efforts and links to detail pages are shown.
Three text-and-image panels with URLs.
Section divider for pages 31-37.
Large centered section title.
Tokyu Railways passengers and fare revenue are shown with monthly YoY trends (October 2024-2025 shown on the chart); Q2 (July-September) ridership exceeded the prior year and October gate passages were about +4%.
Line chart of monthly YoY change for commuter and non-commuter passes plus commentary box.
Two monthly bar charts of Tokyu Railways passenger numbers and fare revenue (actuals, roughly 11,600-13,400 thousand passengers per month on the passenger chart).
Two side-by-side bar charts.
Handovers: 44 units in H1 FY2026 vs 46 (condominiums 40, houses/land 4). Office vacancy and rents remain low in the five central Tokyo wards thanks to station-connected holdings; H1 handovers are in line with the forecast.
Handover table at left, vacancy and rent line chart at right.
Tokyu Department Store gross sales including tenants exceeded prior year thanks to renovations; Tokyu Store total sales rose on new and renovated stores. Monthly YoY bars for both.
Two monthly bar-and-line charts with commentary.
H1 ADR exceeded the prior year on inbound demand; October occupancy about 83% and ADR about ¥31,200. Charts show ADR, RevPAR, occupancy and YoY sales by month.
Two chart groups with commentary at the right.
Shibuya duty-free sales and hotel foreign guest share are charted against inbound visitor arrivals (JNTO data); the company continues capturing inbound demand across Shibuya retail and hotels.
Three charts plus facility footnotes.
Section divider for pages 38-50.
Large centered section title.
Consolidated P&L table in ¥100 million units: FY2025 H1, FY2026 H1, May forecast, with YoY and vs-forecast changes (revenue +211, operating profit -45, ordinary profit -168). Table is dense.
One large statement table with variance columns.
Segment revenue and operating profit table with YoY and vs-forecast variances for transport, real estate, life services, hotels and eliminations.
Large segment table.
Breakdown of non-operating items: interest and dividends 15, equity-method income 71 (-84) including Tokyu Fudosan Holdings 52 (-25) and Tokyu REIT 6 (-60), plus extraordinary items with comments.
Table with a notes column.
Segment EBITDA table (e.g., Tokyu Railways 365, Tokyu Bus 20) with YoY and forecast variances; total changes +9 YoY.
Segment table with definition footnote.
Transport revenue and profit table plus Tokyu Railways operating expense breakdown: total costs 677 (+21), personnel 186, power 44, depreciation 175 (¥100 million).
Left segment table, right cost breakdown table.
Real estate segment table: sales profit, rental and management; sales revenue split into housing (44 units) and investor-oriented property (4 deals) with comments (small).
Dense table with comment column.
Retail businesses revenue and profit with variances for department store, Tokyu Store and others (small, dense table).
Table with variance columns.
ICT/media table including Tokyu Power Supply and Its Communications; Tokyu Power Supply profit down 18 (-24.1%) vs prior year (dense).
Table with variance columns.
Key metrics: hotel overall occupancy 79.6% (+0.1pt), ADR ¥27,530 (+¥1,298), RevPAR ¥21,903 (+¥1,046); breakdown for Shibuya hotels and The Capitol Hotel Tokyu (occupancy 74.7%).
Metric tables with segment financial table.
Total assets ¥2,962.7 billion (up from ¥2,922.8 billion at the prior year-end), equity ¥950.1 billion, equity ratio 32.1%, interest-bearing debt ¥1,456.6 billion, net debt ¥1,392.6 billion; D/E 1.5x; buybacks 200 and dividends 91 noted.
Balance sheet table with comments column.
H1 operating cash flow 51 (vs 486), investing -666, with capex and asset-sale inflow 71 listed (¥100 million); financing and free-cash-flow lines with comments.
Cash flow table with comments.
Segment capex table with YoY and forecast variances; note that figures are on an implementation basis, differing from the cash flow statement.
Segment table with footnote.
Section divider for pages 51-62.
Large centered section title.
FY2026 forecast P&L vs FY2025 and May forecast: revenue +488 (+4.5%), operating profit -31 (-3.1%), ordinary profit -137 (-11.8%) (¥100 million).
Large statement table.
Segment revenue and operating profit forecasts vs FY2025 and May forecast.
Segment table.
Forecast: interest and dividends 37, equity-method income 208 (-30), interest expense 181 (+60) with explanatory notes.
Table with notes.
Segment EBITDA forecasts: Tokyu Railways 690 (+35), real estate sales 194, rental 448 (-46); total -9 YoY.
Segment table with footnote.
Transport forecast revenue and profit variances with component breakdowns (small table).
Dense table.
Real estate forecast: housing 255 revenue with 259 units (+17), investor properties 298 with 11 deals (-3), and operating profit lines.
Table with comments.
Retail forecast revenue and profit by company vs prior year and May forecast.
Dense table.
ICT/media forecast including Tokyu Power Supply, down -35 on profit YoY (small).
Dense table.
Hotel forecast: occupancy, ADR and RevPAR tables plus segment financials.
Metric tables.
Full-year forecast: operating CF 920 (-357), investing -1,481, asset-sale inflows 433, (¥100 million).
Cash flow table with comments.
Capex forecast by segment with variances vs FY2025 and May forecast.
Segment table with footnote.
Section divider for pages 63-76.
Large centered section title.
Long-term circular business model: transport and real estate as core, with life services and hotels, linked to area growth, higher asset values and the conglomerate premium.
Cyclical flow diagram across the four segments.
Tokyu is a regional conglomerate; core businesses (transport, real estate) and value-added businesses (life services, hotels/resorts) are positioned on a risk-return map.
Quadrant-style chart with four labeled blocks.
Medium-to-long-term goal of 4% consolidated ROA (business profit / total assets), shown by segment; intragroup leasing is expected to increase.
Chart of ROA vs asset scale with segment notes.
Population per 1km radius and land prices rose around Tokyu stations (e.g., 39,517 to 45,544, +15.3% for 2011-2026; land prices index 214.0); passenger growth index since FY1999.
Line chart plus tables of population and land-price growth around stations.
Concept diagram of how a new property boosts existing property value and flows users to hotels, shops and other services.
Flow diagram with icons.
Developed real estate triggers linked demand across transport, life services and hotels, leading to area-wide sustainable growth.
Circular linkage diagram with example bullets.
Overview of services offered in Shibuya (retail, hotels, offices, entertainment, advertising) tied together by the customer base of Tokyu Card and apps.
Layered service-and-platform matrix.
Ranking of Shibuya's share of visitors/engagement relative to other areas (62.6% at top); working population 438,942 (2012) to 585,149 (2021).
Bar ranking and population charts.
Compares tenant leasing (stable fixed rent) with group-operated model (upside from business profit) and explains combining the two.
Two-column comparison diagram.
Rent from group-operated businesses totals ¥32.0 billion (25.4% of ¥126.3 billion rental revenue in FY2025): retail ¥19.1 billion (15.2%), hotels ¥9.6 billion (7.6%), ICT/media ¥3.2 billion (2.6%).
Breakdown graphic and tenant company table.
Matrix of business segments by area (along Tokyu lines vs outside) with FY2025 operating profit and average assets; image-based.
Segment-by-area matrix.
Table of corporate value components with approaches such as flexible share buybacks, maintaining financial soundness, portfolio management and cumulative investment along the lines, plus page references.
Three-column table of component, approach and page reference.
Describes sensitivity of each business to the economy (leading, coincident, lagging) and responses to inflation and rising rates: longer maturities and fixed-rate borrowing.
Sensitivity spectrum chart plus response text.
IR contact (Financial Strategy Office, Accounting Group) and IR site https://ir.tokyu.co.jp/ja/ir.html, with a forward-looking statements disclaimer.
Text-only closing slide.
Common questions about this slide and the underlying presentation content.
It is a 77-page deck with an executive summary, share-price and NAV analysis, period topics, key business indicators, detailed H1 results, full-year forecast detail and corporate value initiatives.
FY2026 means the fiscal year ending March 2027, and H1 is April-September 2026. The cover title reads 2027年3月期 第2四半期 決算説明会資料.
H1 operating revenue was ¥540.1 billion (+4.1%), operating profit ¥54.2 billion (-7.8%) and profit attributable to owners of parent ¥58.4 billion (+4.0%). The full-year operating profit forecast is ¥100.0 billion.
The deck is in Japanese (決算説明会資料). The original was published on TDnet, the Tokyo Stock Exchange timely disclosure system, and the company's IR site; this gallery page gives an English analysis of each slide.
Yes. Pages 38-62 contain statement summaries, segment tables, EBITDA, balance sheet, cash flow and capex for both H1 results and the full-year forecast.
Yes. The gallery offers the deck as downloadable PPTX and PDF files for reference.
The waterfall bridges, KPI tables and cross-business diagrams are good layout references. Replace the figures and text with your own, and check the original company's terms before reusing branded content.
The company IR site (https://ir.tokyu.co.jp/ja/ir.html) lists the earnings materials, and the same release appears on TDnet.
Official IR site named on the final slide of the deck.

Create Your Own Slides
Turn your ideas into professional presentations in seconds with 2slides AI.
Reference professional designs, choose your style, and generate slides with perfect text rendering. Powered by Nano Banana—start creating your presentation now.
Your AI Agent for slides. Save time, shine faster with intelligent presentation creation.


© 2026 2slides. All rights reserved.