
Part of Investor presentation examples
Texas Pacific Land Corporation (NYSE: TPL) Investor Presentation, November 2026, released with Q3 2026 results and filed with the SEC as Exhibit 99.2 to a Form 8-K. The 47-slide deck covers TPL's Permian Basin land, royalty and water business: Q3 2026 revenue of $273.4 million, Adjusted EBITDA of $238.4 million (87% margin) and free cash flow of $170.3 million, no debt and $369.6 million of cash, plus the four revenue streams (oil and gas royalties, SLEM, water sales, produced water royalties), the freeze-desalination program and full non-GAAP reconciliations.
Uses this deck’s cover as a style reference for slides made from your own content. Or pick any page below to use its layout as the reference.
Quick Navigation
Tags
Share the slides
Texas Pacific Land Corporation (NYSE: TPL) Investor Presentation, November 2026, released with Q3 2026 results and filed with the SEC as Exhibit 99.2 to a Form 8-K. The 47-slide deck covers TPL's Permian Basin land, royalty and water business: Q3 2026 revenue of $273.4 million, Adjusted EBITDA of $238.4 million (87% margin) and free cash flow of $170.3 million, no debt and $369.6 million of cash, plus the four revenue streams (oil and gas royalties, SLEM, water sales, produced water royalties), the freeze-desalination program and full non-GAAP reconciliations.
Detailed view of each slide page, including layout, key content and visual elements.
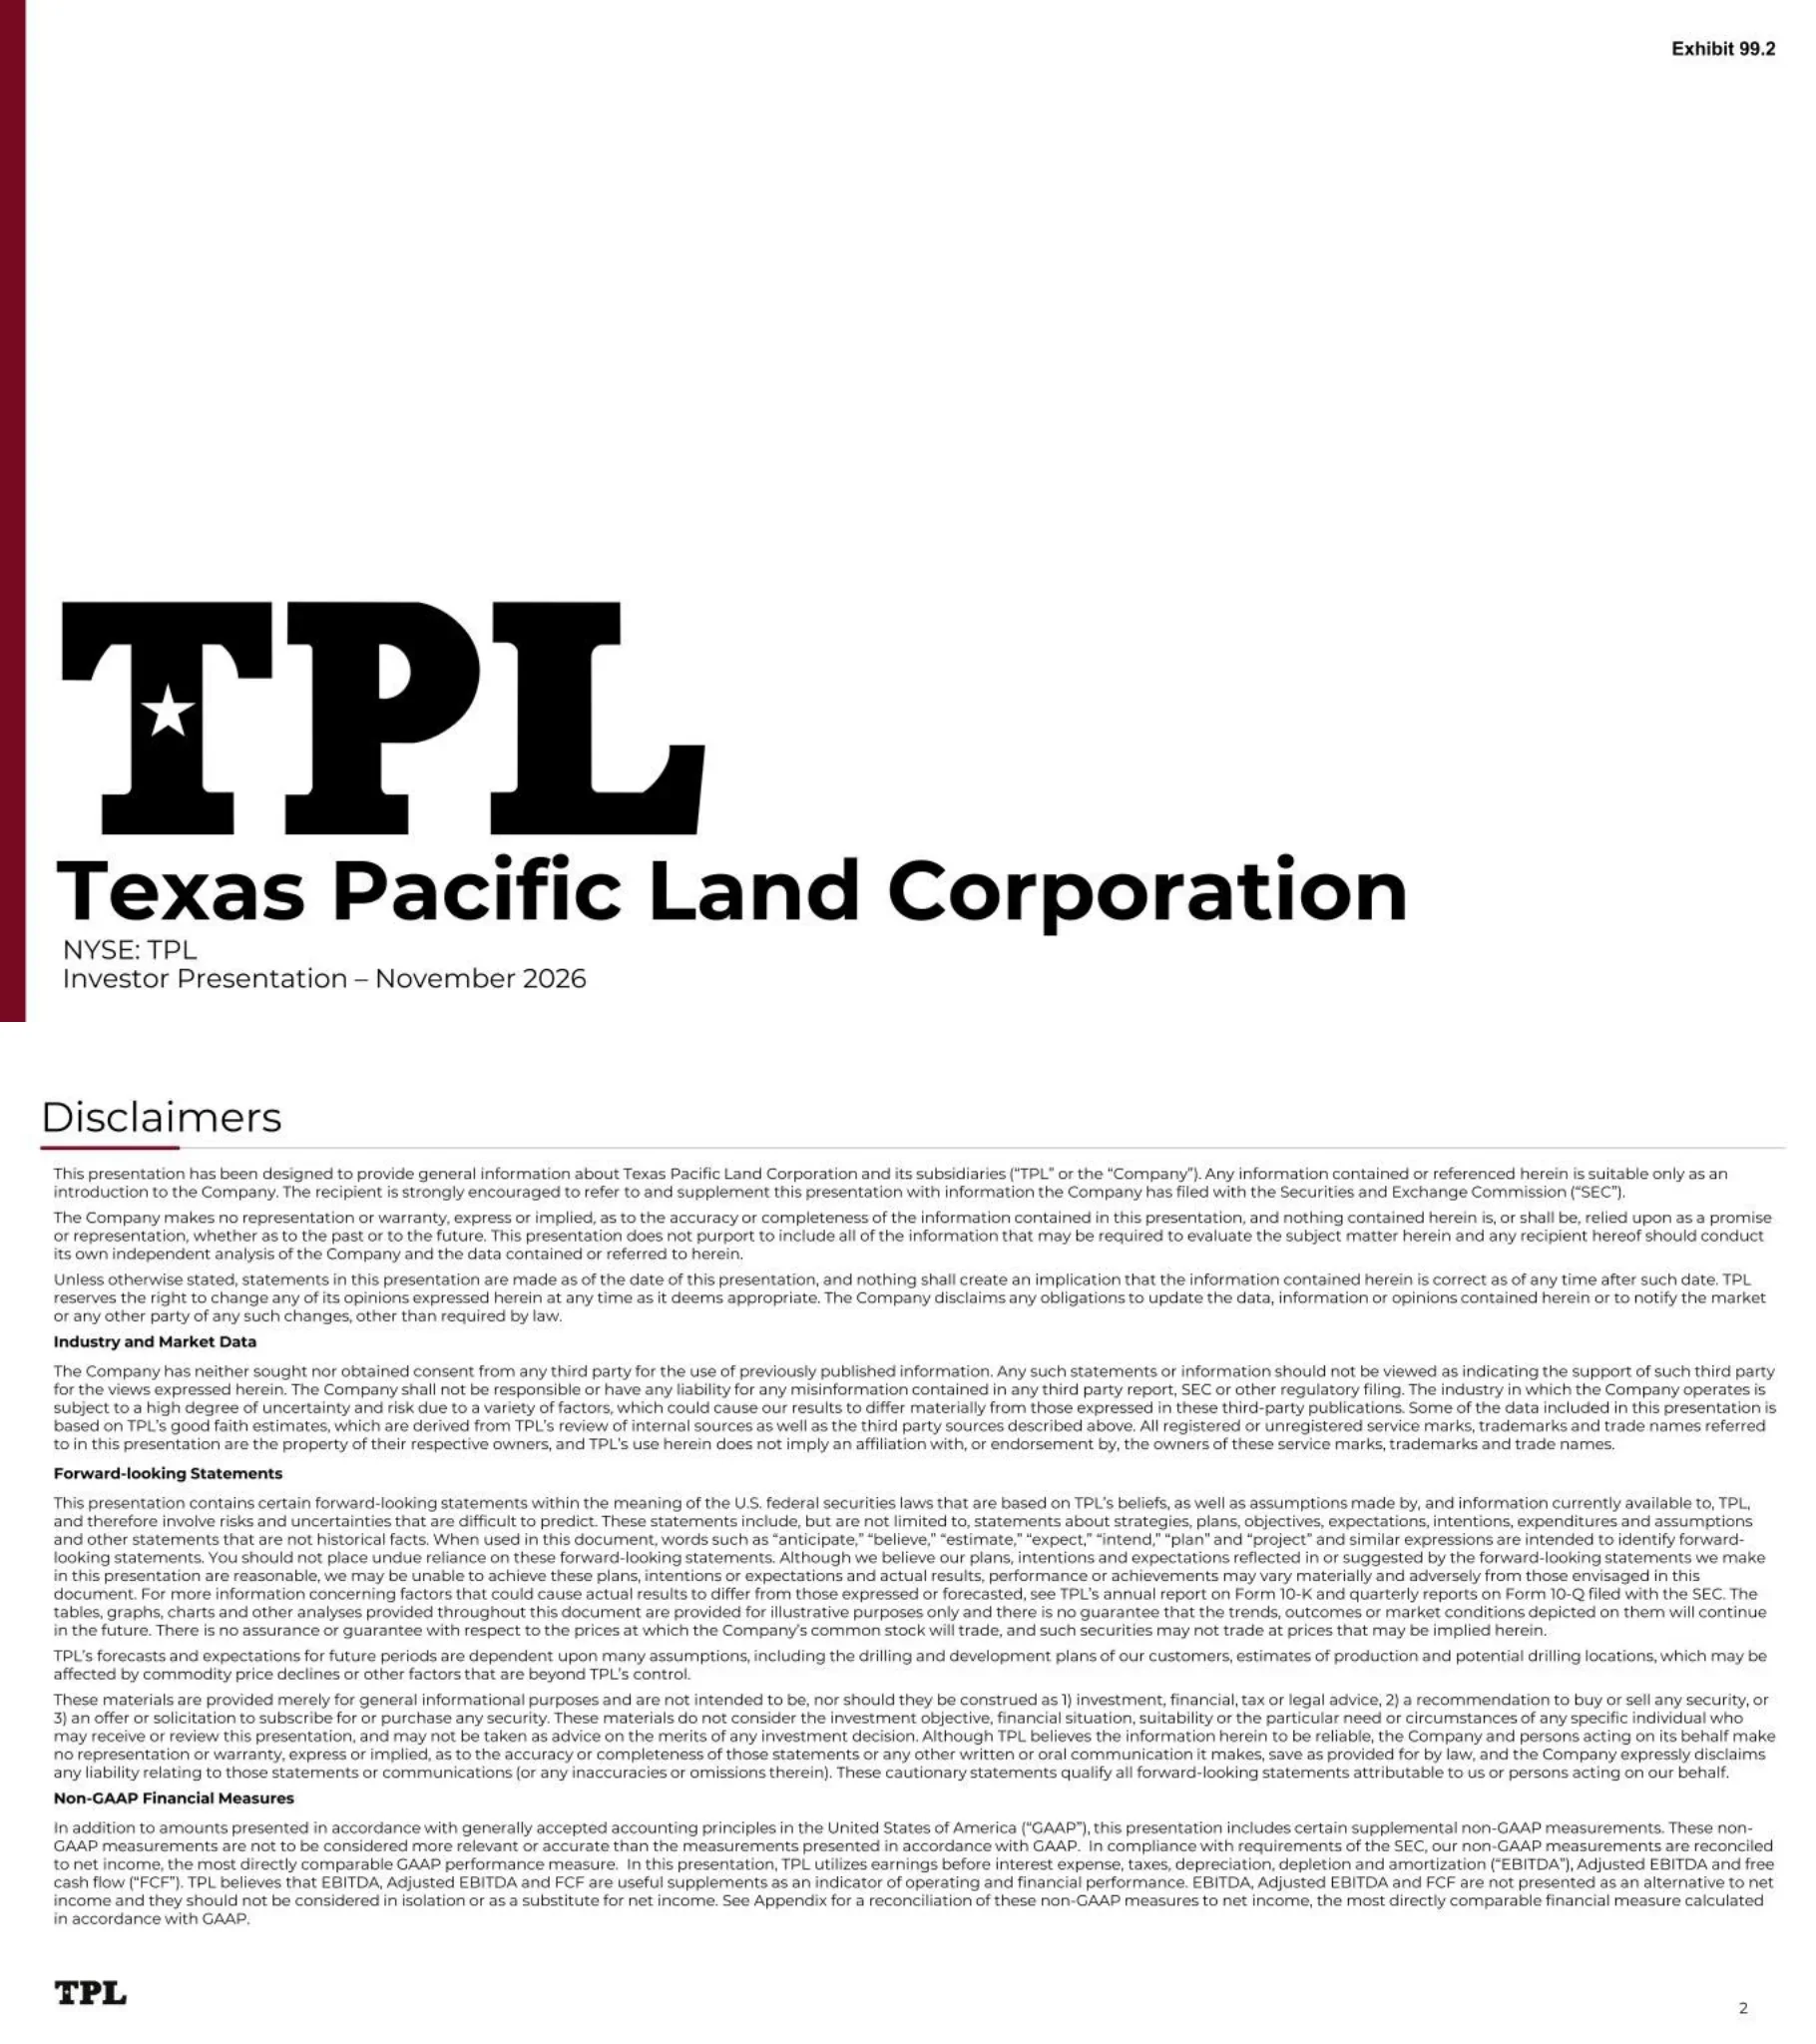
Cover slide with the bold TPL star wordmark, the company name, NYSE: TPL and 'Investor Presentation – November 2026'; the top-right corner is marked Exhibit 99.2.
Mostly white slide with a thin maroon vertical bar on the left edge; oversized black logo and title anchored bottom-left.
Legal disclaimer covering general information, industry and market data, forward-looking statements, and non-GAAP measures (EBITDA, Adjusted EBITDA and free cash flow, reconciled to net income in the Appendix).
Full-width dense text block with bold sub-headings under a title with a short maroon underline.
Five-quarter table (3Q25–3Q26): Q3 2026 total revenue $273.4M (oil and gas royalties $167.3M, water sales $28.4M, produced water royalties $41.4M, easements and other surface income $36.2M, land sales $0.1M), Adjusted EBITDA $238.4M (87% margin), free cash flow $170.3M (62% margin), cash $369.6M and no debt; segment revenue $201.6M (Land and Resource Management) and $71.8M (Water Services and Operations). Charts show royalty production rising to 42.3 mboe/d, oil realizations of $83.57/bbl (down from $97.55 in 2Q26), total water sales of 672 mbbl/d and produced water royalty volumes of 5,541 mbbl/d.
Left half is a financial data table with grey section bands and a dashed divider between 2025 and 2026; right half is a 2x2 grid of bar charts (stacked oil/gas/NGL production, oil realizations, water sales volumes, produced water volumes).
Average annual total return from 1/1/2017 to 12/31/2025 of 29% for TPL vs. 19% for the Nasdaq Composite, 15% for the S&P 500, 1% for WTI oil and (1%) for the S&P Oil & Gas E&P Index; net income bar charts show Land and Resource Management growing from $37M (2016) to $322M (2025) and Water Services and Operations from $5M to $159M. An embedded intro video thumbnail sits on the left.
Split slide: left half maroon panel with video still of a water pond and play button; right half horizontal bar chart of returns above two side-by-side net income bar charts.
Nine highlight tiles: $687M 2025 Adjusted EBITDA, $498M 2025 free cash flow, no debt with $370M cash, pure-play Permian exposure, diversified revenue from royalties, water and surface, ~28,000 core Permian net royalty acres and ~896,000 surface acres, ~390% production growth since 2018, decades of cash flow runway, and an inventory of 957 DUCs and 587 permits.
3x3 grid of icon-plus-text tiles separated by dotted lines; green, maroon and navy colour coding per row.
Company overview: one of the largest landowners in Texas with ~896,000 acres, organized in 1888 as a trust for Texas and Pacific Railway lands, active management since 2016, and three high-margin revenue lines (oil and gas royalties, SLEM, Texas Pacific Water Resources). 'TPL by the Numbers' lists ~$23,000M market value, $370M cash, $0 debt, ~28,000 net royalty acres (~224,000 normalized to 1/8th), 86% 2025 Adjusted EBITDA margin, 62% FCF margin and ~429,000 average daily trading volume. Charts: FY2025 revenue $798M split 62% Land and Resource Management / 38% Water; Adjusted EBITDA $63M (2016) to $687M (2025); FCF $40M to $498M.
Top: bullet text on the left and a key-figures table on the right; bottom: donut chart, maroon bar chart and a maroon-panel FCF bar chart.
Timeline from 1871 (Texas & Pacific Railway granted ~3.5 million acres) through the 1888 trust formation, 1920s first Permian oil well, 1927 NYSE listing, 1954 mineral spin-off (TXL Oil), the 2010s shale revolution, 2016 new management, 2017 formation of Texas Pacific Water Resources and the 2021 C-Corp reorganization, grouped into three eras: Bankrupt Railroad to Liquidating Trust (1871–2009), Shale Revolution (2010s) and Modern Enterprise, with six modern-enterprise priorities.
Horizontal timeline with dated header boxes and icons above a tri-colour era banner; secondary date boxes below and six rounded priority boxes on the right.
County-level map of the Delaware Basin, Central Basin Platform and Midland Basin showing royalty acreage, surface and easement acreage, and combined royalty and surface acreage; an inset pie shows FY2025 revenue contribution of 37% supermajors, 35% large-cap independents and 28% other operators.
Full-width map with legend box top-left and a black inset panel bottom-right holding the pie chart.
Permian crude output of 6.7 MMbbl/d compared with Saudi Arabia (10.0), Russia (9.3), Iraq (4.1) and others, plus 3.3 MMbbl/d of NGLs; ~65,000 estimated remaining well locations with sub-$60/bbl breakeven (Midland and Delaware) vs. ~34,000 in the Montney and ~13,000 in the Eagle Ford; US rig counts by basin from March 2023 to September 2026 with the Permian far ahead.
Three-column chart layout (horizontal bars, vertical bars, line chart) above a navy band with three takeaway statements.
Three pillars: Return Capital (dividends and buybacks from $13M in 2010 to $376M in 2024 and $156M in 2025), Protect Capital (no debt, $370M cash, undrawn $500M credit facility) and Invest Capital ($229M of water capex and $213M of surface and easement acquisitions from 2017 to 2025, with Water Services and Operations generating $716M of cumulative net income).
Three equal columns with maroon, navy and dark-grey header blocks; horizontal stacked bars on the left, large centred text in the middle, figures and a green bar chart on the right.
Framework stating that maximizing intrinsic value per share, expressed as long-term free cash flow per share, drives four levers (legacy asset value, share repurchases, organic opportunities, M&A); a donut shows FY2025 capital allocation funded by cash flow from operations and balance sheet cash, and a bar chart shows FCF per share rising from $2.29 (2018) to $7.22 (2025).
Left: funnel-style text with grey chevrons and four outlined boxes; right: nested donut chart above a maroon bar chart, divided by a vertical rule.
Checklist comparing TPL's surface, water and royalty exposure with Black Stone Minerals, Kimbell Royalty, Viper Energy, NGL Energy Partners, WaterBridge, LandBridge and EagleRock, where only TPL has all three. A side chart shows FY2025 vs. FY2022 revenue growth of +63% for SLEM, +72% for produced water and +100% for water sales, against WTI down 31% and Henry Hub down 45%.
Comparison matrix with a 3D earth cross-section on the left and peer logos across the top; a light-blue panel on the right with a positive/negative bar chart.
FY2025 net income margins of 60% consolidated, 66% for Land and Resource Management and 52% for Water Services and Operations, compared with oilfield services (OIH) 8%, midstream (ENFR) 18%, S&P O&G (XOP) 13% and the S&P 500 at 15%; a histogram of S&P 500 net income margins places TPL in the 58–63% bucket at the far right tail.
Three colour-blocked KPI banners across the top; below, a bar chart on the left and a histogram on the right.
While WTI fell from $95 (2022) to $65 (2025), down 15% year on year and a 12% 3-year CAGR decline, TPL grew royalty production from 21.3 to 34.6 mboe/d (+29% YoY, +17% CAGR), water sales from 462 to 763 mbbl/d (+4% YoY, +18% CAGR) and produced water royalty volumes from 1,957 to 4,292 mbbl/d (+25% YoY, +30% CAGR), with no new debt or equity issued.
Black oil-price bar chart on the left, a grey arrow, then three maroon bar charts with large green growth figures; navy footer banner.
Permian oil production climbing from ~1 mmbbl/d (2010) to nearly 7 mmbbl/d (2026); horizontal rig counts falling from 301 (1Q24) to 222 (1Q26) before recovering to 255 in 3Q26; well permits by sub-basin reaching 2,155 in 3Q26; DUC counts by age as of June 30 (2,267 under six months in 2026 vs. 2,533 in 2024); completion counts declining to 1,273 in 2Q26. 3Q26 DUC and completion data are omitted due to incomplete industry data.
Large navy area chart on the left; four smaller bar charts in a 2x2 grid on the right.
Eight investment highlights: world-class Permian resource, surface plus royalty ownership across a well's lifecycle, efficient cash conversion (FY2025 EBITDA margin 86%, FCF margin 62%), an experienced domain-expert team, technology investments, disciplined capital allocation focused on intrinsic value and FCF per share, opportunities in legacy assets, and growing returns through dividends and buybacks.
Drilling rig sunset photo in a curved mask on the left; eight stacked rounded pink text boxes on the right.
Archival collage with a portrait of Jay Gould (founder of the Texas and Pacific Railway), a Texas Pacific Land Trust certificate of proprietary interest, a New York Stock Exchange sales listing from July 7, 1888, and a historic Texas & Pacific Railway Company map of reservations and land grants across West Texas.
Full-bleed photo collage: three images across the top row and a wide historic map spanning the bottom.
Collage of historic survey photographs: a survey team in June 1930, a 'TP' survey marker at the northwest corner of Section 39, Block 62, Township 2, a surveyor on a rock cairn, El Capitan peak in Culberson County, Camp Delaware, a survey team in sand dunes near the Guadalupe Mountains and the 'Old Red' truck.
Seven-image grid with captions in the top-left corner of each photo; tall centre image flanked by stacked images.
Explains oil and gas royalties (52% of FY2025 consolidated revenue; $28M in 2016 to $412M in 2025), surface leases, easements and materials, or SLEM (11%; $92M in 2025), water sales (21%; $170M) and produced water royalties (16%; $124M), describing which segment each stream belongs to and how each earns revenue.
Four equal columns, each with an outlined title box, bullet text, a large percentage and a ten-year maroon bar chart.
Royalty mechanics: real property interests, a share of gross revenue, no capital costs, interests that last in perpetuity, and the owner's job of verifying decimals and check stubs. A donut shows 132.5 net producing horizontal wells (PDPs) by operator (ExxonMobil, Devon, Oxy, Chevron, Diamondback, EOG, ConocoPhillips, bpx, APA, other); FY2025 production volumes split 39% oil, 31% natural gas and 30% NGLs. A side panel describes how TPL delivers value.
Three columns: icon list on the left, operator donut and volume pie in the centre, light-blue 'How TPL is Delivering Value' panel on the right.
Net royalty production from 1.7 mboe/d (2014) to 34.6 mboe/d (2025); net inventory of permits, DUCs and completed wells at 16.8 in 3Q26 (2.5 permits, 8.6 DUCs, 5.7 completed); net producing wells rising from 70.2 (1Q24) to 132.5 (3Q26), mostly Delaware; average lateral length of new spuds from 9,745 ft (2019) to 13,718 ft (2026); and realizations as a percentage of benchmarks (oil near 100% of WTI, gas volatile vs. Henry Hub, NGLs ~20–35% of WTI).
Navy panel with a white bar chart on the left; four charts (stacked bars, stacked bars, bars, line chart) in a 2x2 grid on the right.
Full-bleed photo of TPL source water infrastructure: blue manifolds and black poly pipelines on a steel rack in front of a lined water storage pond in the Permian.
Full-bleed photograph with a small caption in the top-left corner.
Aerial top-down drone photo of a TPL source water pond, showing the dark liner edge, turquoise water, sandy ground and pipelines running diagonally across the frame.
Full-bleed aerial photograph with a small caption top-right.
Surface ownership controls surface access, aquifers and sub-surface pore space, and earns no statutory rate, so revenue requires continual negotiation. Three surface revenue streams (SLEM, water sales, produced water) generated $386MM in FY2025, or 48% of consolidated revenue. A callout notes that raw land does not monetize itself.
3D layered land-block illustration with KPI figures on the left; text, a grey funnel arrow and three numbered outlined boxes with bullets on the right; navy-and-blue callout box top-right.
SLEM mechanics: standardized forms, easements with initial 10-year terms and renewal options, renewal payments at the greater of 115% or CPI escalation, and long-lived infrastructure. The FY2025 SLEM revenue breakdown of $78MM is 47% pipeline easements, 19% caliche/materials, 12% commercial leases, 10% wellbore easements and 12% other. A term easement renewal schedule for 2026–2035 represents potential renewal revenue of $250M+ from easements executed in 2016–2025.
Three columns: icon list on the left, donut chart above a renewal bar chart in the centre, light-blue value panel on the right.
Water sales mechanics: aquifer access through surface ownership, infrastructure to extract, store and transport brackish and treated produced water, sales prices of $0.50–$1.00 per barrel vs. $0.10–$0.20 direct operating cost, and annual maintenance capex of ~$10–$20 million. Water sales volumes grew from 44 mbbl/d (2017) to 763 mbbl/d (2025). TPL describes its network as the largest source water infrastructure in the northern Delaware Basin.
Three columns: icon list on the left, maroon bar chart in the centre, light-blue value panel on the right.
Map of TPL water well fields, treatment sites, frac pits and TPL-sourced well pads across Eddy, Lea, Loving, Reeves and Ward counties. The source water network has 1,000+ mbbl/d of sourced and produced water treatment capacity, ~38 mmbbl of storage and ~480 miles of pipelines. Average fluid used per Delaware well completion rose from 331 mbbl (2017) to 522 mbbl (2025).
Large map with legend on the left above a maroon three-statement band; right side has three large KPI figures above a navy bar chart.
Produced water basics: the Delaware Basin produces roughly 4 barrels of water per barrel of oil, and TPL earns a volumetric royalty on produced water via negotiated agreements with off-take rights to treat and resell, without operating saltwater disposal wells. Produced water royalty volumes grew from 88 mbbl/d (2017) to 4,292 mbbl/d (2025), with agreements covering a ~450,000-acre dedication.
Three columns: icon list on the left, maroon bar chart in the centre, light-blue value panel on the right.
Map of TPL's produced water Area of Mutual Interest (AMI) and drilling rigs in the Delaware Basin; the average Delaware well yields ~690 mbbl of water vs. ~180 mbbl of oil in its first 12 months and ~1,220 vs. ~310 over 36 months. Permian produced water rose from 11.2 mmbbl/d (2017) to 24.9 mmbbl/d (2025), with ~70% coming from the Delaware.
Map with callout bubbles on the left above a maroon three-statement band; two navy bar charts stacked on the right.
Rendered 3D drilling spacing unit (DSU) illustration paired with a three-stage lifecycle: Permit (SLEM fixed fees and caliche sales), Development (water sales of brackish and treated water) and Production (produced water royalties, oil and gas royalties, and ongoing SLEM payments).
Large rounded 3D render on the left; numbered vertical process with outlined revenue boxes and bullets on the right.
Map of the Midland and Delaware basins inside the greater Permian, with a combined footprint of ~26,000 square miles (~17,000,000 acres) and 10+ geologic formations in each basin, illustrated by 3D cutaways of Delaware benches (Avalon, Bone Spring, Wolfcamp XY–D) and Midland benches (Spraberry, Jo Mill, Dean, Wolfcamp A–D).
Left column with a maroon header, simple map, KPI numbers and a second header; right side shows two large 3D geological block diagrams.
Three drivers of produced water growth: water-to-oil ratio rises as wells age (WOR curves by 2017–2024 vintage), Delaware benches have higher WOR (Wolfcamp A 3.7x, B 5.7x, C 6.6x, D 5.7x vs. 4.3x for the current Permian), and overall Permian oil growth. A stacked area chart shows Permian produced water reaching roughly 25 mmbbl/d by 2025 across the Delaware, Midland and other areas.
Left column of three small charts, centre column of three maroon circles with takeaways, large stacked area chart on the right, joined by a grey arrow.
TPL's freeze-desalination process uses differing freeze points across salinity levels and is developed with an industrial-refrigeration partner. Milestones achieved include a process patent filing, RRC land application permits, a university research partnership, a draft TPDES permit from the TCEQ and commissioning of the Phase 2 ~10k bbl/d facility. Upcoming steps: in 2026, evaluate behind-the-grid gas-to-power for microgrids or data centers; from 2027, procure equipment for a ~100k bbl/d Phase 3 commercial facility. Photos show the Phase 1 test unit, a beneficial reuse greenhouse and the Phase 2 facility in Orla, TX.
Black rounded overview panel and green benefits panel on the left; checklist of milestones in the centre; three stacked photos on the right linked by connector lines.
Checklist of West Texas advantages for data centers: natural gas (22+ bcf/d of Permian gas, expected to grow 8+ bcf/d over 5–10 years), solar (11+ GW current, 11+ GW expected), wind (27+ GW current), batteries (4+ GW current, 5+ GW expected), local aquifer water, skilled workforce and a pro-growth regulatory environment, with freeze desalination co-location efficiencies marked TBD.
Rendered desert landscape of wind turbines, solar, power plant, data center and water pond as background; translucent white checklist rows on the left.
Full-bleed photograph of a row of wind turbines across flat West Texas desert at dusk under dramatic clouds, with a dirt road and a truck in the foreground; no text besides the page number.
Full-bleed image slide.
Section divider introducing the appendix.
White slide with a faint topographic contour background, a thin vertical black line and a large maroon 'Appendix' heading.
Donut charts of 100% NRI permitted wells (5.7), DUC wells (8.6) and completed wells (2.5) by operator and by region (permitted 68% Delaware / 29% Midland; DUCs 59% / 38%; completed 51% / 48%). Conversion rates: ~85% of permits drilled within 6 months and ~93% within 12; ~48% of DUCs completed within 6 months and ~90% within 12; ~68% of completed wells listed as producing within ~1 month.
Two rows of three donut charts (by operator, by region), with dashed callout boxes above each column and operator and region legends on the right.
Comparison table of royalties/minerals vs. lease (working) interest across participants, ownership, duration, revenue interest (Texas mineral estates generally receive 25% of gross production; federal leases 12.5–18.5%), capital costs, operating expenses and taxes, with an illustrative flow diagram showing minerals/royalties taking 25% of revenue and the lease operator 75% while bearing 100% of capital and most operating costs.
Left: row-labelled comparison table with black column headers and outlined row labels; right: Sankey-style illustrative economic model.
Target 2025 CEO pay mix: 13% fixed base salary and 87% variable, split into an annual incentive plan (15%; Adjusted EBITDA 25%, FCF per share 50%, strategic objectives 25%), PSUs (36%; three-year cumulative FCF per share and relative TSR vs. the SPDR S&P Oil & Gas E&P ETF) and time-based RSUs (36%).
Table with mix donut charts, intent bullets and performance dimensions, plus vertical navy and maroon side bands labelled Fixed (13%) and Variable (87%).
Key opportunities across carbon management (carbon capture, utilization and storage), water management (produced water recycling and electrification), environmental management, renewable development (wind and solar on TPL surface) and investing in people, including that 39% of the workforce are women.
Five rows with colour-blocked labels (maroon, navy, grey, rose, black) on the left and bullet text on the right.
Four initiative areas: incidents and spill prevention control (SPCC plans, centralized spill tracking), environmental impact assessments (Phase 1 site assessments, pipeline checkups), ecological and biodiversity partnerships (New Mexico Bureau of Land Management guidance, grazing standards) and operator and lessee requirements (engagement and land reclamation).
Four rows with maroon headings on the left, large dark chevrons in the middle and bullet text on the right.
Key statistics for 2021–2025: Scope 1 plus Scope 2 emissions of 22,755 to 30,675 metric tons CO2e, zero methane emissions, zero produced water spills, energy use and grid mix for TPWR operations (2025 marked TBD), and zero recordable and lost-time incidents since 2022. A line chart compares revenue ($303M in 2020 to $798M in 2025) with emissions (24.1k to 30.7k tons).
Data table with maroon header row on the left; dual-line chart on the right.
Royalty acreage by focus area: Delaware 396,200 gross royalty acres and 19,700 net royalty acres (5.0% average royalty), Midland 706,000 and 6,600 (0.9%), other 34,300 and 1,700, for a total of 1,136,500 gross and 28,000 net royalty acres, a 2.5% average royalty, 2,840,300 gross DSU acres and a 1.0% implied average net revenue interest per well. Definitions show how each figure is calculated, including 224,000 net royalty acres normalized to 1/8th.
Dark-header data table on top; definitions list below with maroon label pills and two columns (Description, How It's Calculated).
Reconciliation of net income to EBITDA, Adjusted EBITDA and free cash flow for 2019–2025 and 3Q25–3Q26: FY2025 net income $481.4M, EBITDA $673.6M, Adjusted EBITDA $687.4M (86.1% margin) and FCF $498.3M; 3Q26 net income $167.4M, Adjusted EBITDA $238.4M (87.2%) and FCF $170.3M. Adjustments include share-based compensation, a $20.9M land sale with financing arrangement in 1Q26 and 2019 significant land sales.
Dense financial table split into annual and quarterly column groups, with grey label column and bold subtotal rows.
Segment reconciliations for 3Q25–3Q26 and FY2024–2025: Land and Resource Management 3Q26 revenue $201.6M, Adjusted EBITDA $189.2M (93.9%) and FCF $145.1M (FY2025 FCF $369.5M); Water Services and Operations 3Q26 revenue $71.8M, Adjusted EBITDA $49.2M (68.5%) and FCF $25.2M (FY2025 FCF $128.8M).
Two side-by-side financial tables under maroon and navy segment headers, each with quarterly and annual columns.
Income statement and balance sheet summary for FY2023–2025 and 3Q25 vs. 3Q26: total acres 896,360 at 3Q26; FY2025 revenue $798.2M, operating income $592.2M (74.2%) and net income $481.4M (60.3%); 3Q26 revenue $273.4M, operating income $207.8M (76.0%) and net income $167.4M (61.2%); 3Q26 cash $369.6M, no debt and total assets $1,988.1M.
Single wide financial table with grey label column, annual and quarterly column groups, and a key balance-sheet section at the bottom.
Closing slide with the Texas Pacific Land Corp. seal ('Est. 1888', with mountain, windmill, wind turbine, solar panels and derrick) and the company address: 2699 Howell Street, Suite 800, Dallas, Texas 75204.
Centred oval seal logo on white with the company name and address below.
Common questions about this slide and the underlying presentation content.
It is Texas Pacific Land Corporation's (NYSE: TPL) November 2026 investor deck, released with its third-quarter 2026 results and filed with the SEC as Exhibit 99.2 to a Form 8-K. Its 47 slides cover Q3 2026 financials, TPL's Permian Basin royalty, surface and water businesses, capital allocation, desalination and ESG, with non-GAAP reconciliations in the appendix.
The slides come from the exhibit to TPL's Form 8-K on SEC EDGAR (Exhibit 99.2). EDGAR stores the exhibit as rasterized slide images, and this PDF was assembled from those images, so text is not selectable. Small print on most slides is readable, but for exact figures check the original filing or TPL's Form 10-Q.
Total revenue was $273.4 million, Adjusted EBITDA $238.4 million (87% margin) and free cash flow $170.3 million. Net income was $167.4 million, cash and equivalents $369.6 million and debt zero. Royalty production reached 42.3 mboe/d and produced water royalty volumes 5,541 mbbl/d.
The five-quarter KPI dashboard (slide 3), the nine-tile 'Unique Permian Basin Pure-Play' summary (slide 5), the four-revenue-stream layout (slide 19), the well lifecycle revenue diagram (slide 30) and the royalties vs. lease interest comparison (slide 38) are strong models for a royalty, minerals or land company.
It describes four revenue streams: oil and gas royalties (52% of FY2025 revenue), surface leases, easements and materials or SLEM (11%), water sales (21%) and produced water royalties (16%). It reports them in two segments, Land and Resource Management and Water Services and Operations, and shows how TPL earns money at each stage of a well's life.
Yes. Slides 44 and 45 reconcile net income to EBITDA, Adjusted EBITDA and free cash flow, consolidated and by segment, for 2019–2025 and each quarter from 3Q25 to 3Q26. Slide 46 adds a historical income statement and balance sheet summary.
You can download the PDF from this page and use it as a reference for structure, chart types and layout. The content, logos and data belong to Texas Pacific Land Corporation, so rebuild the design with your own content instead of reusing their material.
TPL is grouped under Oil & Gas Exploration & Production. Its income comes mainly from royalties, surface use and water services on its Permian Basin land, not from drilling wells itself.
Original exhibit filed with TPL's Q3 2026 results; the source of these slide images.
All of TPL's SEC filings, including Forms 10-Q, 10-K and 8-K.

Create Your Own Slides
Turn your ideas into professional presentations in seconds with 2slides AI.
Reference professional designs, choose your style, and generate slides with perfect text rendering. Powered by Nano Banana—start creating your presentation now.
Your AI Agent for slides. Save time, shine faster with intelligent presentation creation.


© 2026 2slides. All rights reserved.