
Part of Investor presentation examples · Australian investor presentation examples
Telix Pharmaceuticals (ASX: TLX, NASDAQ: TLX) Capital Markets Day, held 4 November 2026 in Melbourne, Australia, and lodged with the ASX. This 94-page investor presentation covers the company's strategy as a vertically integrated radiopharmaceutical (theranostics) business, its commercial products, the pending ITM acquisition, late-stage therapeutic pipeline in prostate, brain and kidney cancer, and a financial overview. Figures are in US$ (US dollars); the one Australian dollar figure is FY2026 revenue guidance of US$950-970M, equal to A$1.36-1.39B (Australian dollars).
Uses this deck’s cover as a style reference for slides made from your own content. Or pick any page below to use its layout as the reference.
Quick Navigation
Tags
Share the slides
Telix Pharmaceuticals (ASX: TLX, NASDAQ: TLX) Capital Markets Day, held 4 November 2026 in Melbourne, Australia, and lodged with the ASX. This 94-page investor presentation covers the company's strategy as a vertically integrated radiopharmaceutical (theranostics) business, its commercial products, the pending ITM acquisition, late-stage therapeutic pipeline in prostate, brain and kidney cancer, and a financial overview. Figures are in US$ (US dollars); the one Australian dollar figure is FY2026 revenue guidance of US$950-970M, equal to A$1.36-1.39B (Australian dollars).
Detailed view of each slide page, including layout, key content and visual elements.
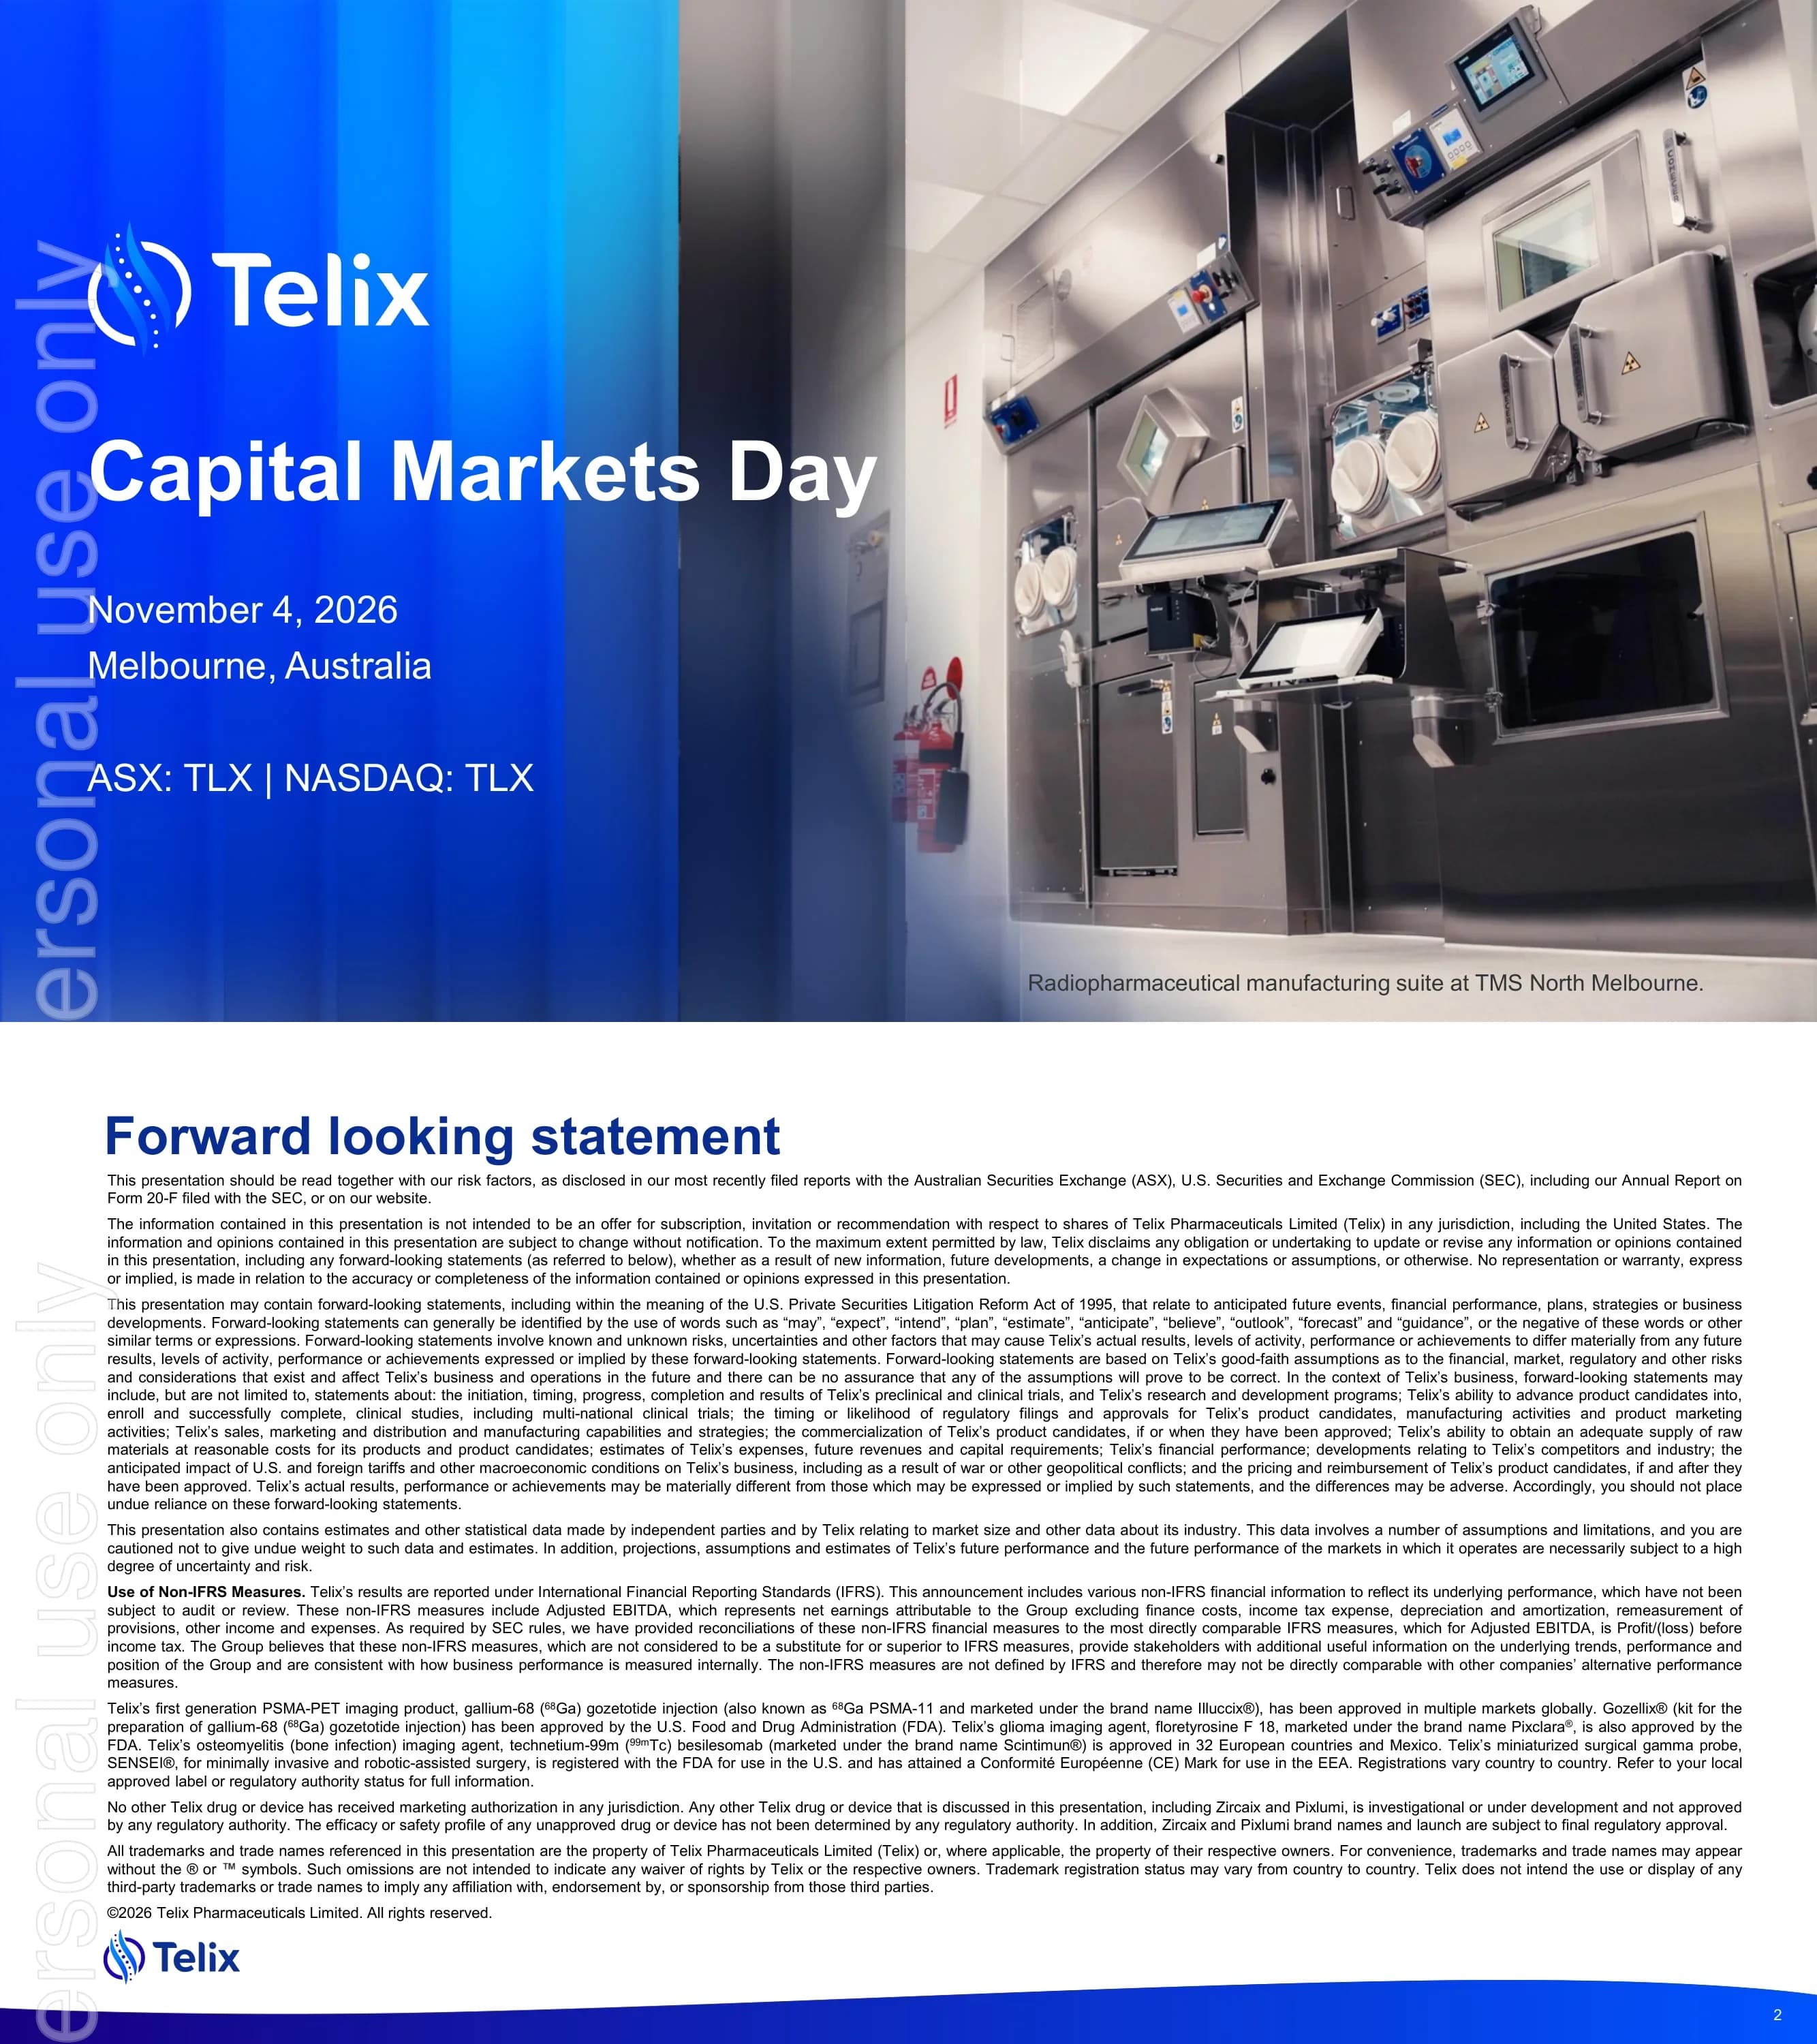
Cover slide for the Telix Capital Markets Day on November 4, 2026 in Melbourne, Australia, with the ASX: TLX | NASDAQ: TLX listing line.
Blue gradient panel on the left carrying the event title, date, location and listing codes, with a full-height photo on the right.
Dense legal disclaimer covering risk factors, ASX and SEC filings including Form 20-F, non-IFRS measures such as Adjusted EBITDA, and product approval status: Illuccix, Gozellix, Pixclara, Scintimun and SENSEI are approved, while Zircaix and Pixlumi are investigational.
Full-page text disclaimer in small type with a title at top-left and footer band.
Introduces the three presenting executives: Dr. Christian Behrenbruch (Managing Director & Group CEO), Darren Smith (Group CFO) and Dr. David N. Cade, MD (Group Chief Medical Officer).
Dark blue background with three circular portraits in a row, each with name and title beneath.
Introduces four independent experts: Prof. Munir Ghesani (Icahn School of Medicine at Mount Sinai; United Theranostics), Dr. Philip Dundee (Royal Melbourne Hospital), Prof. Louise Emmett (St Vincent's Hospital Sydney) and Prof. Andrew Scott (University of Melbourne / La Trobe; Olivia Newton-John Cancer Research Institute). A note states they are independent experts paid fair market value.
Four circular portraits in a row with names and affiliations below, plus a disclosure note at the foot.
Section divider introducing the strategy and overview session presented by Dr. Christian Behrenbruch.
Deep blue and indigo gradient on the left with white Telix logo, section title and speaker name and role; large circular speaker portrait on the right behind a curved white arc.
A diversified, vertically integrated radiopharma company with an integrated theranostic approach: See It. Treat It. Five pillars span a precision medicine portfolio, specialist commercial organization, vertically integrated manufacturing and supply, a high-value therapeutics pipeline and an R&D platform for new molecular entities. KPIs: 3 FDA-approved products (Illuccix, Gozellix, Pixclara), Illuccix available in 22 countries, 45 manufacturing and distribution sites, and FY2026 revenue guidance of US$950M-$970M (AUD $1.36-1.39B). Data as of October 30, 2026.
Five photo-topped pillar cards in a row beneath the headline, with a row of four large KPI numbers and a purpose statement about helping people with cancer and rare diseases.
The global nuclear medicine market grows from US$11B in 2024 to US$27B in 2030 and US$41B in 2034, with therapeutics rising from about US$3B to about US$27B. Ten-year CAGR is 26% for therapeutics and 5% for diagnostics. More than 100 therapeutic targets are in development (41 Lu-177, 34 Ac-225, 25 Pb-212, 16 At-211 candidates) across about 50 radiopharma companies. Source: MEDraysIntell 2025, William Blair.
Stacked bar chart of therapeutics versus diagnostics on the left, with callout stats and a candidate-count breakdown on the right.
Three growth engines: 1) a scaled commercial business, 2) a therapeutic and precision medicine pipeline, and 3) best-in-class manufacturing and supply.
Numbered list with navy circle icons on the left and a collage of PET scan images on the right.
Illuccix is launched in 22 countries, with an NDA under review by China NMPA and a Japan registration study that has completed enrollment. Gozellix is shown as a product kit. Pixclara (floretyrosine F 18) is the first FDA-approved FET-PET imaging drug for glioma, supported by NCCN guidelines and EANM/EANO/RANO/SNMMI recommendations.
Three equal light grey-blue cards, each with a product image and an FDA APPROVED badge.
U.S. total addressable market by product: Illuccix/Gozellix about 670,000 scans (~$2.7B); Pixclara about 21,200 scans (~$106M, rising to ~$300M+ with baseline FET PET); Zircaix for kidney cancer about 116,320 scans (~$600M); BiPASS for pre-biopsy prostate about 821,000 scans (~$3.3B); ITM-11 for GEP-NETs about 13,800 patients (~$1.7B, subject to ITM close). Telix has the potential to add three high-value commercial products in 2027. TAM modelled at $4,000 per scan and $250,000 per treatment.
Comparison table with navy header row and one row per product, with a highlight banner on the 2027 launch potential and assumption footnotes.
Four late-stage therapeutics: TLX591-Tx in prostate (~$5.6B, ~22,460 patients, Phase 3, interim futility analysis); TLX597-Tx in prostate (~$4.2B, ~16,800 patients, Phase 2, OPTIMAL-PSMA readout); TLX101-Tx in glioblastoma (~$1.2B, ~8,100 patients, Phase 3, enrollment progression); TLX250-Tx in kidney cancer (~$1.1B, ~4,700 patients, Phase 2/3, enrollment progression). Framed as transformational therapeutic opportunities and higher-margin product launches.
Four-row table by asset with indication, market value, patient numbers, phase and next milestone columns.
Six benefits of vertical integration: supply security, speed, economics (COGS advantage), scalability, risk mitigation and faster innovation. The banner reads 'From secure supply to timely and reliable patient access'.
Two-by-three grid of light grey-blue icon cards with a full-width banner underneath.
Value chain from radioisotope supply to targeting molecules and cold kit, radiolabelled drug, unit dose QC and last-mile delivery, with Telix capabilities beneath each step: ARTMS (isotope production), IsoTherapeutics (bioconjugation), Telix Manufacturing Solutions sites (Seneffe Belgium GMP, Yokohama clinical, Sacramento clinical and process development, North Melbourne hotlab and dosimetry), RLS Radiopharmacies (dispensing and distribution), plus ITM for isotope manufacturing.
Horizontal chevron flow across the top with a capabilities row mapped under each stage.
Three columns: ARTMS QIS technology producing 68Ga and 89Zr (for the Zircaix launch); ITM as global leader in Lu-177 with capacity for TLX591, TLX597, TLX250 and ITM-11; and next-generation alphas including Telix's 212Pb generator, the IBA/Framatome (Ekalia) partnership for 211At, and 225Ac via the ITM x Actineer JV and EZAG.
Three equal columns with header, icon and bullet points each.
World map showing Telix Manufacturing Solutions sites in Seneffe, Yokohama and Melbourne, and strategic partners ARTMS, Optimal Tracers, IsoTherapeutics, RLS, R2Pharma and a China partner.
Full-width world map with location pins and partner callouts around it.
Telix plus ITM is mapped across five pillars with check marks: value creation from therapeutic radioisotope leadership, accelerated therapeutic commercial infrastructure, novel product and life-cycle opportunities, commercial depth, and enhanced development.
Grid with Telix and ITM contributions against five pillar rows, marked by check icons.
The 177Lu market grows from US$0.5B (2025) to US$2.1B (2035), a 23% CAGR; 225Ac grows from US$0.1B to US$1.4B, a 45% CAGR. Radioisotope markets are growing about 30% per year through 2035. Industry assets in development: 41 Lu-177 (plus two commercial therapies) and 34 Ac-225.
Two bar charts side by side with CAGR labels, plus a dark-blue molecule panel with asset counts.
A 'Why invest now?' panel (secure supply, attract talent, partner of choice) sits beside a capability comparison of big pharma, specialty radiopharma and Telix + ITM. Telix + ITM ticks every row: Lu, Ac, Tb and I therapeutics; peptide, antibody and small-molecule modalities; commercial diagnostics; and Lu and Ac isotope supply.
Text panel on the left and a three-column capability comparison table with tick marks on the right.
Combined footprint map: 3 manufacturing sites and 2 cyclotrons in Belgium, ITM global HQ and 2 sites in Germany, TMS Sacramento, TMS Yokohama cyclotron, U.S. HQs, Global HQ and TMS North Melbourne, an RLS network covering more than 85% of the U.S. market, planned cyclotrons at RLS sites and JVs.
World map with labelled location callouts for Telix and ITM sites.
Section divider introducing the pipeline session presented by Dr. David N. Cade.
Deep blue gradient on the left with white Telix logo, section title and speaker details; circular speaker portrait on the right behind a curved white arc.
Pipeline chart by indication. Urologic oncology: TLX591-Tx (mAb/177Lu/PSMA, Phase 3), TLX250-Tx (mAb/177Lu/CAIX, Phase 3), TLX597-Tx (small molecule/177Lu/PSMA, Phase 2), TLX592-Tx (225Ac PSMA), TLX090-Tx (153Sm, bone metastases), TLX252-Tx (225Ac CAIX). Neurologic oncology: TLX101-Tx (131I LAT1, Phase 3), TLX102-Tx (211At LAT1). Other tumors: TLX66-Tx (90Y CD66), TLX400-Tx (FAP), TLX300-Tx (PDGFRa). A paired imaging agents column accompanies the assets.
Pipeline grid grouped by indication with progress bars per phase and a paired-imaging column at the right.
Regeneron deal: co-development and co-commercialization of alpha therapies, 4 initial programs plus an option for 4 more, with up to US$2.1B in milestones plus royalties. ITM: a complementary therapeutic franchise with ITM-11 Phase 3 expansion, label expansion into G2/G3 GEP-NETs and lung/thymus NETs, and the world's largest 177Lu supply.
Two side-by-side cards, one for Regeneron and one for ITM, each with key terms listed.
Section divider for the session on 68Ga PSMA-11 in clinical practice presented by Dr. Munir Ghesani.
Blue gradient left panel with white logo, section title and speaker; circular portrait on the right behind a curved white arc.
In the proPSMA trial (n=295), 68Ga PSMA-11 PET/CT versus CT plus bone scan showed accuracy of 92% vs 65%, sensitivity 85% vs 38%, specificity 98% vs 91%, management change 28% vs 15%, equivocal results 7% vs 23% and radiation 8.4 vs 19.2 mSv. The Illuccix China BCR study (n=140) reported patient-level PPV of 94.8% (95% CI 85.9-98.2%) and PPV of 90-100% across PSA bands. Benefits include guideline support, same-day imaging and dosing flexibility.
Comparison table of trial metrics on the left, with a China study panel and benefit callouts on the right.
Ga-68 is metabolized via the liver and has no bone affinity, whereas F-18 has natural bone affinity that can cause false-positive bone findings. The slide includes an SNMMI guideline quote and a quote from Prof. Ghesani.
Two-column comparison of Ga-68 versus F-18 behavior with quote boxes beneath.
An F-18 PSMA PET scan showed an anterior rib lesion in a patient (PSA 3.4) on active surveillance. A 68Ga PSMA-11 PET six months later showed no rib lesion, confirming it was benign.
Image grid of CT, PET and fused views for the two scans with short captions.
A 68-year-old with Gleason 9 (4+5) and PSA 112 was referred for 177Lu-PSMA (Pluvicto). Multiple lesions were visible on 68Ga PSMA-11 but not on 18F-PSMA.
Side-by-side maximum intensity projection (MIP) images with a clinical history panel.
The labelled acquisition window is 50-100 minutes. With a 68-minute half-life, about one quarter of activity remains at 150 minutes. Acquisition beyond 120 minutes is permitted for indeterminate findings (EANM/SNMMI guideline 2.0).
Three big-number columns with a short explanatory caption under each.
Prospective pilot comparing early imaging at about 60 minutes with delayed imaging at 150 minutes in 3 prostate cancer patients, yielding 13 paired lesions.
Simple study-design diagram with two timepoint boxes and a cohort summary.
Paired axial PET images show higher lesion-to-background contrast at 150 minutes than at 60 minutes.
Two paired axial image panels labelled with acquisition times.
Paratracheal lymph nodes are compared across early imaging, delayed imaging and the CT correlate.
Three-image row showing early, delayed and CT views.
10 of 13 lesions had higher delayed SUVpeak, with a +8% median paired change (range -10.7% to +25.3%). Mean SUVpeak was 5.60 early versus 6.24 delayed.
Lesion-level bar chart (L1-L13) with summary statistics alongside.
Contrasts the prevailing assumption with the primary hypothesis that early imaging yields superior clarity because count density dominates.
Two text cards side by side, one for the assumption and one for the hypothesis.
Retrospective paired study of 20 SSTR-positive NET patients read by 3 board-certified readers, comparing early imaging at about 1 hour with delayed imaging at about 24 hours using a blinded two-alternative forced choice.
Study-design flow diagram with rounded navy boxes and arrows.
24-hour delayed imaging shows reduced image uniformity compared with 1-hour imaging, shown with MIP and axial views.
MIP and axial image pairs labelled 1h and 24h.
A hepatic lesion conspicuous at 1 hour was not visible at 24 hours, shown with a CT correlate.
Image panels for 1h, 24h and CT with lesion arrows.
A retroperitoneal lymph node absent at 1 hour became conspicuous at 24 hours.
Paired image panels for 1h and 24h with lesion arrows.
Early imaging alone detected 104 lesions, delayed imaging alone 82, and combined imaging 115, which is 11 more than early imaging.
Three large-number columns with labels beneath each.
U.S. PSMA-PET scans (thousands) along the disease course: initial staging 151, biochemical recurrence (BCR) 460, response to treatment nmAPMR 143, monitoring mAPMR 71, RLT selection 58, and monitoring response to RLT 52. The current TAM is about 670,000 scans per year, against about 1M biopsies.
Curve of scan volumes plotted along disease progression stages, with a TAM callout.
Moving imaging to the pre-biopsy stage adds about 821,000 scans per year against 1M+ biopsies, with the potential to double the PSMA market.
Disease-progression curve extended to the pre-biopsy stage with a highlighted new-volume segment.
Section divider for the prostate cancer diagnosis session presented by Dr. Philip Dundee, urological surgeon.
Blue gradient left panel with logo, title and speaker details; circular portrait on the right behind a curved white arc.
Template biopsies take 15-20 samples under anesthesia and bring sampling limitations, infection and bleeding risks, and recovery of days to weeks.
Bullet list of limitations on the left with a transperineal biopsy illustration on the right.
MRI is non-specific. About 800,000 biopsies are performed in the U.S. each year, up to 75% of them negative, and up to 25% of men refuse biopsy. Biopsy false-negative rates can be as high as 50%.
Key stat callouts on the left with a prostate biopsy map diagram on the right.
PRIMARY (n=291): Ga-PSMA-PET plus mpMRI versus mpMRI alone gave sensitivity 97% vs 83%, specificity 40% vs 53% and NPV 91% vs 72%; the PRIMARY score reached sensitivity 94% and specificity 68%, and the P-score 94% and 66%. PRIMARY2 (n=660): biopsy reduction of 49%, with csPCa detected in 12% vs 16%.
Two-panel results layout, PRIMARY on the left and PRIMARY2 on the right, with comparison tables and highlighted values.
68Ga-PSMA-11 plus mpMRI (PI-RADS 1-4) followed by template biopsy and 6-month follow-up. n=350, co-primary endpoints sensitivity and specificity, global multicenter open-label single-arm design. Enrollment is completed. NCT07052214.
Trial-design flow diagram with rounded navy boxes and arrows, plus a design summary panel.
PSMA-PET plus mpMRI risk stratification: high risk (PI-RADS 5) goes to image-guided biopsy; PI-RADS 1-4 with a positive PET leads to a 'One and Done' precision biopsy; PI-RADS 1-2 with a negative PET leads to 'None and Done' with no biopsy. The aim is to reduce 12-40 biopsies to 1-2.
Decision-tree flow diagram branching by PI-RADS score and PET result.
Compares the current approach of 3 MRI acquisitions with a future approach of 1 PSMA PET scan. A 72-year-old with PI-RADS below 3 had focal uptake in the right anterior apex on PSMA PET (BIOPSTAGE trial).
Current versus future comparison on the left with a case image panel on the right.
Section divider for the brain cancer overview presented by Prof. Andrew Scott.
Blue gradient left panel with logo, title and speaker; circular portrait on the right behind a curved white arc.
Pixclara is the first FDA-approved imaging agent for gliomas in the U.S. The European Pixlumi MAA has been accepted. NCCN and international guidelines support use, and expansion into brain metastases is planned. It differentiates progression from treatment effects and has orphan drug designation.
Key point list on the left with a brain PET image panel on the right.
Shoreline Research (Jan 2026): about 70% of physicians are ready to prescribe Pixclara upon approval, about 80% of referrers rely on NCCN, more than 90% have in-house PET scanner availability, and referrers value differential uptake and image quality.
Four-quadrant tile layout, each tile carrying one large statistic and caption.
LAT1/LAT2 amino acid transporters are highly expressed in gliomas. Pixclara targets LAT1/LAT2, while TLX101-Tx (131I) and TLX102-Tx (211At) target LAT1, offering a potential first-in-class theranostic pairing in neuro-oncology.
Cell-membrane mechanism diagram with transporter labels and a summary callout.
MRI and 18F-FET PET are shown side by side, with FET TBRmax of 3.2 near the resection cavity, alongside the limitations of contrast-enhanced MRI.
Side-by-side MRI and FET PET images with a limitations list.
TLX101-Px plus MRI showed sensitivity 93% and specificity 94%, versus MRI alone at 96% sensitivity and 53% specificity (Pauleit et al. 2005).
ROC curve and comparison figures on the left with histology images on the right.
A 35-year-old with diffuse astrocytoma had an 18F-FET TBRmax of 3.9; biopsy confirmed progression to anaplastic oligoastrocytoma (WHO grade III).
MRI and FET image panels with a time-activity curve and case summary.
Timeline from 1970 to 2030 of FDA approvals in glioma (radiotherapy, lomustine, carmustine, Gliadel, TMZ, bevacizumab, tumor treating fields, vorasidenib and Pixclara) with imaging and biomarker milestones.
Horizontal timeline with approvals above the line and imaging and biomarker milestones below.
About 25k brain and CNS cases and about 18k deaths per year in the U.S. GBM is about 50% of malignant CNS tumors (about 15k+ patients per year). Median OS is 12-15 months from diagnosis and 3-9 months from recurrence.
Statistic callouts on the left with incidence and survival line charts on the right.
About 60 patients treated, including pediatric patients, and the drug was well tolerated with no DLTs in IPAX-2. Median OS was 23 months (IPAX-1) and 32.2 months (IPAX-Linz) from initial diagnosis, and 13 months and 11.9 months from treatment or progression. IPAX BrIGHT Phase 3 and IPAX-2 are ongoing.
Results table comparing studies with survival highlights and a status panel.
Part 1 is dose optimization (4 GBq plus lomustine 90 mg/m2 for 3 cycles, n=3 then n=12). Part 2 randomizes 1:1 TLX101-Tx plus lomustine versus lomustine. Endpoints are MTD (Part 1) and OS (Part 2) in recurrent GBM. Open in Austria, Australia, Belgium and the Netherlands; authorizations in Denmark, France, Germany, Spain and Singapore; IND filed for the U.S. NCT07100730.
Two-part trial-design flow diagram with rounded navy boxes, plus a country status list.
In compassionate use at UMC Utrecht (12 patients), MRI RANO showed SD 3/12, PR 0/12 and PD 9/12; PET RANO showed SD 3/7, PR 1/7 and PD 3/7. There was one grade 3 cerebral edema judged not likely drug-related and no grade 4 events. More than 26 patients have been treated in compassionate use across Austria, Australia, Germany, Netherlands, New Zealand and the USA.
Results table of RANO responses beside safety highlights.
Dose escalation of 3, 4 and 5 GBq for 2 cycles alongside standard of care in 12 patients. The MTD of 5 GBq x2 was achieved with no DLTs, and enrollment is complete, supporting Phase 2. NCT05450744.
Dose-escalation diagram with rounded navy boxes and a results summary panel.
Section divider for the renal cancer session presented by Dr. David N. Cade.
Blue gradient left panel with logo, title and speaker; circular portrait on the right behind a curved white arc.
Kidney cancer is the 14th most common cancer worldwide, with highest rates in North America and Europe, and is twice as common in men. About 90% is RCC, around 85% of which is ccRCC. Age-standardized incidence and mortality are shown by region.
Key facts on the left with a regional incidence and mortality bar chart on the right.
CAIX is a transmembrane glycoprotein induced by hypoxia and VHL mutation. It is expressed in more than 95% of ccRCC and is negligible in normal kidney.
Mechanism diagram of CAIX induction on the right with key facts on the left.
Girentuximab is a chimeric IgG1 antibody specific to CAIX, with safety data in about 500 patients. 89Zr (half-life 3.3 days) is the imaging payload for TLX250-Px, and 177Lu (half-life 6.7 days) is the therapy payload for TLX250-Tx.
Antibody diagram in the center with imaging and therapy payload cards on either side.
ZIRCON (Lancet Oncology 2024, n=284) showed sensitivity 86% and specificity 87%. For lesions of 4 cm or smaller (n=145), sensitivity was 85% and specificity 90%; for 2 cm or smaller (n=20), 97% and 97%. Inter-reader Fleiss kappa was 91% and intra-reader 100%, with favorable safety.
Results table of performance by lesion size with reader-agreement callouts.
LUTEON (Phase 3, Australia) and LUTEON-ATLAS (Phase 2a, US/EU) enroll advanced ccRCC patients after 2-3 prior lines who are CAIX-positive by PET. A safety lead-in is followed by Part 1 dose optimization (1,887 MBq vs 1,258 MBq regimens, 20 per arm) and Part 2 Phase 3 of 177Lu-TLX250 versus investigator's choice 1:1. NCT07197580.
Multi-stage trial-design flow diagram with rounded navy boxes and arrows.
Section divider for the TLX591-Tx session presented by Dr. David N. Cade.
Blue gradient left panel with logo, title and speaker; circular portrait on the right behind a curved white arc.
Compares androgen pathway modulator (APM) sensitive and resistant prostate cancer: prognosis of 4-5+ years versus about 2-3 years, with differences in biology and clinical implications.
Two-column comparison table with navy header and rows for prognosis, biology and clinical implications.
TLX597-Tx (next-generation small molecule): renal excretion, one third the kidney dose and one fifth the salivary dose of PSMA-617, 3-7 doses of 230 mCi, for mAPMN/S. TLX591-Tx (first-in-class rADC): liver excretion, rPFS of 8.8 months in ProstACT SELECT, 2 doses of 76 mCi, for mAPMR.
Two-column comparison table of TLX597-Tx versus TLX591-Tx across attributes.
A patient-friendly 2-dose, 2-week regimen with low salivary and kidney radiation, internalization and prolonged retention, and a lower administered activity of 76 mCi.
Benefit list on the left with a mechanism-of-action illustration on the right.
Part 1 (safety and dosimetry, n=30: 76 mCi x2 plus abiraterone, enzalutamide or docetaxel, n=10 each) is complete, with FDA alignment to advance to Part 2 in the U.S. Part 2 randomizes 2:1 (n approx. 490) TLX591-Tx plus SoC versus SoC, with rPFS by BICR as primary endpoint, in mAPMR patients progressing on a first ARPI. Enrolling globally, with Japan approved for Part 1. NCT06520345.
Two-part trial-design flow diagram with rounded navy boxes and arrows.
An 83-year-old with bony metastases. SPECT biodistribution over 15 days shows uptake first in vascular and liver regions, then in metastatic sites. Stable disease at day 341 (data cutoff).
Series of grayscale SPECT images across timepoints with a case summary panel.
A 64-year-old with lymph node metastases had stable disease for 339 days.
Grayscale scan images with a case summary panel.
A 62-year-old with prior darolutamide and docetaxel had stable disease and remained on study at 337 days.
Grayscale scan images with a case summary panel.
Section divider for the TLX597-Tx session presented by Prof. Louise Emmett.
Blue gradient left panel with logo, title and speaker; circular portrait on the right behind a curved white arc.
A small-molecule PSMA ligand with high tumor uptake and retention, low salivary and kidney uptake, and potential for dose intensification.
Key attribute list beside a mechanism-of-action infographic.
Dosimetry in Gy/GBq for TLX597-Tx (n=12) vs PSMA-617 (n=297) vs PSMA-I&T (n=153): kidneys 0.28 vs 0.58 vs 0.71; lacrimals 0.35 vs 1.58 vs 2.83; submandibular 0.25 vs 0.74 vs 0.64; bone lesions 9.74 vs 3.57 vs 4.1; soft tissue lesions 9.57 vs 4.19 vs 2.94. SPECT images shown at 5 and 120 hours.
Three-way comparison table with highlighted TLX597-Tx column and SPECT images alongside.
The first 3 doses are given within 15 days at 8.5 GBq per dose versus 7.5 GBq. PSMA up-regulation is seen by Day 3 (SUVmean 5.7 to 7.9, SUVmax 25 to 74, TTV 2,379 to 3,977 mL).
Dosing schedule graphic on the left with PSMA up-regulation images and figures on the right.
Investigator-initiated trial (PI Prof Emmett), n=120 randomized 2:1: dose-intensified TLX597-Tx (n=80; 8.5 GBq on Day 1, 3 and 15, then weeks 10, 20 and 30) versus standard (n=40; 7.5 GBq every 6 weeks x6) in confirmed mAPMR post-ARPI. Primary endpoint is PSA90 response rate; secondary endpoints include PSA50, PSA-PFS, rPFS, OS, ORR, QoL, safety and dosimetry.
Trial-design flow diagram with two treatment arms and endpoint boxes.
A 71-year-old with diffuse bone metastases after two chemotherapy lines and ARPI. PSA fell from 1,380 to 40 at week 10 (97% PSA response) with normal kidney function (eGFR about 90), shown with a Hb/PLT table.
PSMA PET images and PSA chart with a lab table.
A patient with extensive bone marrow involvement. PSA fell from 487 to 1.9 at week 20 (99% response), Hb improved from 81 to 106, and eGFR was 77-85.
PSMA PET images and PSA chart with a lab values panel.
Adaptive PSMA RLT in mHSPC with continuous ADT plus ARPI: 3 doses in 6 weeks, then doses every 8 weeks (8.5 GBq). Primary endpoint is PSA below 0.2 ng/mL at 6 months, with PSMA PET at weeks 12, 24 and 44.
Treatment schedule diagram with rounded navy boxes and imaging timepoints.
Serial PSMA-PET images from Day 0 ARPI to 3 months show PSA falling from 5.7 to 0.08 and SUVmean from 6.9 to 0, with a treatment pause (EANM 2026).
Row of serial PSMA-PET images across timepoints with a PSA summary.
Section divider for the prostate cancer portfolio session presented by Dr. David N. Cade.
Blue gradient left panel with logo, title and speaker; circular portrait on the right behind a curved white arc.
Disease-state curve from mAPMN/S through 1L, 2L and 3L+ mAPMR, mapped to TLX597-Tx (OPTIMAL-e, Phase 2a in mAPMN/S), TLX591-Tx (ProstACT Global Phase 3, post 1 ARPI), TLX592-Tx (alphaPRO) and TLX090-Tx (Solace, palliative).
Disease-progression curve with product bars positioned beneath the stage each addresses.
Section divider for the financial overview presented by Darren Smith, CFO.
Blue gradient left panel with logo, title and speaker; circular portrait on the right behind a curved white arc.
2026 revenue guidance of US$950-970M, Precision Medicine gross margin of 65% (H1 2026), net profit after tax of US$38M (H1 2026) and cash of US$252M (June 30, 2026). Three pillars: commercial scale, strategic optionality and vertical integration.
Row of large KPI figures on top with three pillar cards below.
Group revenue (US$M): 2022 107, 2023 333 (+211%), 2024 517 (+55%), 2025 804 (+56%), and 2026F 950-970 (about 20% growth), with TMS third-party revenue shown within the stacked bars.
Stacked bar chart by year with growth percentage callouts.
Four priorities around a central circle: commercial investments, R&D investments, supply resilience, and strategic growth opportunities (M&A) and lifecycle management. Capital is prioritized for measurable milestones and high-value inflections.
Four quadrants arranged around a central circle with a summary statement.
R&D spend against revenue: FY2023 US$85M of 333M (26%), FY2024 128M of 517M (25%), FY2025 171M of 804M (21%), and FY2026 guidance of 240-260M of 950-970M (about 26%). Telix runs at about 26% R&D to revenue versus a peer average of 35%.
Bar chart of R&D versus revenue by year on the left and a peer comparison bar chart on the right.
ITM revenue was US$198M (2024A), US$273M (2025A) and about US$300M (2026E), at EUR/USD 1.14. Adjusted EBITDA of -US$12M in 1H26 is expected to rise to about US$50M via cost savings, manufacturing growth, Telix synergies and ITM-11. Manufacturing gross margin exceeds 40%, positive EBITDA contribution begins in 2027, and $50M of synergies are targeted in the first two years.
Revenue bar chart on the left with an EBITDA bridge and driver list on the right.
Section divider for the closing remarks presented by Dr. Christian Behrenbruch.
Blue gradient left panel with logo, title and speaker; circular portrait on the right behind a curved white arc.
About US$1B FY2026E revenue and other income (guidance of US$950-970M plus US$40M of other income), 3 FDA-approved imaging agents, 22 countries and 4 therapeutic candidates in late-stage trials. Pillars are scaling the commercial business, late-stage pipeline and best-in-class manufacturing, summed up as 'A global radiopharma powerhouse'.
Row of headline stats above three pillar cards and a closing statement banner.
Illustrative revenue bridge from about US$1B in 2026 to 2027 through Illuccix/Gozellix, Pixclara, Zircaix, BiPASS (potential launch late 2027 or 2028), ex-U.S. sales across 22+ countries, TMS revenues and ITM-11. Key 2027 readouts: TLX591-Tx futility analysis, TLX597-Tx OPTIMAL-PSMA, TLX090-Tx (Part A) and BiPASS. No FY2027 guidance is implied.
Waterfall-style revenue bridge chart with a key readouts panel and a guidance disclaimer.
Common questions about this slide and the underlying presentation content.
It is the Telix Pharmaceuticals Capital Markets Day 2026 deck, presented on 4 November 2026 in Melbourne and lodged with the ASX. Telix is dual-listed on the ASX (ASX: TLX) and NASDAQ (NASDAQ: TLX), with its global headquarters in Melbourne, Australia.
No. Telix reports on a calendar-year basis, so FY2026 is January to December 2026. This differs from the July-June fiscal year many ASX-listed companies use. For example, H1 2026 results were released on 20 August 2026 and cash is stated as of 30 June 2026.
Figures are in US dollars. FY2026 revenue guidance is US$950-970M (A$1.36-1.39B), H1 2026 net profit after tax was US$38M and cash was US$252M at 30 June 2026. Group revenue was US$107M in 2022, US$333M in 2023, US$517M in 2024 and US$804M in 2025. The Precision Medicine gross margin was 65% in H1 2026.
Telix has four late-stage therapeutic candidates: TLX591-Tx and TLX597-Tx in prostate cancer, TLX101-Tx in glioblastoma and TLX250-Tx in kidney cancer, alongside three FDA-approved imaging products (Illuccix, Gozellix and Pixclara). The pending acquisition of ITM (Isotope Technologies Munich), the world's largest Lu-177 supplier, is expected to close in FY2026 subject to Telix shareholder approval, regulatory approvals and customary conditions.
Yes, the deck is available as a PDF download on this page, and the slide images are shown on the page for browsing. A PowerPoint (PPTX) version is not provided.
It works well as a structural reference for a capital markets day or biotech investor presentation: multi-speaker section dividers, KPI overview slides, market-sizing tables, pipeline charts, trial-design diagrams, case studies and financial bridges. Use it to study the pacing and layout, then build your own slides with your company's content.
Telix management presented: Dr. Christian Behrenbruch (Managing Director and Group CEO), Darren Smith (Group CFO) and Dr. David N. Cade (Group Chief Medical Officer). Four independent key opinion leaders, paid fair market value, also spoke: Prof. Munir Ghesani, Dr. Philip Dundee, Prof. Louise Emmett and Prof. Andrew Scott.
Yes. Page 2 is a full forward-looking statement and disclaimer covering risk factors, regulatory filings and non-IFRS measures such as Adjusted EBITDA. It also notes that Zircaix and Pixlumi are investigational, and the deck states that no FY2027 guidance is implied.

Create Your Own Slides
Turn your ideas into professional presentations in seconds with 2slides AI.
Reference professional designs, choose your style, and generate slides with perfect text rendering. Powered by Nano Banana—start creating your presentation now.
Your AI Agent for slides. Save time, shine faster with intelligent presentation creation.


© 2026 2slides. All rights reserved.