
Part of Investor presentation examples · Indian investor presentation examples
Tata Motors Passenger Vehicles Q2 FY27 Earnings Presentation — the 45-page investor deck of Tata Motors Passenger Vehicles Ltd (NSE: TMPV, BSE: 500570; formerly Tata Motors Ltd) for the quarter ended September 30, 2026, covering consolidated results, Jaguar Land Rover (JLR), and the India passenger and electric vehicle business, plus detailed financial annexes.
Uses this deck’s cover as a style reference for slides made from your own content. Or pick any page below to use its layout as the reference.
Quick Navigation
Tags
Share the slides
Tata Motors Passenger Vehicles Q2 FY27 Earnings Presentation — the 45-page investor deck of Tata Motors Passenger Vehicles Ltd (NSE: TMPV, BSE: 500570; formerly Tata Motors Ltd) for the quarter ended September 30, 2026, covering consolidated results, Jaguar Land Rover (JLR), and the India passenger and electric vehicle business, plus detailed financial annexes.
Detailed view of each slide page, including layout, key content and visual elements.
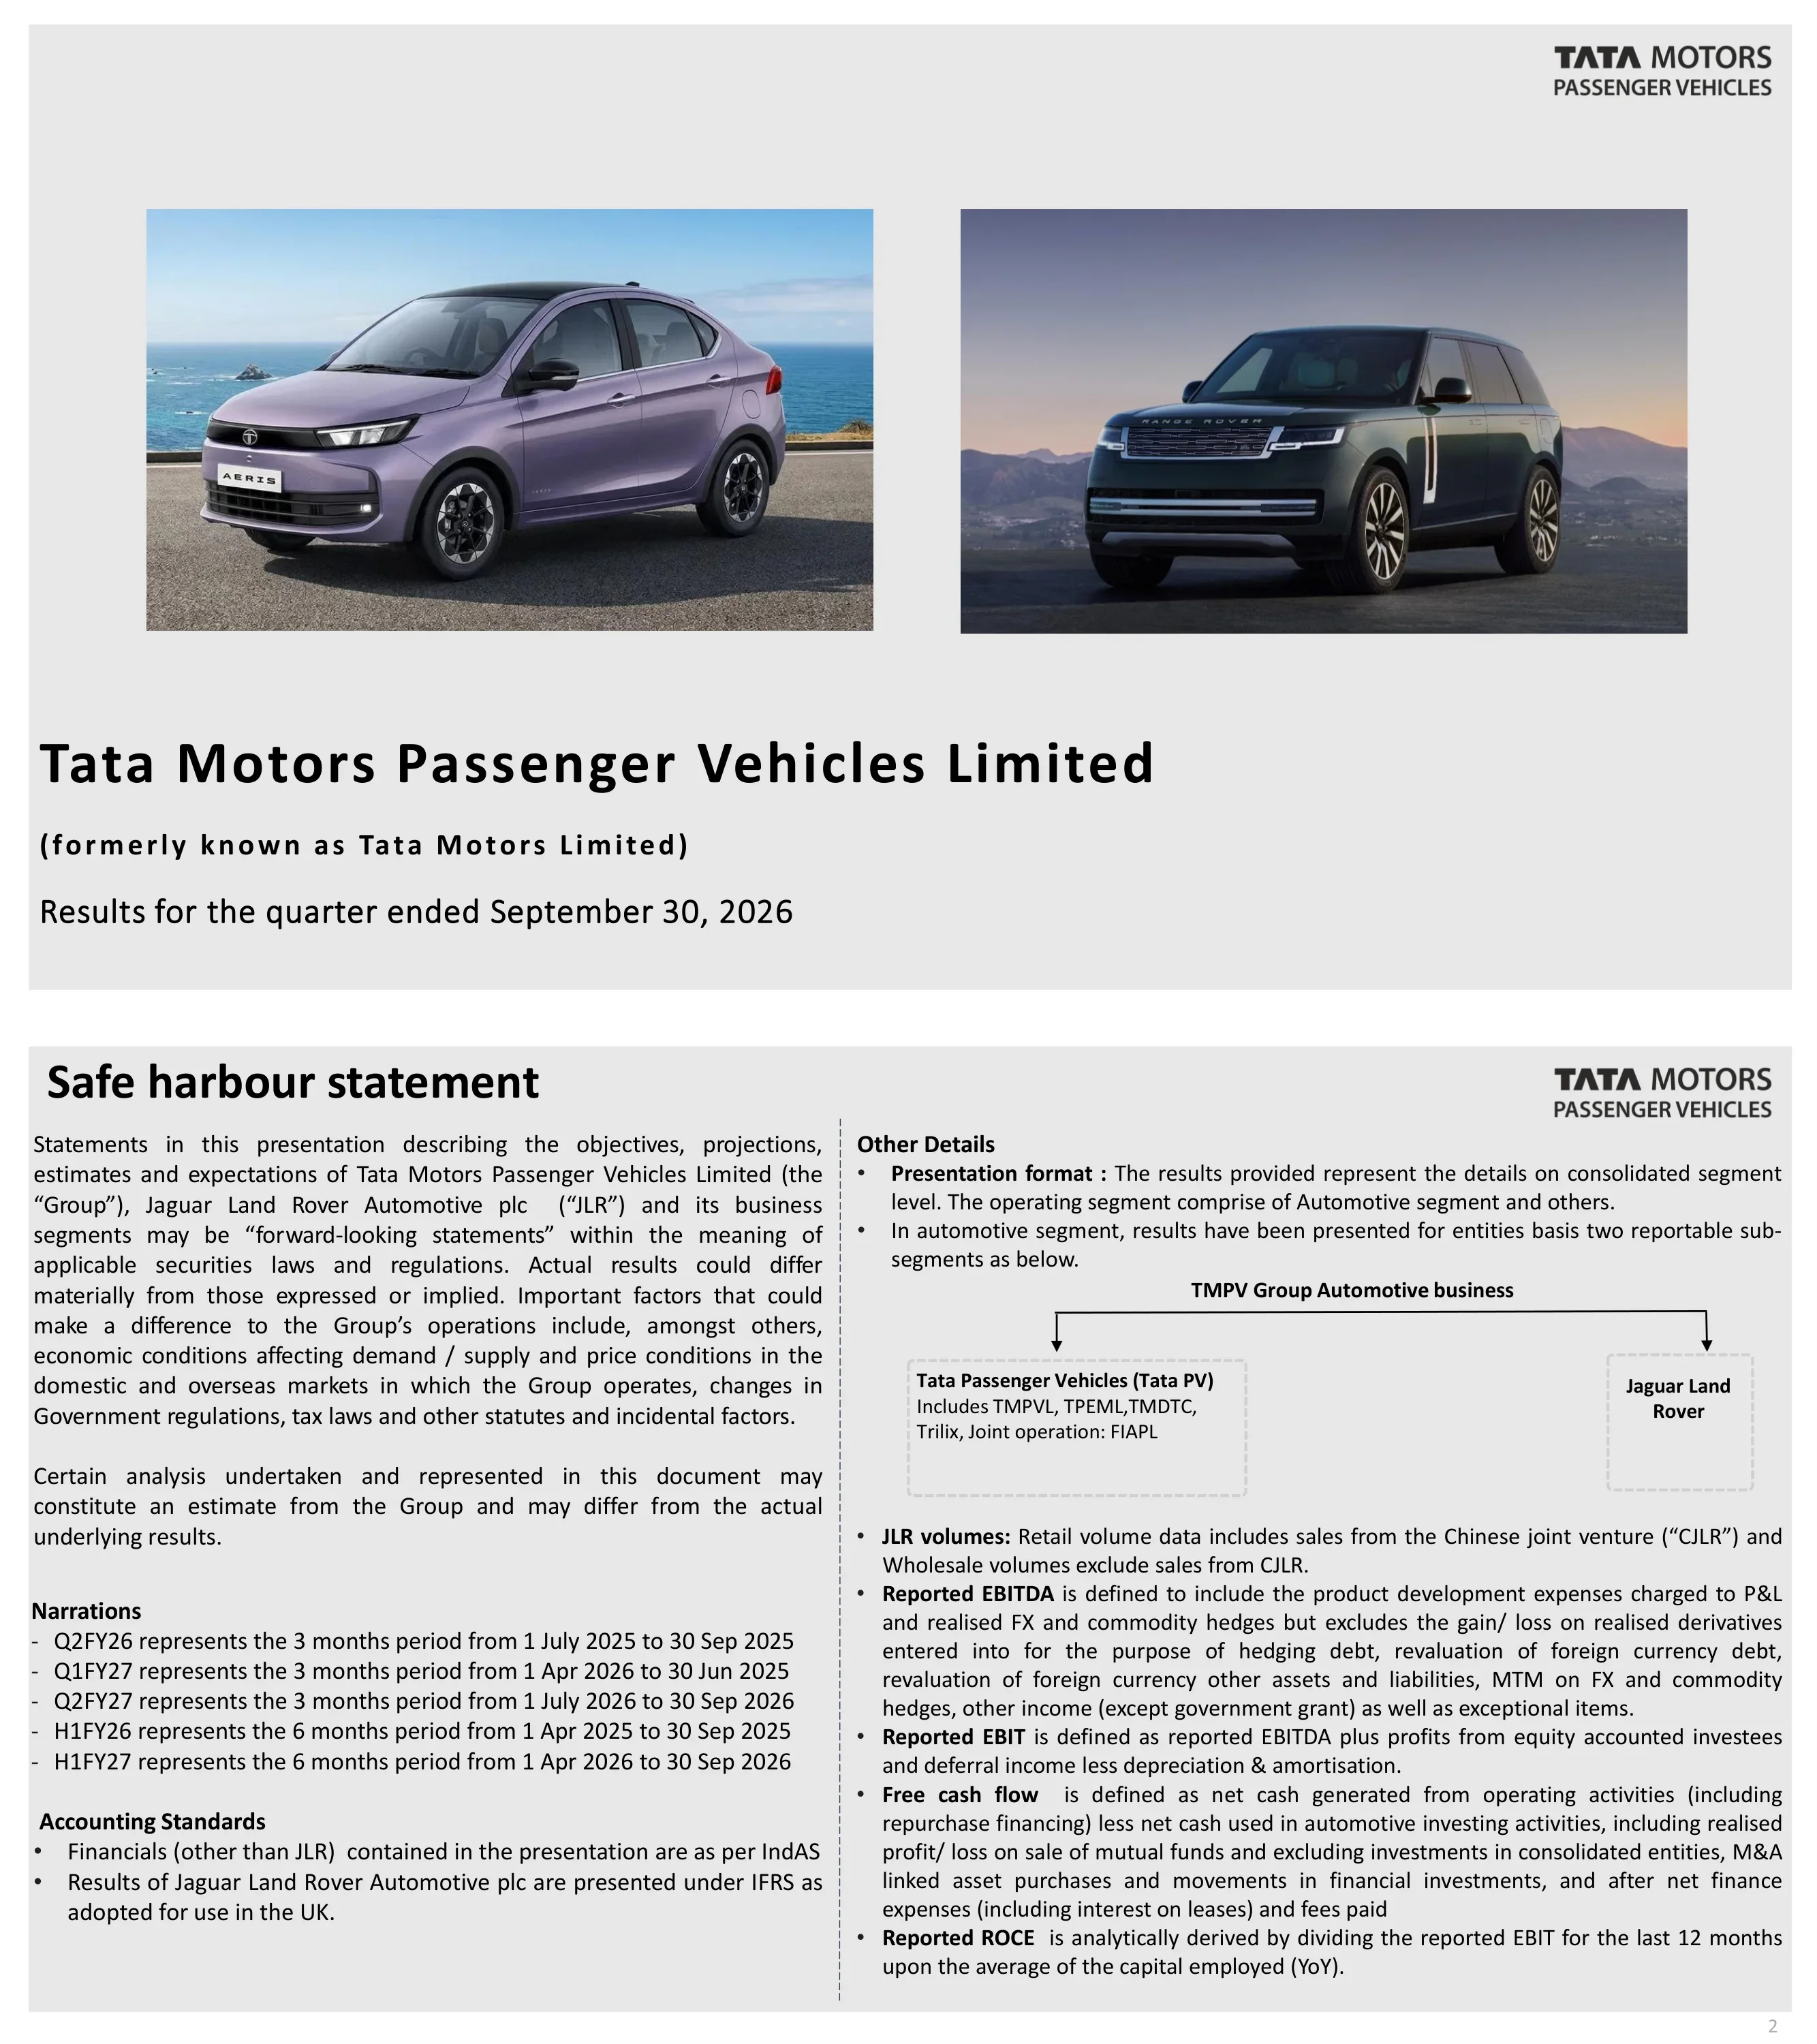
Cover slide for Tata Motors Passenger Vehicles Limited (formerly known as Tata Motors Limited), titled 'Results for the quarter ended September 30, 2026'.
Light grey slide with two side-by-side photos above a left-aligned title block, logo at top right.
Forward-looking-statement disclaimer for the Group (Tata Motors Passenger Vehicles Limited) and Jaguar Land Rover Automotive plc, plus narrations defining Q2FY26, Q1FY27, Q2FY27, H1FY26 and H1FY27 periods. States that financials other than JLR follow IndAS while JLR is presented under IFRS as adopted in the UK, and defines reported EBITDA, EBIT, free cash flow and ROCE.
Two-column text slide with a dashed divider; left column holds disclaimer, narrations and accounting standards; right column holds definitions and a small entity diagram.
Highlights: unveiled TATA.CARS as a new consumer-facing global brand identity, launched Aeris compact sedan in India, and registered record sales of 75.4K vehicles in Oct'26. Three new luxury electric vehicles launched in Q2: Range Rover Electric, Range Rover Sport Electric and Jaguar Type 01.
Six-image grid in two rows of three with captions beneath each image and a centred sub-heading for the bottom row.
Consolidated Q2 FY27 (IndAS, ₹K Cr): revenue 96.9 vs 72.3 in Q2 FY26 (up 34.0% YoY), EBITDA margin 6.2%, EBIT 1.1%, PBT before exceptional items 0.4 and net debt 50.8. H1 revenue is 192.7 vs 160.0 (up 20.4%), H1 EBITDA 6.8%, H1 PBT(bei) 2.0 and wholesales of 545.6K units vs 422.7K.
Eight-panel KPI grid: top row Q2, bottom row H1, four columns (Revenue, EBIT %, PBT(bei), FCF/net debt), each with a small bar chart and YoY delta banner.
Revenue bridge from 72.3 to 96.9 (₹K Cr): volume and mix 17.5 (24.2%), price 0.3 (0.5%), translation 5.5 (7.5%), others 1.3 (1.8%), a 34.0% increase. PBT(bei) moves from (5,462) to 403 (₹ Cr) with JLR contributing 5,835, PV (131) and Others 161. Net debt is 50.8 (external debt 41.5, lease 9.3), split by entity as PV (7.9), JLR 53.0, TML Holdings 6.0 and Others (0.3). The subtitle says net debt is likely to peak in FY27.
Four dashed panels: revenue waterfall, PBT waterfall, stacked net debt chart, and an entity net debt table.
Section opener for Jaguar Land Rover Automotive PLC, results for the quarter ended September 30, 2026, presented by Richard Molyneux, Chief Financial Officer.
Large hero photo centred above a title row; presenter name and title right-aligned, JLR logo top right.
JLR Q2 FY27 (IFRS, £m): revenue 5,894 vs 4,900 (up 20.3% YoY), adjusted EBIT margin 1.1% vs (8.6)%, PBT(bei) 6 vs (485), PAT (451), free cash flow (540) vs (791), wholesales 82.5K units, ROCE 4.2. YTD revenue is 11,867 vs 11,504 (up 3.2%), adjusted EBIT 2.0%, PBT(bei) 115 and net debt (1,538).
Same eight-panel grid as the group KPI slide: Q2 row above YTD row, four metric columns with bar charts and delta banners.
Q2 wholesales were 82.5k (up 24.7% YoY, up 4.0% QoQ) and retails 79.0k (down 7.5% YoY, down 1.1% QoQ); revenue £5.9bn. Adjusted EBIT margin was 1.1% (2.0% for H1); PBT(bei) £6m for Q2 and £115m for H1. Free cash flow was negative £540m; cash £1.8bn and total liquidity £6.0bn including £1.7bn undrawn RCF, £1.5bn undrawn UKEF facility and a new £1.0bn syndicated term loan signed on 29 September 2026.
Left text column in three headed blocks (Volume & Revenue, Profitability, Cash Flow) with a tall photo on the right.
JLR wholesales by brand (000s), Q2 FY26 / Q1 FY27 / Q2 FY27: Range Rover 38.8 / 44.7 / 45.1, Defender 21.3 / 29.2 / 30.0, Discovery 4.6 / 4.6 / 6.7, Jaguar 1.5 / 0.8 / 0.8, total 66.2 / 79.3 / 82.5. YTD total is 161.8 vs 153.5. Powertrain mix of retails in Q2 FY27 is 15% BEV and PHEV, 72% MHEV and 13% ICE.
Four brand column charts plus a total column and a stacked powertrain-mix column, with Q2 on the top row and YTD below.
JLR wholesales by region (000s), Q2 FY26 / Q1 FY27 / Q2 FY27: North America 17.9 / 27.2 / 27.1, UK 12.3 / 16.3 / 21.0, Europe 10.5 / 12.5 / 13.2, Overseas 10.9 / 9.5 / 11.3, China 11.4 / 8.7 / 6.1, MENA 3.2 / 5.1 / 3.7. YTD FY27 vs FY26: North America 54.4 vs 45.1, UK 37.3 vs 29.6, China 14.8 vs 23.1.
Six regional column charts across, Q2 row on top and YTD row below, with a footnote at the bottom.
PBT(bei) bridge (£m) from Q1 FY27 109 to Q2 FY27 6: volume and mix (77), net pricing (33), contribution costs 25, structural costs (0), FX and commodities (18). Sub-items include volume and mix (107) and other 30, warranty 30, net engineering (37), FMI and selling 29, realised FX derivatives (23). Margin effects are (1.9)%, 0.5%, (0.0)% and (0.3)%.
Single full-width waterfall chart with call-out line items and an EBIT margin row under the axis.
H1 FY27 JLR cash flow (£m): PBT(bei) 115, non-cash and other 943, cash tax (106), cash profit after tax 952, total product and other investment (1,766), working capital and accruals (724), free cash flow (1,538). Free cashflow before working capital is £(814)m. Comparison rows show Q1 FY27 FCF (998) and H1 FY26 (1,549).
Full-width waterfall with a dashed box around the pre-working-capital block and comparison rows under the chart.
H1 FY27 investment (£m): capitalised engineering 932, expensed engineering 379, total engineering 1,311, capital investment 455, total investment 1,766, compared with 1,692 in H1 FY26. The subtitle states a revised investment target of circa £3.4bn this year, delivering savings of around £300m against plan.
Single stacked-build chart with five columns and an H1 FY26 comparison row below.
Section divider reading 'Business Update, Jaguar Land Rover Automotive PLC' over a night-time aerial photo of the Jaguar Type 01.
Full-bleed framed photo with title text overlaid at top left.
Five headed boxes: China (intensifying competition and export growth), EV transition (adoption varies by market; Middle East conflict affecting oil prices starting to accelerate BEV transition), Regulation (emissions and safety standards increasing), Geopolitical uncertainty (tariffs, conflicts, rules of origin such as 'Made in Europe') and Resilience (supply chain, software stacks, cyber disruption).
Row of five equal outlined text boxes with spaced-caps headers above a wide interior photo banner.
Local brands' share of China's PV market rose from 41% (2021) to 64% (2025) and 70% in Q3 2026; China exports rise from 5.8m to ~9.5m in 2026 (2026 forecast). JLR imported and local volumes fell from 95K in FY22 to 58K in FY26 (35K imported, 23K local); CJLR local production ceased in June 2026. JLR's China reset: pivot to purely high-value luxury imports, value-over-volume, right-sized dealer network and bespoke commissions for ultra-high-net-worth customers.
Four quadrants: market share stacked bars, export column chart, JLR volume stacked bars and a bulleted reset plan.
JLR's four focus areas: double digit revenue growth (Range Rover, Defender, Discovery, Jaguar), 300K breakeven (Enterprise Missions: launch excellence, ex-works, warranty, cost efficiencies, underpinned by process excellence, aiming to return break-even volumes towards 300K in 2 years), a resilient business model, and our people.
2x2 grid with spaced-caps headers and orange rules; each cell holds an image or diagram.
Subtitle: c. 4,300 orders taken collectively to date, cars to reach showrooms from December. Collage of press quotes for Range Rover Electric (e.g. Top Gear 'Range Rover. Better Than Ever') and Range Rover Sport Electric (e.g. Autocar, evo, Auto Express reviews, including a £110k price mention).
Two photo-collage halves, one per model, each with overlaid review quotes and publication logos.
Subtitle: c. 370,000 web configurations since reveal of the Jaguar Type 01. Press quotes from carwow, GQ, Autocar India, The Independent, carsguide and CAR praise the design and the new Jaguar Electric Architecture.
Irregular photo mosaic of Type 01 images with overlaid quotes and publication logos.
Five levers: micro-market growth, portfolio optimisation, smooth supply, quality and service, customer experience. Proof points: 20% YoY wholesale volume growth in H1 FY27, #5 for JLR in J.D. Power IQS 2026 (up from #11 in 2025), #1 for Defender in J.D. Power APEAL 2026 midsize Premium SUV, and Jaguar Type 01 premiered in New York. North America's first Bespoke studio is planned for CY27.
Left thumbnails, centre rows with bold lever name and bullets, right column of five tan KPI boxes.
Cash breakeven volumes (K) FY22-FY26: 330, 300, 300, 345, 425, with FY27 shown as a forecast against a 300k line; reasons for the rise are tariffs, decline in higher margin China mix, competitive intensity and ageing products, and appreciating currency with rising fixed costs. Enterprise Missions target £1.7bn of savings over two years versus FY26: ex-works £625m value delivery, warranty £625m reduction, cost efficiencies £450m reduction.
Left: breakeven bar chart and four coloured reason tiles. Right: three text columns above stacked bars of FY27, FY28 and pipeline benefits.
JLR FY27 updated outlook versus FY26 actual: revenue c. £25bn (FY26 £23bn), EBIT margin c. 2-3% (0.7%), free cash flow c. £(1.25)bn (£(2.2)bn). Banner: targeting double digit EBITDA and positive free cash flow in FY28.
Three-row guidance table at left, two interior detail photos at right and bottom, full-width grey banner.
Section opener for Tata Passenger Vehicles (includes Tata PV, EV India, FIAPL JO results and International business (PV+EV)), presented by Shailesh Chandra and Dhiman Gupta.
Two photos side by side above a title row with presenter names at the right; Tata.cars logo top right.
Tata PV India business: offtake volumes (incl. IB, average monthly 000s) 67.2 in Q2 FY27 vs 48.2 in Q2 FY26 (+40% YoY) and 60.8 in Q1 FY27. Vahan domestic market share 14.3% in both Q1 and Q2 FY27 (13.6% in FY26). Powertrain mix in Q2 FY27: petrol 37%, diesel 12%, CNG 28%, EV 23%; subtitle says alternate powertrain mix over 50%.
Three equal panels: volume columns, market share columns and a stacked powertrain mix chart.
Tata Passenger Electric Vehicles: EV offtake (average monthly 000s) 15.7 in Q2 FY27 vs 8.3 a year earlier (+90% YoY) and 11.5 in Q1 FY27. Vahan EV market share 42.8% (39.0% in Q1 FY27, 40.1% in FY26), about 380 bps up QoQ. Tata's EV penetration is 24.0% vs 8.0% for industry.
Three panels: EV volume columns, market share columns and a two-line penetration chart (Industry vs Tata).
Tata Passenger Vehicles (IndAS, ₹K Cr): Q2 revenue 20.4 vs 13.5 (+51.1% YoY), EBITDA margin 4.0% (down 180 bps YoY), EBIT -0.3%, PBT(bei) 0.0, wholesales 201.6K units. H1 revenue 38.4 (+57.4%), EBITDA 4.1%, EBIT -0.4%, wholesales 383.9K. Footnote says figures include PLI of ₹125Cr, ₹313Cr and ₹516Cr for Q2 FY26, Q1 FY27 and Q2 FY27.
Eight-panel KPI grid, Q2 on top and H1 below, four metric columns.
PBT(bei) bridge (₹ Cr) from 12 in Q1 FY27 to 25 in Q2 FY27: volume and mix 106, PLI 203, pricing 161, variable cost (544), fixed cost 156, D&A (37), interest/JV/others (32). EBITDA margin walk: 4.3% to 4.0% (mix+PLI 0.2%, pricing 0.8%, variable cost -2.7%, fixed cost 1.8%, JV and others -0.4%). Marked 'for analytical purposes only'.
Two stacked waterfalls: a boxed PBT bridge at top right and an EBITDA margin walk across the bottom.
Domestic business H1 FY27 (IndAS, ₹ Cr): capitalised R&D 1,008, expensed R&D 454, total R&D 1,462, capital and other investment 1,668, total investment spending 3,130, versus 3,338 in H1 FY26 (R&D 1,848, capital 1,490). Includes TMPVL, TPEML and the FIAPL joint operation.
One dashed-frame build chart with a comparison row below.
Domestic business H1 FY27 (₹ Cr): PBT(bei) 402, non-cash and others 1,605, tax 248, cash profit after tax 2,255, investment spend (3,130), working capital changes 2,729, finance expenses (net) and dividend 91, free cash flow 1,945. Working capital detail: payables and acceptances ₹3,716 Cr, trade receivables ₹52 Cr, inventories ₹1,298 Cr, others ₹363 Cr.
Full-width waterfall with a dashed highlight box and a working capital call-out.
PV industry highlights: 1.4mn units in Q2 with 29% YoY growth, CNG and EV penetration at 33%+ of sales, record EV industry volumes with 70% YoY growth, and commodity and EV supply constraints as challenges. TMPV highlights: record 200k+ units (+40% YoY), #2 position with 14.3% share, Punch #1 model in India in Q2, 50%+ greener powertrain penetration and 90% YoY EV growth with 380bps QoQ EV share gain.
Two-column bullet slide (PV Industry Highlights vs TMPV Highlights) split by a dashed vertical line.
Four launches with proof points: Sierra and Sierra.ev (new nameplate, 70k units since Jan'26), Punch and Punch.ev (facelift, #1 SUV since launch in Jan'26; #1 EV model in Oct '26 with 5k+ units), Tiago and Tiago.ev (facelift, 35%+ volume growth QoQ) and Aeris (new nameplate, 4k units in first month).
Four horizontal rows separated by dashed lines: vehicle image left, bullets centre, big KPI right.
Industry outlook: sustained demand in H2 with growth moderating on a high base, and commodity pressures likely to remain adverse in Q3. TMPV focus areas: build growth momentum, capitalise on EV penetration, scale up production including supplier EV capacity, and strengthen profitability through calibrated pricing, cost reductions and expedited PLI accruals.
Left text column with two underlined headings; two stacked vehicle photos on the right.
Outlook: geopolitical volatility, luxury demand trends, pace of EV adoption and commodity costs remain key monitorables; both businesses remain fundamentally strong. Key priorities for JLR (EV launches, North America, enterprise missions), Domestic business (scale production, EV leadership, commodity mitigation) and Consolidated (differentiated strategies, strategic partnerships, Tata Group synergies).
Top outlook bullets, then a three-column table (JLR, Domestic business, Consolidated).
Closing slide inviting questions in the Q&A textbox with name and organisation; reads 'Q&A session' and 'Thank you'.
Same two-photo layout as the cover with large headings and instruction text below.
Annex divider: 'Tata Motors Passenger Vehicles Group : Additional details, Results for the period ended September 30, 2026'.
Mostly blank grey slide with a centred left-aligned title and subtitle.
Consolidated P&L by segment (Rs Cr, IndAS), Q2 FY27: revenue from operations JLR 75,420, Tata PV 20,423, Others 1,077, consolidated 96,920. EBITDA 5,995 (JLR 5,047, PV 822), EBIT 1,061, PBT(bei) 403 (JLR 57, PV 26, Others 320). EBITDA margin 6.2% and EBIT margin 1.1% consolidated; Tata PV EBITDA 4.0% and EBIT -0.3%.
Wide financial table with four value columns and navy highlighted subtotal rows, footnote on Others.
Prior-year Q2 FY26 segment P&L (Rs Cr): consolidated revenue 72,349 (JLR 57,877, PV 13,529, Others 943), EBITDA (71), EBIT (4,897), PBT(bei) (5,462). EBITDA margin (0.1)% and EBIT margin (6.8)% consolidated; Tata PV EBITDA 5.8%.
Same table format as page 36 for comparison.
H1 FY27 segment P&L (Rs Cr): consolidated revenue 192,719 (JLR 152,125, PV 38,353, Others 2,241), EBITDA 13,123, EBIT 3,333, PBT(bei) 2,009. EBITDA margin 6.80% and EBIT margin 1.70% consolidated; JLR 7.40% and 2.00%; Tata PV 4.10% and -0.40%.
Same table format, with negatives shown with minus signs.
H1 FY26 segment P&L (Rs Cr): consolidated revenue 160,025 (JLR 133,829, PV 24,406, Others 1,790), EBITDA 7,546, EBIT (2,017), PBT(bei) (1,512). EBITDA margin 4.7% and EBIT margin -1.3% consolidated.
Same table format as pages 36 to 38.
JLR income statement (IFRS, £m) for Q2 FY26, Q1 FY27, Q2 FY27, FY26 YTD, FY27 YTD with YoY and QoQ. Q2 FY27: revenues 5,894, adjusted EBIT 67, profit before tax and exceptional items 6, exceptional items (530), profit before tax (524), income tax 73, profit after tax (451). YTD FY27 revenue 11,867 and adjusted EBIT 234.
Multi-column table with navy highlighted rows for revenues, adjusted EBIT, PBT and PAT.
China JV (IFRS, £m): Q2 FY27 retail volumes 1.9K units (7.4K in Q2 FY26), wholesale 1.0K, revenue 153 (221), profit before tax (38), profit after tax (29), EBITDA margin (7)% and EBIT margin (25)%. FY27 YTD revenue 322 and PBT (43).
Banded table with alternating navy and light rows and YoY/QoQ columns.
JLR retails by brand (000s), Q2 FY26 / Q1 FY27 / Q2 FY27: Range Rover 47.2 / 46.8 / 43.4, Defender 25.4 / 26.7 / 29.5, Discovery 5.9 / 5.0 / 5.4, Jaguar 6.9 / 1.4 / 0.8, total 85.4 / 79.9 / 79.0. YTD total 158.9 vs 179.8. Powertrain mix same as the wholesale slide (15% BEV and PHEV, 72% MHEV, 13% ICE in Q2 FY27). Footnotes note FY26 restatement after the cyber incident.
Same chart layout as page 9, but for retails.
JLR retails by region (000s), Q2 FY26 / Q1 FY27 / Q2 FY27: North America 22.9 / 24.4 / 24.8, UK 14.2 / 15.7 / 18.5, Europe 13.9 / 14.2 / 12.7, Overseas 11.1 / 9.1 / 10.5, China 18.0 / 13.1 / 7.2, MENA 5.3 / 3.4 / 5.3. YTD FY27 China 20.2 vs 35.2 in FY26.
Six regional bar charts, Q2 row above YTD row.
JLR FX and commodity bridge (£m): operational exchange 26, realised FX hedges (78), FX impact on EBIT (53), FX revaluation of net debt and debt hedges 19, other FX revaluation 29, FX impact on PBT (5), unrealised commodity hedges (18), total FX and commodity impact on PBT (22). Hedge reserve 192 in Q2 FY27 (1,026 in Q2 FY26); total hedges 21,332. Rates: GBP:USD 1.327, GBP:EUR 1.169, GBP:CNY 8.898.
Waterfall on top, with a hedge table at bottom left and an FX rates table at bottom right.
JLR (IFRS, £m): total liquidity £6,002m (cash 1,842, undrawn loan facility 1,000, undrawn UKEF 1,500, undrawn RCF 1,660) and total debt £6,035m, with maturity bars from CY26 to CY32; £500m was drawn on 15 October and another £500m on 28 October 2026. TML Holdings: liquidity 139, total debt 621. TMPVL domestic business (₹ Cr): liquidity 10,963 and total debt 3,110. Footnotes on facilities not fully legible at this resolution.
Left dashed panel with JLR maturity chart; right panel split into TML Holdings (£m) and TMPVL Domestic Business (₹ Cr) charts.
Common questions about this slide and the underlying presentation content.
It covers the quarter ended September 30, 2026, and also shows H1 FY27 (six months to September 30, 2026). India's fiscal year runs April to March, so Q2 FY27 means July to September 2026; the deck's own narration defines Q2FY27 as 1 July 2026 to 30 Sep 2026 and H1FY27 as 1 April 2026 to 30 Sep 2026.
Consolidated Q2 FY27 revenue was ₹96.9K Cr (Indian rupees, thousand crore), up 34.0% YoY, with EBITDA margin of 6.2%, EBIT margin of 1.1%, PBT before exceptional items of ₹0.4K Cr and net debt of ₹50.8K Cr. JLR (Jaguar Land Rover) reported revenue of £5.9bn (British pounds), adjusted EBIT margin 1.1%, and Tata Passenger Vehicles posted revenue of ₹20.4K Cr with 4.0% EBITDA margin.
It was filed with the BSE and NSE as an Investor Presentation announcement by Tata Motors Passenger Vehicles Ltd (NSE: TMPV, BSE: 500570). The exchange cover letter has been removed from this 45-page version.
The deck covers the group (safe harbour, key highlights, consolidated results and net debt on pages 1-5), Jaguar Land Rover (pages 6-22: performance, brands, regions, bridges, cash flow, investment, external environment, focus areas, product launches, North America, breakeven and outlook), Tata Passenger and Electric Vehicles in India (pages 23-34) and annex tables (pages 35-45).
The deck is 45 pages. The annex has segment P&L tables for Q2 and H1 of FY27 and FY26 (in Rs Cr, IndAS), the JLR income statement, China JV performance, JLR retail volumes by brand and region, an FX and hedging bridge and a debt profile.
The outlook page shows FY27 updated guidance of c. £25bn revenue, c. 2-3% EBIT margin and c. £(1.25)bn free cash flow, against FY26 actual of £23bn, 0.7% and £(2.2)bn. JLR is targeting double digit EBITDA and positive free cash flow in FY28.
Tata's EV offtake averaged 15.7 thousand units per month in Q2 FY27 (+90% YoY), Vahan EV market share was 42.8% and Tata's EV penetration was 24.0% versus 8.0% for the industry. EVs were 23% of the Tata PV powertrain mix.
Yes. The page-by-page layouts, including KPI dashboards, waterfall bridges, regional charts and annex tables, make a useful structural reference for building your own earnings or investor deck. The content belongs to the company and should be used as a design and structure reference, not republished as your own.

Create Your Own Slides
Turn your ideas into professional presentations in seconds with 2slides AI.
Reference professional designs, choose your style, and generate slides with perfect text rendering. Powered by Nano Banana—start creating your presentation now.
Your AI Agent for slides. Save time, shine faster with intelligent presentation creation.


© 2026 2slides. All rights reserved.