
Part of Investor presentation examples
Taiwan Mobile Q3 2026 Earnings Presentation — Taiwan Mobile Co., Ltd.'s (TWSE: 3045) "3Q26 Results Summary" investor deck dated November 12, 2026, covering telecom, enterprise ICT, momo e-commerce, consolidated financials (revenue of NT$50.37bn, NT$ (New Taiwan dollars) billions as the deck's unit) and the completed Systex tender offer.
Uses this deck’s cover as a style reference for slides made from your own content. Or pick any page below to use its layout as the reference.
Quick Navigation
Tags
Share the slides
Taiwan Mobile Q3 2026 Earnings Presentation — Taiwan Mobile Co., Ltd.'s (TWSE: 3045) "3Q26 Results Summary" investor deck dated November 12, 2026, covering telecom, enterprise ICT, momo e-commerce, consolidated financials (revenue of NT$50.37bn, NT$ (New Taiwan dollars) billions as the deck's unit) and the completed Systex tender offer.
Detailed view of each slide page, including layout, key content and visual elements.
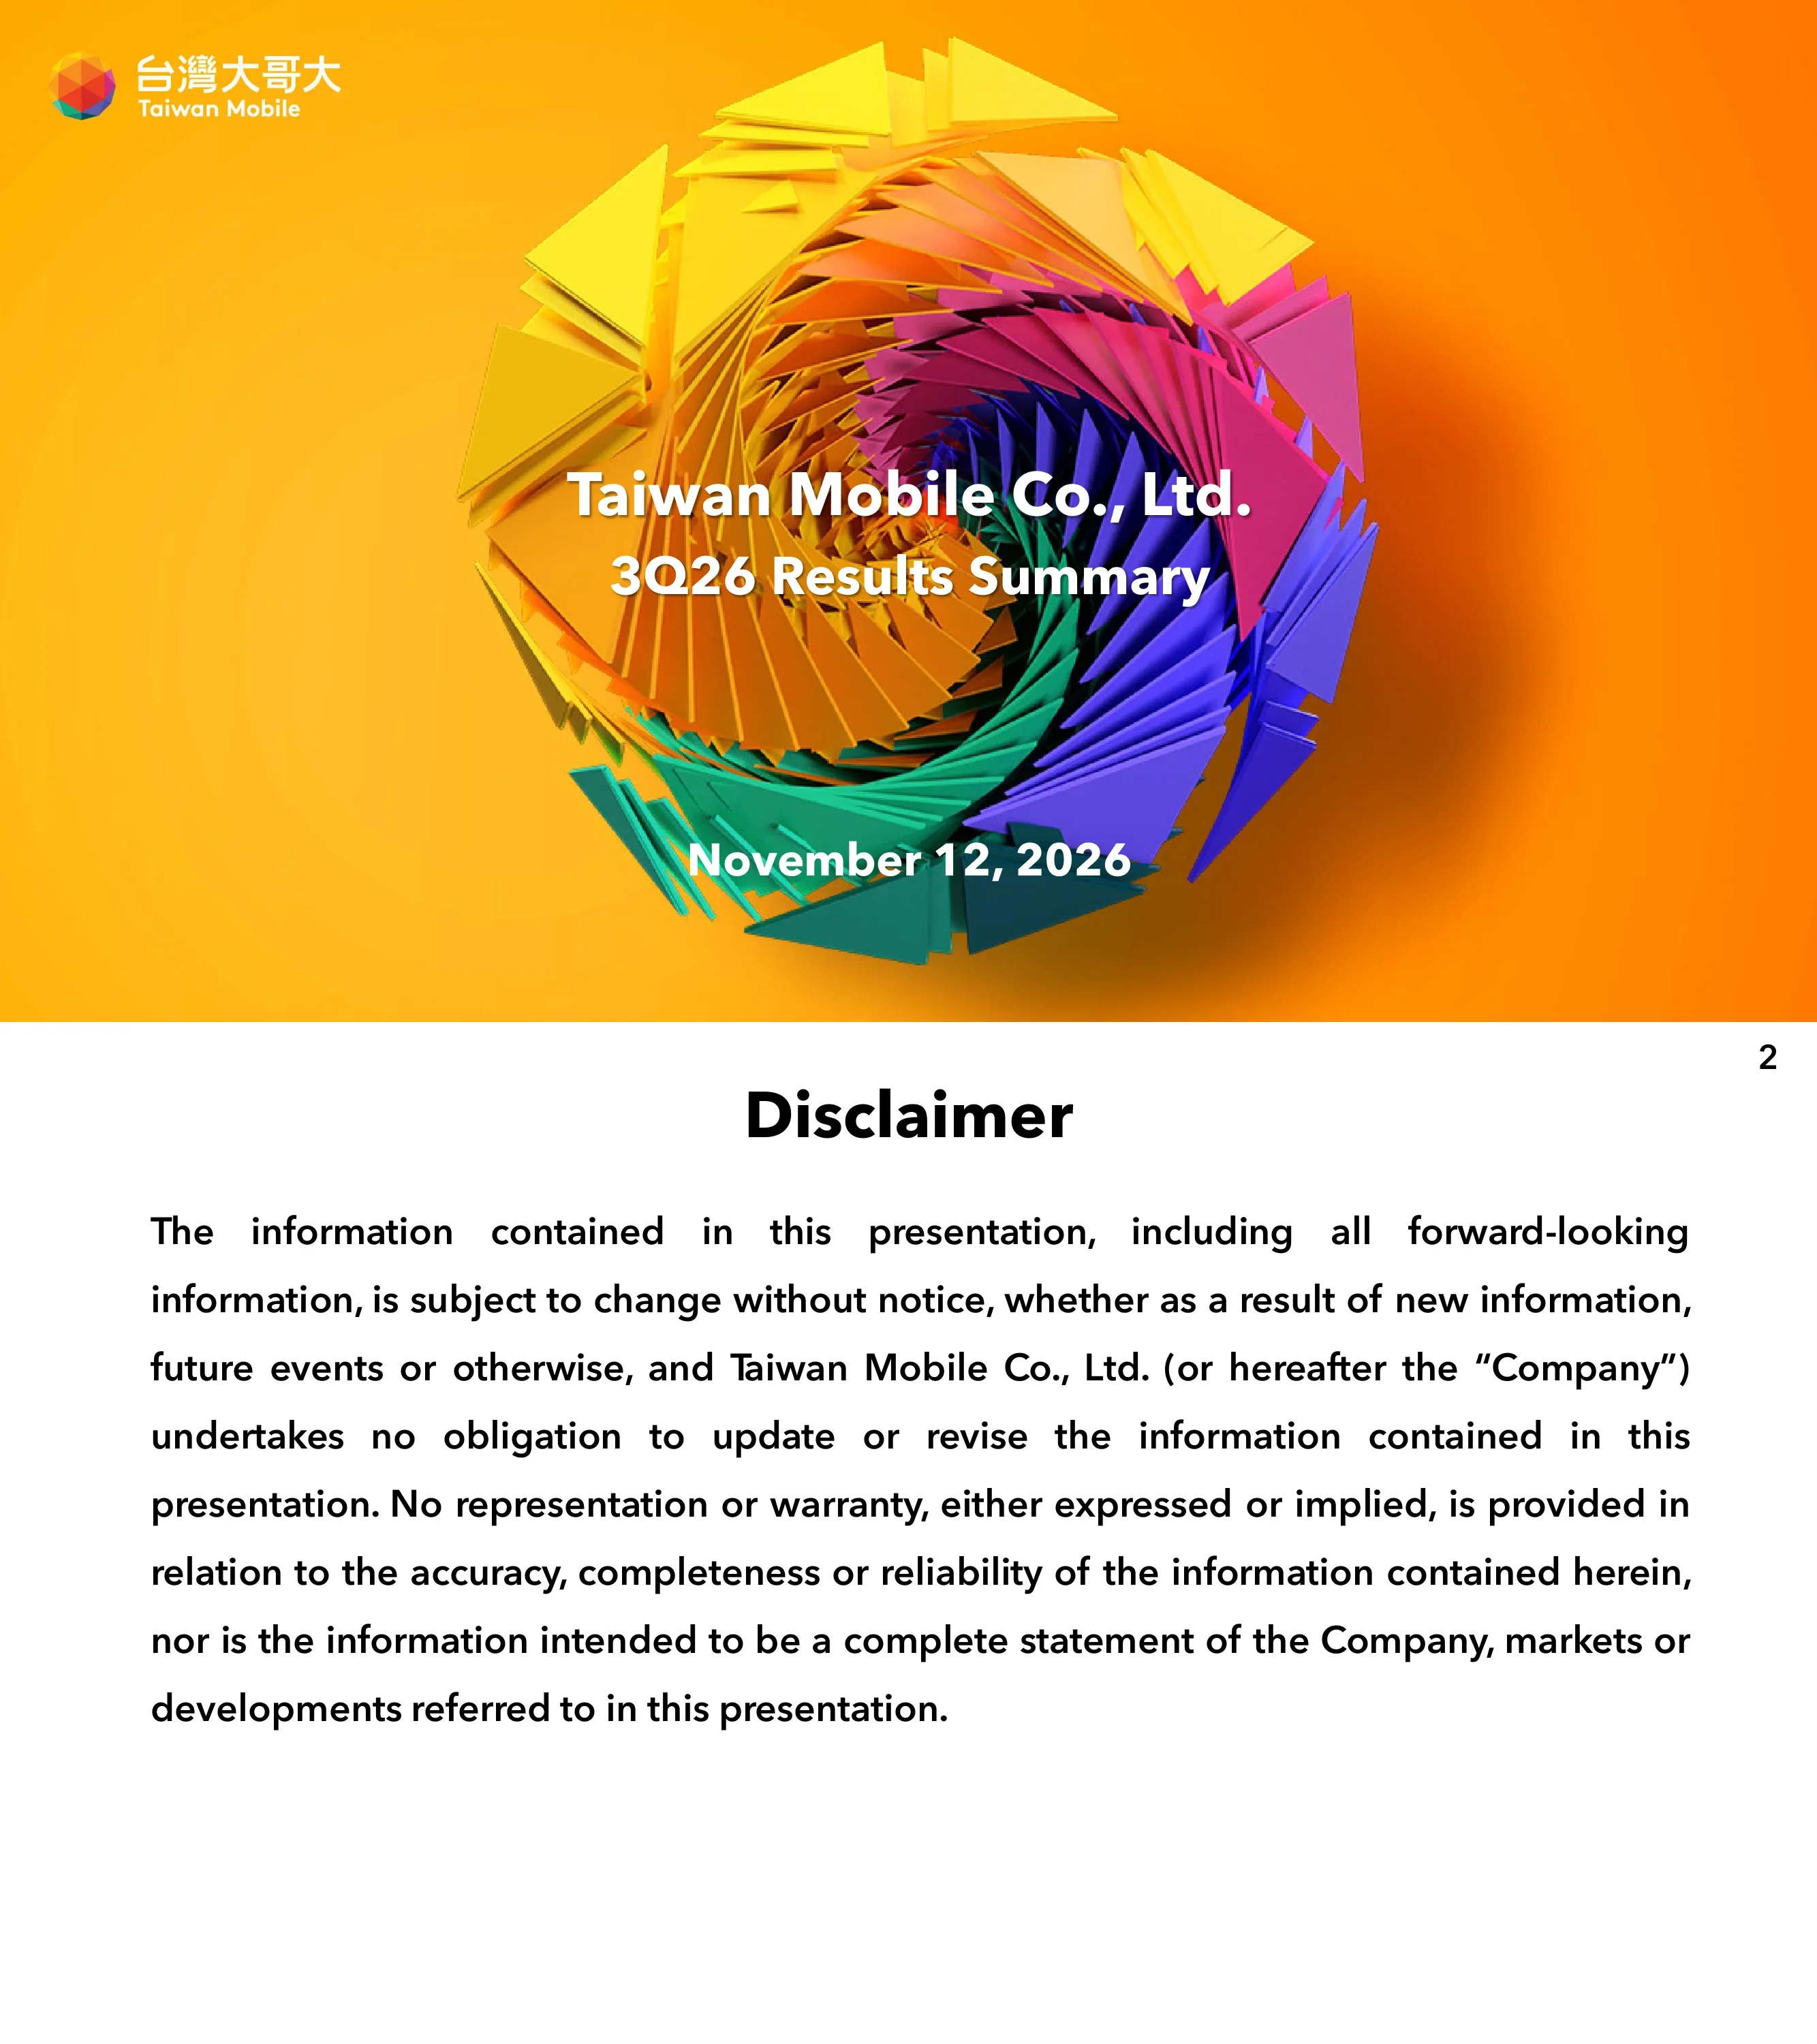
Title slide for Taiwan Mobile Co., Ltd. reading "3Q26 Results Summary" with the date November 12, 2026. The Taiwan Mobile logo and Chinese name appear at top left.
Full-bleed orange background with a large 3D spiral of colorful triangles at center; white title text centered over the artwork and the date near the bottom; logo top left.
Standard forward-looking statement disclaimer: information in the presentation is subject to change without notice, the Company undertakes no obligation to update it, and no representation or warranty is given on accuracy, completeness or reliability.
White slide with a centered bold heading and a single justified paragraph of text; page number top right.
Section divider introducing the Business Overview part of the deck. No figures on this page.
Orange-to-red horizontal gradient background with the title in large white text at center and the logo mark at top left.
Three tiers are shown with YoY growth: Telco+Tech businesses +7% (new Telco+Tech businesses ex-momo +14%), Enterprise business (Telco+) +34%, and Mobile & Home businesses (Telco Core) +8%. Consolidated revenue is $50.37bn (+9% YoY), consolidated EBIT $5.89bn (+15%) and net income $4.26bn (+18%).
Top panel with a stacked three-ellipse flywheel graphic linked by lines to labels and growth rates; bottom gray band with three KPI columns for revenue, EBIT and net income.
Smartphone ARPU rises across 3Q25 to 3Q26 (678, 687, 687, 689, 697; +3% YoY). Postpaid churn falls from 0.60% to 0.48%, a record low. 5G penetration of the smartphone user base goes from 43% to 46%. Monthly fee uplift from renewals is +47% for 4G to 5G and +6% overall. Non-bundle mobile service revenue grows from NT$16.60bn to a record NT$17.05bn (+3% YoY), with 5G share rising from 67% to 70%. Home business revenue grows from NT$1,481mn to NT$1,686mn (+14% YoY): broadband 614 to 641 (+5%) and pay-TV and others 867 to 1,045.
Six-panel dashboard grid (3 top, 3 bottom) mixing a line chart, arrow comparisons and stacked bar charts; a small Telco Core flywheel marker at top right.
Six enterprise businesses with YoY growth: Data Center (incl. AIDC) +140% revenue, AICT for Enterprise +284%, Cybersecurity Services +53%, IoT +23%, OPBiz +37% subscribers, and TAmedia (business SMS plus mobile ads) +10% revenue.
Two-row, three-column grid of pill-shaped labels, each with an icon on the left and a large blue growth figure on the right; Telco+ marker top right.
Four Telco+Tech businesses are shown as cards: DCB (Direct Carrier Billing), EC Services for Brands (+86% revenue YoY), Game Publishing, and OTT & Content with MyVideo (+26% revenue YoY). Partner and brand logos are displayed; no growth figures are given for DCB or Game Publishing.
Four staggered white cards with soft shadows, each holding logos or icons; growth figures sit beneath the second and fourth cards; Telco+Tech marker top right.
momo EC GMV (1P+3P) grew +11% YoY in 3Q26 and active users +5% YoY. Revenues rose from NT$24,556mn to NT$26,297mn (+7% YoY). Take rate was 13.8% in both 3Q25 and 3Q26, and EBIT margin moved from 2.6% to 2.7%. Emerging growth drivers: mo-shop+ (3P) with double-digit YoY 3P GMV growth and more than 4.3mn 3P SKUs, and momo Ads with double-digit YoY ads revenue growth.
Magenta-accented dashboard: left column with two icon KPIs, center bar chart for revenue, right line chart for profitability, and a lower band with a pill header and two outlined boxes for emerging growth drivers.
Section divider introducing the Financial Overview part of the deck. No figures on this page.
Orange-to-red gradient background with centered large white title and logo mark at top left.
3Q26 revenue in NT$bn: Telecom 23.71, CATV 1.69, momo 26.30, total 50.37 (47%, 3%, 52% of total). EBIT: Telecom 4.52, CATV 0.59, momo 0.72, total 5.89 (77%, 10%, 12%). Revenue YoY: 11%, 14%, 7%, total 9%; EBIT YoY: 17%, 3%, 11%, total 15%. 2Q26 YoY revenue: 4%, 14%, 4%, total 4%; EBIT: 25%, -3%, 3%, total 18%. A footnote says segments do not sum to the consolidated total because of other revenue and inter-company eliminations.
Single wide table with an orange header band grouping Revenue and EBIT across Telecom, CATV, momo and Total; four data rows and a footnote below.
In NT$bn, 3Q26 (QoQ, YoY): revenues 50.37 (2%, 9%); cash cost and expense (39.05) (3%, 9%); operating income 5.89 (-4%, 15%); non-operating income (expense) (0.12); pre-tax income 5.77 (-5%, 18%); net income 4.26 (-6%, 18%); EPS NT$1.40 (-6%, 18%); EBITDA 11.31 (-2%, 6%). For 1~3Q26: revenues 149.58 (+5%), operating income 17.94 (+16%), pre-tax income 17.48 (+22%), net income 12.95 (+23%), EPS NT$4.26 (+22%), EBITDA 34.17 (+8%).
Income statement table with orange header, columns for 3Q26 amount, QoQ, YoY and 1~3Q26 amount and YoY, and eight line-item rows.
At 3Q26 (NT$bn): total assets 238.74, liabilities 141.91, shareholders' equity 96.83, cash and equivalents 8.31, long-term borrowings 40.86. Ratios for 3Q26 versus 3Q25: current ratio 55% vs 64%, net debt to equity 0.74 vs 0.90, net debt to EBITDA 1.58x vs 1.88x, annualized ROE 18% vs 15%. 2Q26 is also shown as a comparison column. Footnotes define ROE and retained earnings.
Two side-by-side tables (assets and ratios on the left, liabilities and equity on the right), each with 3Q26, 2Q26 and 3Q25 columns and bold subtotal rows; footnotes at the bottom left.
In NT$bn: operating cash flow 7.56 in 3Q26 and 28.75 for 1~3Q26 (+6% YoY); investing (2.18) and (9.52) (+5%); financing (9.20) and (19.49) (-14%). Pre-IFRS 16 operating cash flow 6.31 and 25.10 (+6%); cash CAPEX (2.32) and (6.62) (-25%); free cash flow 3.98 and 18.48 (+24%). A footnote explains the IFRS 16 reclassification of lease expenses.
Two stacked tables with orange headers, each with 3Q26, 1~3Q26 and YoY columns; footnote under the lower table.
Section divider introducing the Event Updates part of the deck. No figures on this page.
Orange-to-red gradient background with centered large white title and logo mark at top left.
Taiwan Mobile's acquisition stake in Systex is 49.16%, taking its shareholding from 11.86% to 61.02%. Total consideration is NT$12.4bn in cash plus 112.4mn TWM shares; each Systex share equals NT$92.5 in cash plus 0.84 TWM common shares. Pro forma balance sheet (NT$bn, before vs post): total assets 239 to 300, liabilities 142 to 175, equity 97 to 125. 1~3Q26 net income contribution at the current 11.86% stake is NT$234mn; at the assumed 61.02% stake, pro forma contribution before interest expense is NT$1,226mn (8.8% pro forma net income contribution).
Two callout boxes at top (stake and consideration), a pro forma balance sheet table at bottom left, and two net income contribution panels at bottom right; footnotes under the table.
Taiwan Mobile ranked #1 across six key categories in Opensignal's Taiwan Mobile Network Experience Report, 1H 2026: Quality of Experience (Reliability and Consistent Quality, each flagged #1 in Taiwan), Coverage Experience (Time on Network), and Application Experience (Video, Voice App, 5G Voice App).
Header with the Opensignal logo and headline, then a 3 by 2 grid of gray tiles each with an icon and category label; laurel wreaths flank the bottom row.
Five statements: the three growth pillars deliver strong momentum and healthy operating leverage; the successful Systex tender offer is a milestone for AI-driven enterprise opportunities; the transaction is immediately accretive to EPS with only modest incremental net leverage; three synergy drivers are Cross-Selling, AI Integration and Regional Expansion; combining infrastructure with Systex's solutions expertise aims to accelerate enterprise growth and compound shareholder value.
Text-only slide with a bold title and five left-aligned paragraphs of large text; logo mark bottom right.
Closing Q&A slide with the Taiwan Mobile logo; no figures.
Full-bleed orange background with the 3D triangle spiral artwork and a small white "Q&A" label at its center; logo top left.
Common questions about this slide and the underlying presentation content.
It covers the third quarter of 2026 (3Q26) and the first nine months (1~3Q26) for Taiwan Mobile Co., Ltd. (TWSE: 3045). The cover is dated November 12, 2026 and titled "3Q26 Results Summary".
Consolidated revenue was NT$ (New Taiwan dollars) 50.37bn (+9% YoY), operating income (EBIT) NT$5.89bn (+15%), net income NT$4.26bn (+18%), EPS NT$1.40 and EBITDA NT$11.31bn. For 1~3Q26, revenue was NT$149.58bn and net income NT$12.95bn (+23%).
The English version was filed on Taiwan's Market Observation Post System (MOPS) for the company's investor conference (法說會). A Chinese version of the presentation also exists.
It has 18 pages: cover, disclaimer, Business Overview (3Q26 highlights, three growth engines for Telco Core, Telco+ and Telco+Tech, and momo), Financial Overview (performance by business, results summary, balance sheet, cash flow), Event Updates (Systex tender offer, Opensignal awards), a Key Message slide and Q&A.
The tender offer for Systex (6214.TW) is shown as completed, with a 49.16% acquisition stake that lifts Taiwan Mobile's holding from 11.86% to 61.02%. Consideration is NT$12.4bn in cash plus 112.4mn TWM shares, and the deck presents a pro forma balance sheet and net income contribution.
The deck reports smartphone ARPU of 697 in 3Q26 (+3% YoY), postpaid churn of 0.48% (a record low), 5G penetration of 46% of the smartphone base, non-bundle mobile service revenue of NT$17.05bn, and momo revenue of NT$26,297mn (+7% YoY) with EC GMV up 11%.
Yes. The 2slides gallery page lets you view the deck page by page and use it as a layout reference for building your own earnings or investor presentation. Check the download options on the page for available formats. The financial content belongs to Taiwan Mobile, so replace it with your own data.

Create Your Own Slides
Turn your ideas into professional presentations in seconds with 2slides AI.
Reference professional designs, choose your style, and generate slides with perfect text rendering. Powered by Nano Banana—start creating your presentation now.
Your AI Agent for slides. Save time, shine faster with intelligent presentation creation.


© 2026 2slides. All rights reserved.