
Part of Investor presentation examples · Japanese investor presentation examples
Taiheiyo Cement H1 FY2026 Earnings Presentation: a 41-page Japanese-language interim results deck (決算説明資料) from Taiheiyo Cement (太平洋セメント), whose original was published on TDnet (the Tokyo Stock Exchange timely disclosure system) on November 10, 2026. FY2026 is the fiscal year ending March 2027, so H1 covers April-September 2026. It reports consolidated sales of ¥469.3 billion (4,692.78億円), operating profit of ¥30.3 billion, an interim net profit of ¥36.7 billion and a full-year forecast cut to ¥63.0 billion operating profit.
Uses this deck’s cover as a style reference for slides made from your own content. Or pick any page below to use its layout as the reference.
Quick Navigation
Tags
Share the slides
Taiheiyo Cement H1 FY2026 Earnings Presentation: a 41-page Japanese-language interim results deck (決算説明資料) from Taiheiyo Cement (太平洋セメント), whose original was published on TDnet (the Tokyo Stock Exchange timely disclosure system) on November 10, 2026. FY2026 is the fiscal year ending March 2027, so H1 covers April-September 2026. It reports consolidated sales of ¥469.3 billion (4,692.78億円), operating profit of ¥30.3 billion, an interim net profit of ¥36.7 billion and a full-year forecast cut to ¥63.0 billion operating profit.
Detailed view of each slide page, including layout, key content and visual elements.
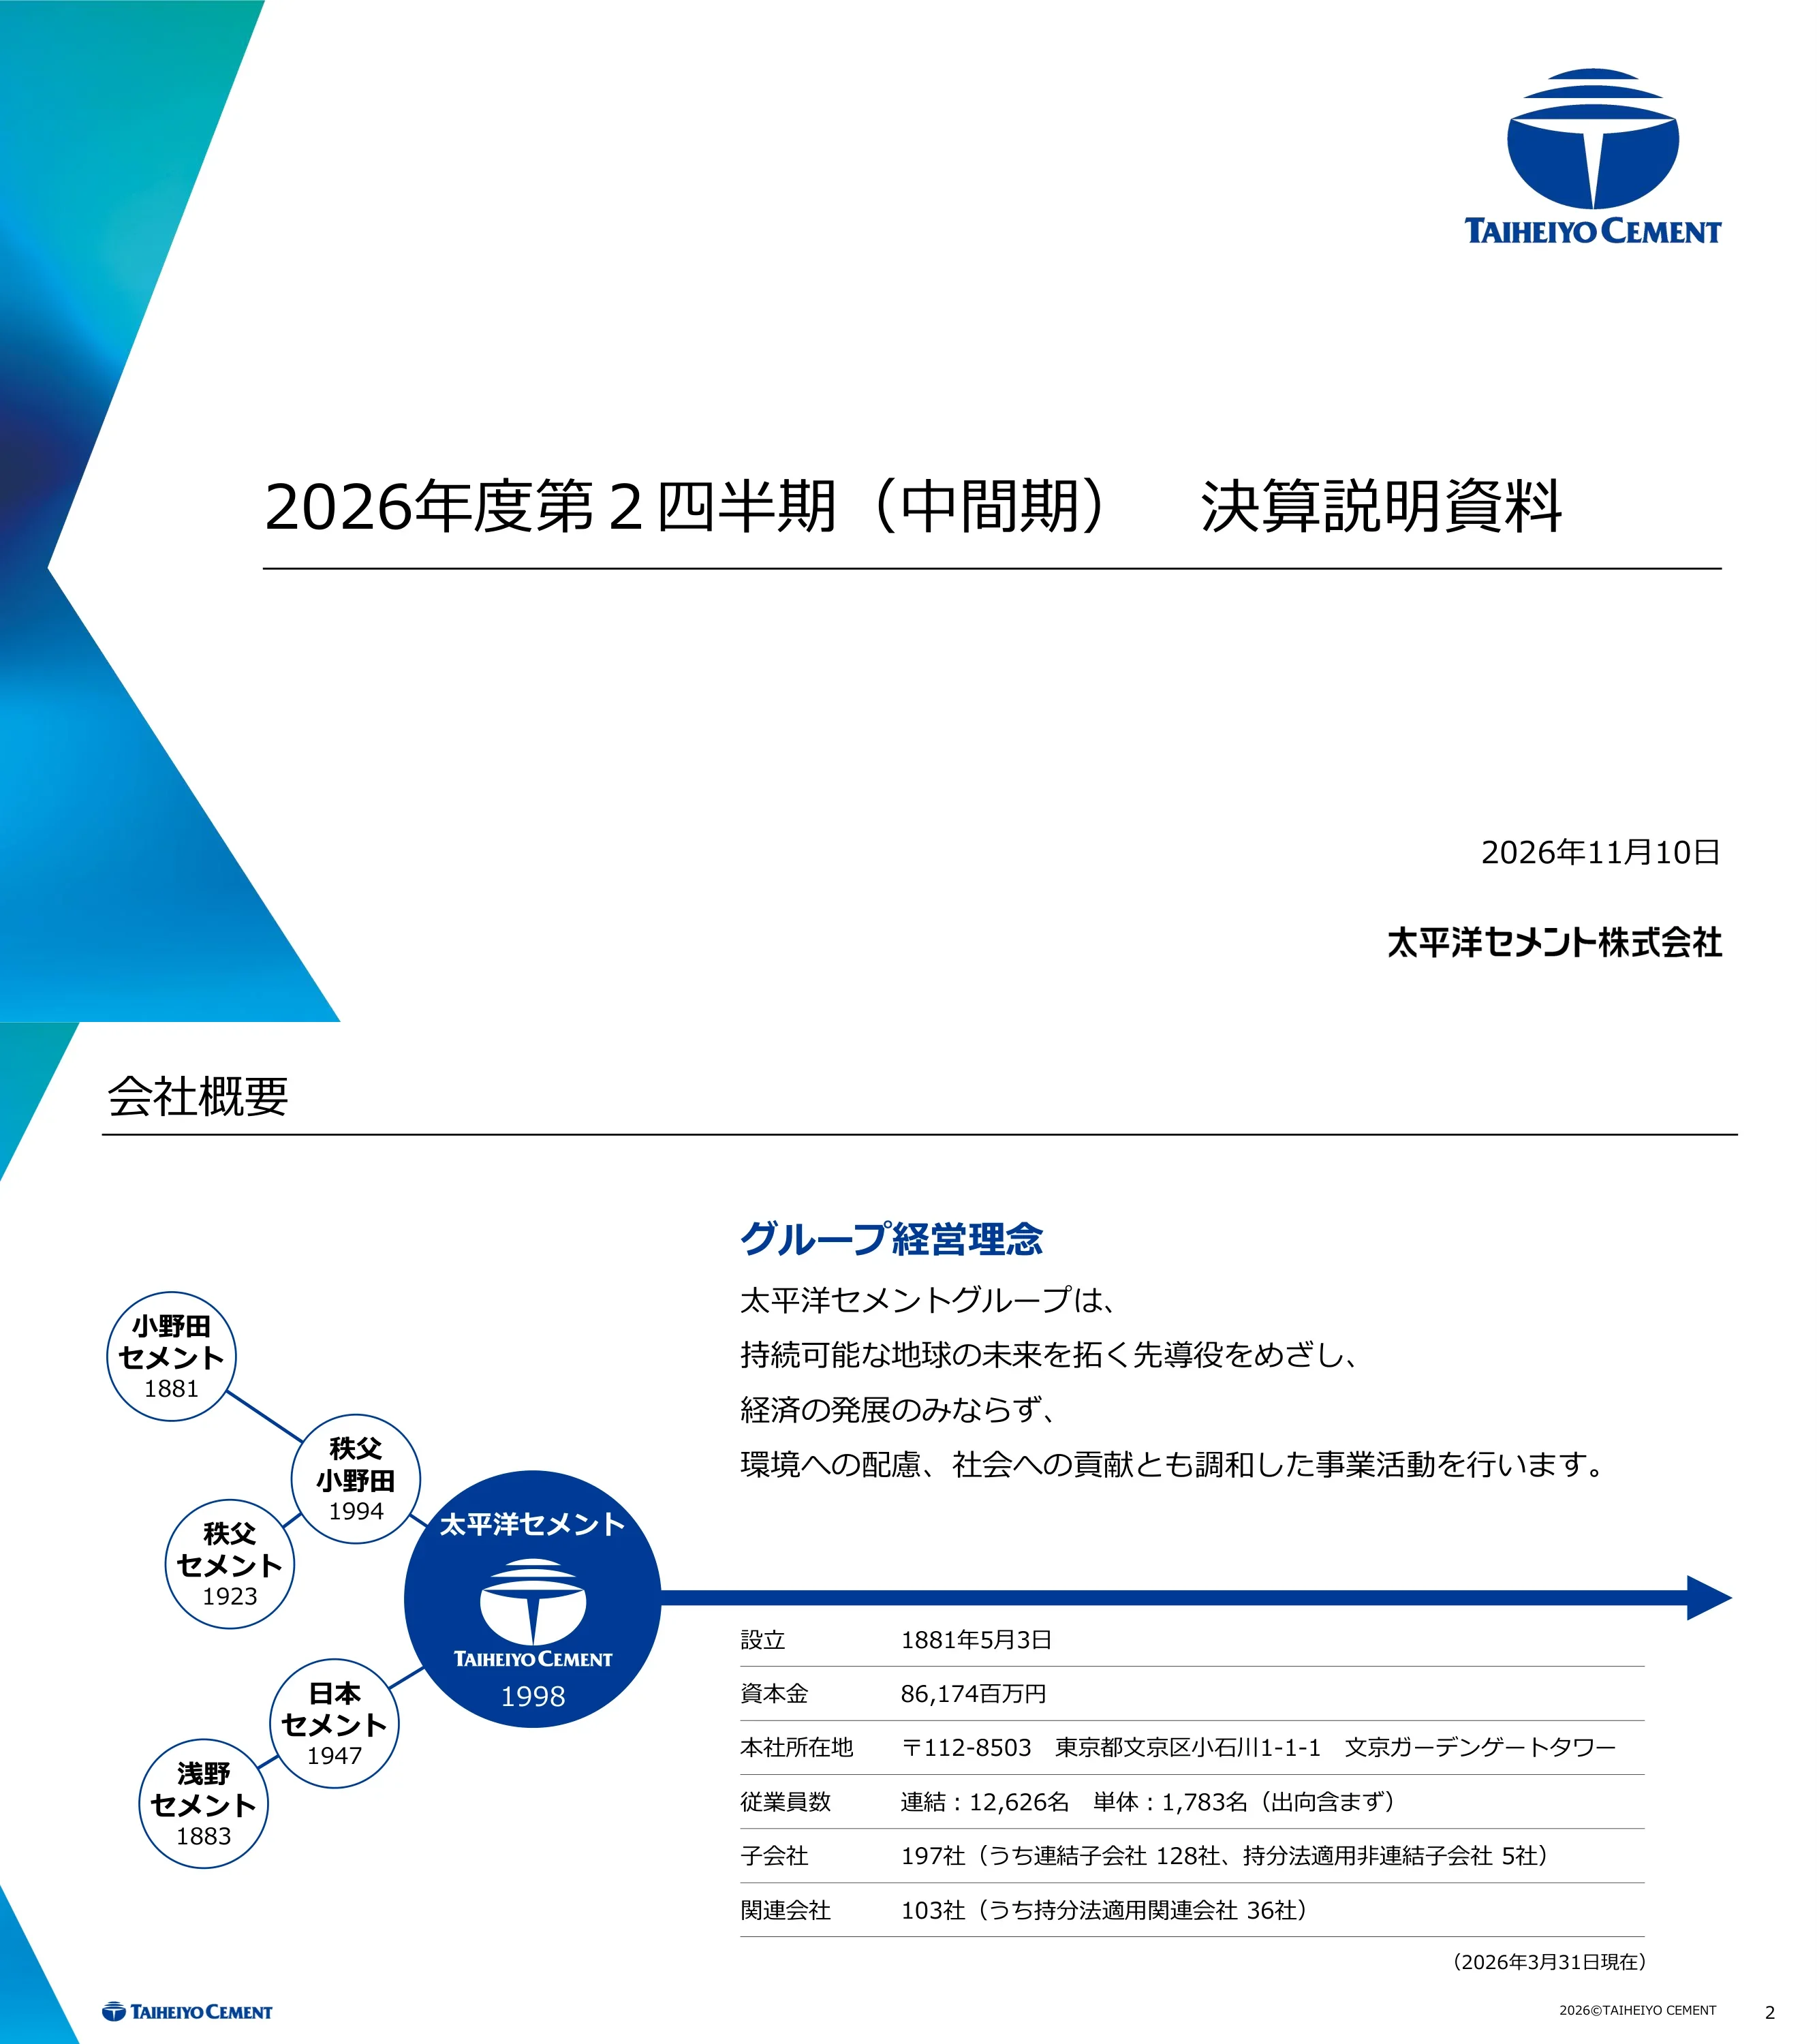
Title slide for the 2026年度第2四半期(中間期)決算説明資料, dated November 10, 2026.
Left-aligned title and date on a white background with teal-to-blue corner triangles and the company logo.
Founded May 3, 1881; capital ¥86,174 million; headquartered in Bunkyo-ku, Tokyo. Consolidated headcount 12,626 and 1,783 on a standalone basis; 197 subsidiaries and 103 affiliates as of March 31, 2026. Also shows the group philosophy and the merger lineage (Onoda Cement, Chichibu Cement, Asano Cement, Nihon Cement).
Left-hand fact table, a merger-history lineage diagram on the right and a philosophy statement at the bottom.
Sales by region: Japan ¥543,667 million (clinker capacity 16,799 thousand tons), United States ¥279,261 million (5,280 thousand tons) and Asia-Pacific ¥75,514 million (5,520 thousand tons). Maps mark cement plants, clinker grinding plants, terminals and the head office; the Japanese plant list is partly small text.
Three regional map panels (Japan, U.S., Asia-Pacific) with sales and capacity boxes and a legend of plant icons.
Agenda: 1 Consolidated highlights (p.5), 2 FY2026 Q2 results (p.8) with segments, P&L, balance sheet and cash flow, 3 FY2026 forecast (p.16), 4 Shareholder returns (p.23) and Appendix (p.25).
Numbered agenda list with page references at the right.
Section divider for the consolidated results highlights.
Mostly empty slide with a large section title and corner accents.
H1 FY2026 sales ¥469,278 million (+¥31,137 million), operating profit ¥30,318 million (-¥2,535 million), ordinary profit ¥28,726 million (-¥4,220 million) and net profit attributable to owners of the parent ¥36,748 million (+¥12,263 million, helped by gains on sale of fixed assets). Interim dividend rises to ¥60 per share from ¥50. Domestic cement profit fell on Middle East-related costs while overseas profit rose on Southeast Asia.
Three summary bullets on top and a year-on-year comparison table below, with units in ¥ million.
Average FX rate ¥158.3/$ (vs 148.4) and imported coal price $150/t (vs $135). Operating margin 6.5% (vs 7.5%), interim EPS ¥334.6 (vs 219.7), net assets per share ¥6,485.5, equity ratio 42.9% (vs 46.0% at prior year-end) and net D/E ratio 0.60x (vs 0.48x).
Two stacked tables: environmental factors on top, financial indicators below, each with prior, current and change columns.
Section divider for the FY2026 second-quarter (interim) results.
Large section title on a mostly blank slide.
H1 sales/operating profit in ¥ million: cement 349,837 / 18,659 (domestic 168,663 / 8,400; overseas subsidiaries 181,174 / 10,258), resources 46,421 / 5,511, environment 43,727 / 4,845, building materials and construction 20,876 / 151, other 40,009 / 1,316. Consolidated total 469,278 / 30,318.
Large segment table with sales and operating profit blocks, each showing prior year, current year and change.
Domestic volume fell to 5,263 thousand tons (-393) while exports rose to 1,719 (+76). Sales ¥168,663 million (+¥6,023 million) and operating profit ¥8,400 million (-¥2,889 million). Bridges show sales rising from ¥162.6 billion to ¥168.7 billion and operating profit falling from ¥11.3 billion to ¥8.4 billion, as price increases were offset by volume, variable cost and fixed cost.
Data table at top left, commentary bullets at right, two waterfall charts (sales and operating profit) below.
U.S.: cement 2,900 thousand tons, ready-mix 2,584 thousand cy, aggregates 5,700 thousand tons; sales ¥153.2 billion ($968 million) and operating profit ¥10.0 billion ($63 million, down from $82 million). Asia and other: sales ¥29.6 billion and operating profit ¥1.1 billion (vs a loss of ¥1.5 billion). Overseas sales up ¥10.4 billion and profit up ¥0.7 billion from FX effects; California ready-mix acquisition closed in early June.
Left U.S. table, right Asia table, commentary bullets below each and a footnote on FX impact.
Resources: sales ¥46,421 million, operating profit ¥5,511 million (+¥320 million). Environment: ¥43,727 million, ¥4,845 million (+¥329 million). Building materials and civil engineering: ¥20,876 million, ¥151 million (-¥765 million). Other: ¥40,009 million, ¥1,316 million (+¥213 million). Commentary covers aggregates, ALC weakness and coal-ash processing.
Four-row table with prior, current and change columns and a commentary column on the right.
Sales ¥469,278 million, operating profit ¥30,318 million, non-operating items -¥1,593 million, ordinary profit ¥28,726 million. Extraordinary items swung to +¥17,969 million (from -¥939 million); pre-tax profit ¥46,695 million, income taxes ¥8,579 million and net profit attributable to owners of the parent ¥36,748 million.
Single P&L table with prior year, current year and change columns.
Total assets rose to ¥1,650,253 million from ¥1,479,061 million (+¥171,192 million), with tangible fixed assets at ¥830,147 million and intangible assets at ¥105,106 million. Interest-bearing debt rose to ¥504,291 million (+¥114,524 million); total net assets ¥745,038 million. Period-end FX rate ¥162.4/$.
Two-sided table: assets on the left, liabilities and net assets on the right, with March and September 2026 columns.
Operating cash flow ¥47,134 million, investing cash flow -¥117,005 million, free cash flow -¥69,871 million and financing cash flow +¥83,454 million. Depreciation and goodwill amortization were ¥35,259 million.
Compact table of cash flow categories with prior, current and change columns.
Section divider for the FY2026 full-year earnings forecast.
Large section title on a mostly blank slide.
Middle East impact is assumed to last through the full year. Domestic cement expects higher sales from the Tokuyama business transfer in H2 but lower profit; overseas expects higher sales and profit. Assumptions: domestic demand 29.0 million tons (-1.53 million), coal $150/t and FX ¥158.0/$; a ¥1 weaker yen reduces operating profit by ¥0.03 billion.
Summary bullets at the top and an assumptions table below.
Forecast sales ¥1,010.0 billion (+¥111.6 billion) and operating profit ¥63.0 billion (-¥11.6 billion). Ordinary profit ¥55.5 billion, extraordinary gain ¥14.0 billion and net profit attributable to owners ¥51.0 billion (vs ¥25.4 billion). Table units are ¥100 million (億円).
Single P&L table with prior-year actual, forecast and change columns.
In ¥100 million: cement sales 7,550 / operating profit 374 (domestic 3,630 / 130; overseas 3,920 / 244), resources 950 / 105, environment 900 / 98, building materials 450 / 4, other 980 / 55. Consolidated 10,100 / 630.
Segment table with sales and operating profit blocks, each with actual, forecast and change.
Domestic volume 11,600 thousand tons (+427) including the Tokuyama transfer, exports 3,600 (+280). Sales ¥363.0 billion (+¥26.3 billion) and operating profit ¥13.0 billion (-¥15.0 billion). Defense-related works and Noto reconstruction add demand, while labor costs and Middle East costs weigh on profit.
Data table and commentary at the top, sales and operating profit waterfall charts below.
Taiheiyo acquires the cement sales business of Tokuyama through a carve-out into a new vehicle, Tokuyama Taiheiyo Co., Ltd. The Japan Fair Trade Commission notified on June 25, 2026 that it would not issue a cease-and-desist order, and the contract was signed with operations starting on October 1.
Structure diagram of the carve-out (absorption split) on the left with business boxes, plus a milestone panel.
U.S.: cement 5,898 thousand tons, ready-mix 6,034, aggregates 11,467; sales ¥333.6 billion ($2,108 million) and operating profit ¥24.4 billion ($154 million). Asia and other: cement 7,758 thousand tons, sales ¥62.5 billion and operating profit ¥1.8 billion (from a loss of ¥3.7 billion). Overseas sales effect from FX +¥20.0 billion and profit +¥1.4 billion.
Left U.S. table, right Asia table, commentary bullets and an FX footnote.
Section divider for the shareholder returns section.
Large section title on a mostly blank slide.
FY2026 annual dividend planned at ¥120 per share (up ¥20) including a ¥60 interim dividend. The 26 Medium-Term Plan policy targets a total return ratio of 33% or more, a stable dividend of at least ¥80 and flexible buybacks, with a three-year total return ratio of 43.7% expected. Charts show dividends rising from ¥70 to ¥120 over 2021 to 2026 and total dividends of ¥13.1 billion in the FY2026 forecast.
Policy summary and key bullets at the top; two bar charts (total return in ¥100 million, dividend per share in yen) below.
Section divider for the reference material (Appendix).
Large section title on a mostly blank slide.
Trend charts of interest-bearing debt (March 2022 to March 2027 forecast, plus end of September 2026 at ¥504.3 billion consolidated) and capital expenditure (FY2021 to FY2026 forecast plus H1 FY2026), each split between the parent and consolidated subsidiaries in ¥100 million. Most bar labels are small text.
Two stacked bar charts side by side, split between the company and consolidated subsidiaries, in ¥100 million.
Depreciation and R&D expense trends for FY2021 to FY2026 forecast plus H1 FY2026, split between the parent and consolidated subsidiaries. A footnote notes the depreciation method changed from declining balance to straight-line from FY2024. Individual bar values are small text.
Two stacked bar charts with year categories, in ¥100 million.
Charts show overseas subsidiary cement sales volume (10,000 tons), and U.S. sales and operating profit/EBITDA in US$ millions. U.S. sales rise to $2,108 million in the FY2026 forecast ($968 million in H1). Other values are small text.
Left bar chart for volume, right combination charts for the U.S. business over FY2021 to FY2026.
Long-run bar charts from FY2006 to FY2025 of domestic cement demand, exports and waste and by-product treatment volume (in 10,000 tons), compiled from Cement Association statistics. Domestic demand peaks near 5,899 (FY2006) and falls to 3,053 in FY2025; individual labels are small.
Full-width multi-series chart with fiscal years along the x-axis and a legend.
Plan to sell about 50% of domestic listed shareholdings (book value basis at March 2025) during the 26 Medium-Term Plan, and about 20% in the next plan. Achieved so far: part of the A&A Material stake and others, about 8% of the roughly 20% planned for the period.
Bar chart of reductions by year on the left and a text panel of plan and progress on the right.
Revised-forecast summary repeats the Middle East, Tokuyama and U.S. points. Assumptions versus the previous forecast: domestic demand unchanged at 29.0 million tons, coal $155 to $150/t and FX ¥157.0 to ¥158.0/$.
Summary bullets and an assumptions table comparing previous and current forecast.
FY2026 forecast cut: sales ¥1,027.0 billion to ¥1,010.0 billion, operating profit ¥76.0 billion to ¥63.0 billion, ordinary profit ¥70.0 billion to ¥55.5 billion and net profit attributable to owners ¥63.0 billion to ¥51.0 billion.
Single P&L table with previous forecast, current forecast and change columns, in ¥100 million.
Operating profit forecast changes (¥100 million): domestic cement 170 to 130, overseas cement 317 to 244, cement total 487 to 374, resources 106 to 105, environment 104 to 98, building materials 19 to 4, other 46 to 55; consolidated 760 to 630. Consolidated sales go from 10,270 to 10,100.
Segment table with sales and operating profit blocks comparing previous and current forecasts.
Domestic volume lowered from 11,800 to 11,600 thousand tons and exports from 3,800 to 3,600. Sales ¥368.0 billion to ¥363.0 billion; operating profit ¥17.0 billion to ¥13.0 billion. Tokuyama effects are now shown under ready-mix and other.
Table and commentary on top and two waterfall charts below, with a footnote on the reclassification.
U.S. sales revised from ¥340.3 billion to ¥333.6 billion ($2,108 million) and operating profit from ¥32.6 billion to ¥24.4 billion ($154 million). Asia and other: cement 7,758 thousand tons, sales ¥62.5 billion and operating profit ¥1.8 billion. U.S. demand recovery is expected gradually from mid-2027.
U.S. and Asia tables side by side with commentary and an FX footnote.
The cement industry's use of waste and by-products equals about 10% of domestic recycling volume. The group makes cement with a recycling rate of 40% or more using coal ash, slag, sludge and other inputs, and supplies materials for roads, bridges, dams and buildings.
Central circular flow diagram with input materials on the left and infrastructure applications on the right, closing statement at the bottom.
Roadmap with three approaches: immediate (shift to blended cement, fuel substitution), gradual (deepening existing technologies) and innovative (CO2 capture with C2SP kiln, CCU methanation and carbonation, CCS). Includes a target of cutting emissions intensity by 20% or more versus 2000. Small text is partly hard to read.
Roadmap diagram with horizontal approach bands leading to a carbon-neutral goal.
Lists ESG indices and ratings including FTSE Blossom Japan Sector Relative Index, MSCI Japan ESG Select Leaders, Dow Jones Sustainability Asia Pacific, CDP (B for climate, B for water; supplier engagement leader), JCR A+ and R&I A (2026).
Grid of logos and rating labels with short acquisition notes.
Chronological news list from June 16 to October 6, 2026, including selection as CDP Supplier Engagement Leader for a third year, the start of cement exports from Indonesia to the U.S., the July 21 notice of a fixed asset sale gain and forecast revision, the start of Tokuyama Taiheiyo (September 30) and publication of the Integrated Report 2026.
Two-column dated list with date on the left and headline text on the right.
Statement that forward-looking figures are based on information available at the date of the document and reasonable assumptions, include risks and uncertainties and are not guaranteed.
Single text block on a plain slide.
Closing slide with only the Taiheiyo Cement logo centered on a white background.
Single centered logo on white space.
Common questions about this slide and the underlying presentation content.
It is a 41-page deck covering consolidated highlights, segment results, the income statement, balance sheet and cash flow for April to September 2026, the FY2026 forecast and its revision, shareholder returns and an appendix with trend data, ESG and carbon-neutral strategy pages.
FY2026 is the fiscal year ending March 2027, so the first half (the second quarter, or interim period) covers April to September 2026. The deck is dated November 10, 2026.
H1 sales were ¥469,278 million (+¥31,137 million), operating profit ¥30,318 million (-¥2,535 million) and net profit attributable to owners of the parent ¥36,748 million (+¥12,263 million). The full-year FY2026 operating profit forecast is ¥63.0 billion, down from ¥76.0 billion in the previous forecast.
It is a Japanese-language deck (決算説明資料). The original was published on TDnet, the Tokyo Stock Exchange's timely disclosure system. This gallery page provides English page-by-page analysis.
The interim dividend is ¥60 per share, up from ¥50. The FY2026 annual dividend is planned at ¥120 per share, up ¥20 on the previous year.
The deck cites the Middle East situation raising costs through the full year, lower domestic volumes, a smaller-than-expected first-year benefit from the Tokuyama transfer and U.S. ready-mix acquisition, and weaker U.S. housing demand.
Use the download options on this 2slides gallery page to get the slides. Slides can be exported as PPTX or PDF where available.
The deck uses a repeatable structure: section dividers, comparison tables with change columns, waterfall bridge charts and commentary bullets. Replace the figures with your own and keep the title bar, blue palette and chart style.

Create Your Own Slides
Turn your ideas into professional presentations in seconds with 2slides AI.
Reference professional designs, choose your style, and generate slides with perfect text rendering. Powered by Nano Banana—start creating your presentation now.
Your AI Agent for slides. Save time, shine faster with intelligent presentation creation.


© 2026 2slides. All rights reserved.