
Part of Investor presentation examples · Indian investor presentation examples
State Bank of India Q2 FY27 Earnings Presentation: the 46-slide 'Quarterly Results Q2FY27 Analyst Presentation' dated 3 November 2026 and filed with BSE/NSE (NSE: SBIN, BSE: 500112). It covers India's largest bank's results for the quarter ended 30 September 2026 (Q2 FY27 = July–September 2026; FY27 runs April 2026–March 2027). Headline numbers: net profit of ₹23,038 crore (+14.28% YoY), operating profit of ₹34,226 crore (+7.28%), net interest income of ₹49,143 crore (+14.69%), domestic NIM of 3.11%, gross advances of ₹52.08 lakh crore (+17.84%), deposits of ₹62.78 lakh crore (+12.27%), gross NPA of 1.39%, net NPA of 0.36% and CRAR of 16.09%. All amounts are in ₹ crore as in the deck unless stated otherwise.
Uses this deck’s cover as a style reference for slides made from your own content. Or pick any page below to use its layout as the reference.
Quick Navigation
Tags
Share the slides
State Bank of India Q2 FY27 Earnings Presentation: the 46-slide 'Quarterly Results Q2FY27 Analyst Presentation' dated 3 November 2026 and filed with BSE/NSE (NSE: SBIN, BSE: 500112). It covers India's largest bank's results for the quarter ended 30 September 2026 (Q2 FY27 = July–September 2026; FY27 runs April 2026–March 2027). Headline numbers: net profit of ₹23,038 crore (+14.28% YoY), operating profit of ₹34,226 crore (+7.28%), net interest income of ₹49,143 crore (+14.69%), domestic NIM of 3.11%, gross advances of ₹52.08 lakh crore (+17.84%), deposits of ₹62.78 lakh crore (+12.27%), gross NPA of 1.39%, net NPA of 0.36% and CRAR of 16.09%. All amounts are in ₹ crore as in the deck unless stated otherwise.
Detailed view of each slide page, including layout, key content and visual elements.
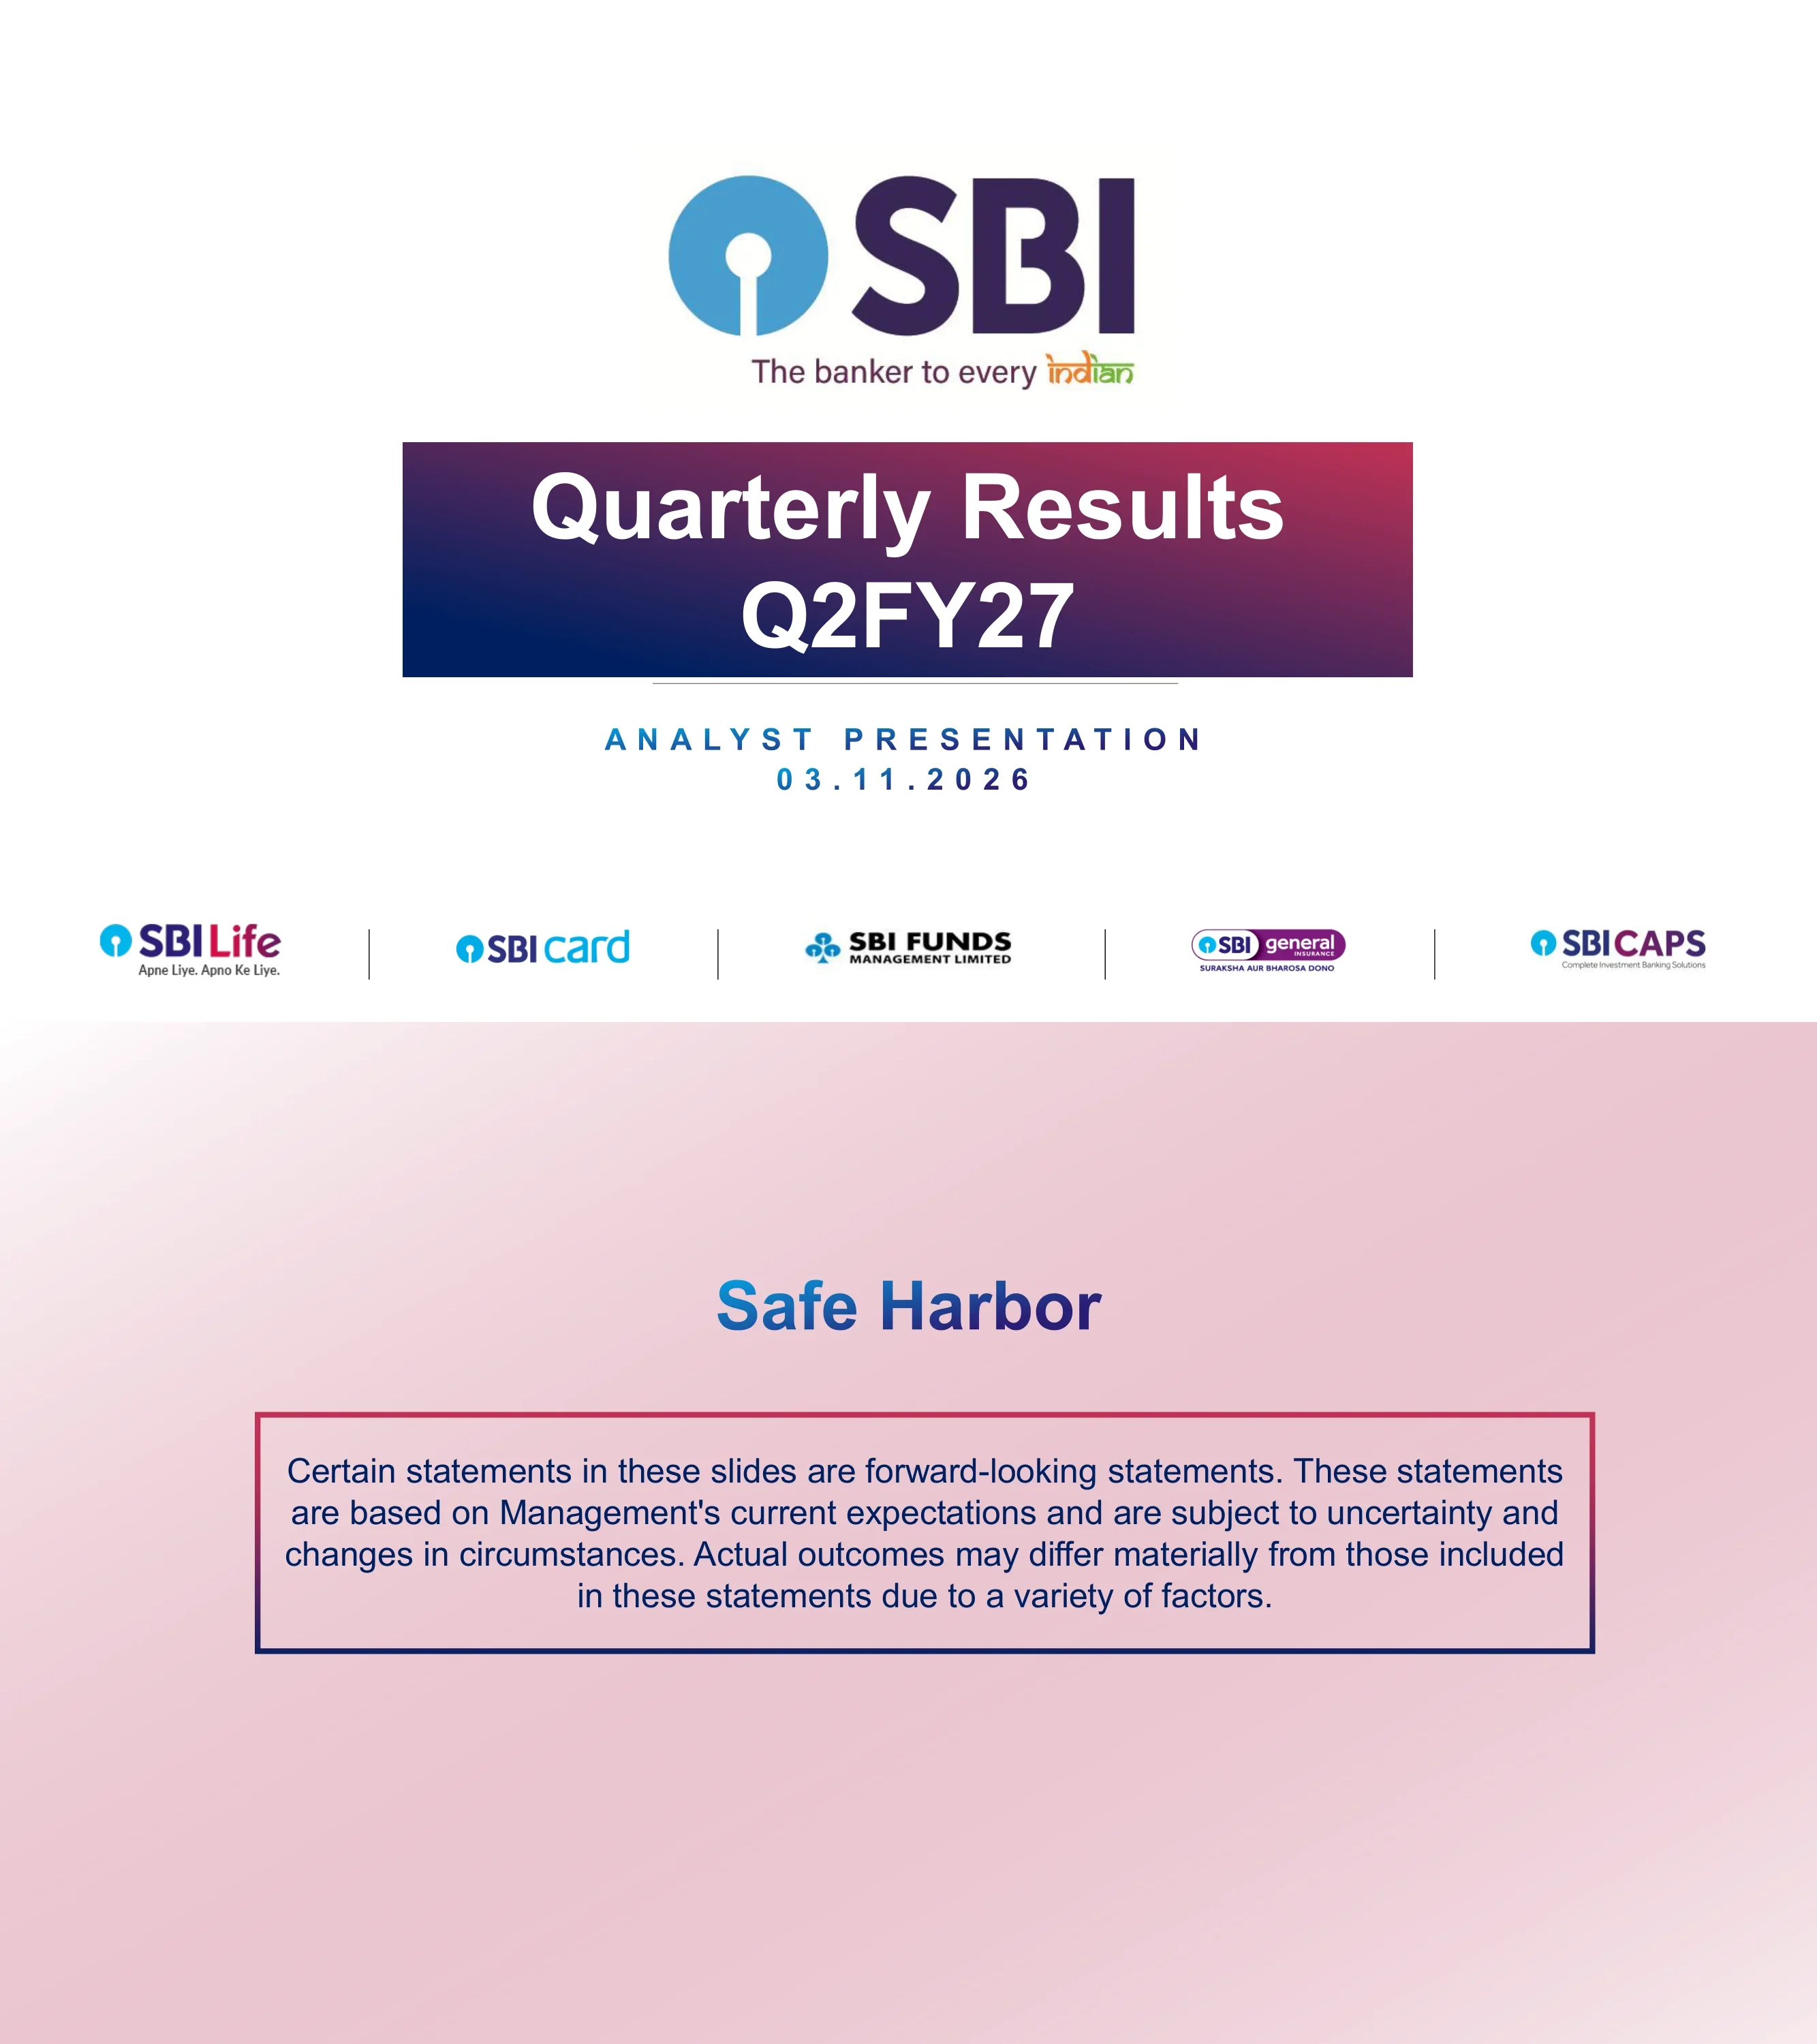
Cover slide with the SBI logo and tagline 'The banker to every Indian', the title 'Quarterly Results Q2FY27', the subtitle 'Analyst Presentation' and the date 03.11.2026, with a strip of group company logos: SBI Life, SBI Card, SBI Funds Management, SBI General and SBICAPS.
Centred logo above a purple-to-crimson gradient title band, spaced-letter subtitle and date, and a row of five subsidiary logos along the bottom.
Standard forward-looking statements disclaimer: statements in the slides are based on management's current expectations, are subject to uncertainty and changes in circumstances, and actual outcomes may differ materially.
Centred heading with one boxed paragraph on a soft pink gradient background.
Eight sections with slide ranges: Executive Summary (4–6), Performance Highlights (7–17), Financial Performance (18–24), Capital Adequacy (25–26), Asset Quality (27–30), Digital Journey (31–34), Banking with a Purpose (35–38) and Subsidiaries, Group Financials & Balance Sheet (39–45).
Two rows of four section labels, each with an arrow-shaped page-range tag, over a faint watermark of the SBI logo.
Section divider introducing the Executive Summary.
Full-width gradient band with the section title in white, underlined by a black rule.
Three-panel summary as on Sep 26. Profitability (Q2FY27): net profit ₹23,038 crore (+14.28% YoY), operating profit ₹34,226 crore (+7.28% YoY), RoA 1.14% and RoE 18.68% for H1FY27, NIM 2.94% whole bank and 3.11% domestic (domestic NIM up 11 bps over Q1FY27). Business growth: gross advances ₹52 trillion (+17.84% YoY) with SME +21.97%, Agri +22.64% and Retail Personal +14.54%; deposits ₹63 trillion (+12.27%) with savings bank +8.78% and retail term deposits +16.74%. Asset quality: gross NPA 1.39%, net NPA 0.36%, Q2FY27 credit cost 0.22% and PCR 74.43%, described as the lowest NPA ratios in more than two decades.
Three bordered cards side by side (Profitability, Business Growth, Asset Quality), each with an icon, large KPI numbers and green YoY arrows.
Balance sheet size rose from ₹69.87 trillion (Sep 25) to ₹76.62 trillion (Jun 26) and ₹78.88 trillion (Sep 26). Domestic CD ratio was 69.82%, 74.23% and 73.02%; CRAR 14.62%, 15.67% and 16.09%; LCR 143.05%, 126.05% and 140.47% over the same dates. Digital leadership panel: 98.9% of transactions through alternate channels, No. 1 in debit card spends, ATMs and mobile banking value and volume, 11.1 crore registered YONO customers and about 6 crore registrations on the new YONO.
Four small charts (two bar charts, two line charts) in a 2x2 grid on the left two-thirds, with a pink digital-leadership panel of four stats on the right.
Section divider introducing Performance Highlights (slides 7–17).
Full-width gradient band with white title.
Q2FY27 vs Q2FY26 (₹ crore): NII 49,143 vs 42,847 (+14.69%); whole-bank NIM 2.94% vs 2.96% (-2 bps); domestic NIM 3.11% vs 3.08% (+3 bps); operating profit 34,226 vs 31,904 (+7.28%); net profit 23,038 vs 20,160 (+14.28%); gross advances 52,08,344 vs 44,19,674 (+17.84%); deposits 62,77,919 vs 55,91,700 (+12.27%). Ratios: credit cost 0.22% (-17 bps), gross NPA 1.39% (-34 bps), net NPA 0.36% (-6 bps), PCR incl. AUCA 91.83% (-46 bps), PCR 74.43% (-136 bps), capital adequacy 16.09% (+147 bps). Side charts: CASA deposits 22,96,883 (+8.13%), retail term deposits 27,85,198 (+16.74%), RAM advances 29,37,856 (+17.34%) and corporate advances 14,39,156 (+16.12%).
Left: three-block table (Profit & Loss, Balance Sheet, Key Ratios) with green/red YoY indicators. Right: four mini bar charts comparing Sep 25 and Sep 26.
Advances by segment, Sep 25 to Sep 26 (₹ crore): Retail Personal 15,93,360 to 18,25,083 (+14.54%), Agri 3,68,112 to 4,51,438 (+22.64%), SME 5,42,222 to 6,61,335 (+21.97%), Corporate 12,39,346 to 14,39,156 (+16.12%), domestic advances 37,43,039 to 43,77,012 (+16.94%), foreign offices 6,76,635 to 8,31,332 (+22.86%), whole bank 44,19,674 to 52,08,344 (+17.84%). Share of domestic advances: Retail Personal 41.70%, Corporate 32.88%, SME 15.11%, Agri 10.31%; RAM (Retail, Agri, MSME) portfolio share 67.12%.
Segment table on the left, 3D pie chart of domestic advances mix on the right with a large RAM share callout.
Retail Personal portfolio of about ₹18.3 lakh crore, 3-year CAGR about 14%, about 41.7% of domestic advances (Sep 26). By product (outstanding ₹ crore / YoY growth / GNPA): home loans 9,85,537 / 11.94% / 0.57%; personal loans 3,78,769 / 7.48% / 1.15%; auto loans 1,36,294 / 5.88% / 0.52%; personal gold loans 1,37,349 / 89.31% / 0.05%; other P-segment loans 1,87,134 / 17.51% / 0.57%. Composition: home loans 54.00%, personal loans 20.75%, auto 7.47%, gold 7.53%, other 10.25%.
Four header tiles across the top, a product table with coloured product labels and icons, and a stacked composition bar on the right.
Fund-based outstanding by sector as on 30 Sep 26 (₹ crore, share, YoY): infrastructure 4,12,931 (9.43%, +6.01%) of which power 2,68,059 (+20.12%), telecom 19,090 (-8.34%), roads & ports 82,746 (-20.22%); services 6,60,758 (15.10%, +25.61%); iron & steel 79,215; aviation & airports 29,834 (+27.29%); petroleum 87,831 (+22.35%); engineering 63,069 (+47.66%); commercial real estate 84,160 (+27.75%); other industries 6,30,101; home loans 9,85,537 (22.52%); auto 1,36,294; other retail 7,03,252 (+20.38%); agriculture 4,51,438; total domestic advances 43,77,012 (+16.94%). Corporate rating mix Sep 25 vs Sep 26: AAA 41% to 44%, AA 29% to 29%, A 16% to 15%, BBB 6% to 5%, BB and below 8% to 7%; about 40% of exposure is to PSUs and government departments.
Dense sector table on the left, grouped bar chart of corporate rating mix for two dates on the right, with a footer callout.
Foreign office gross advances grew from ₹6,76,635 crore (Sep 25) through 6,93,332, 7,42,941 and 7,70,574 to ₹8,31,332 crore (Sep 26), +22.86% YoY (+13.84% in dollar terms). Loan mix: local lending 39.7%, India-linked loans 37.2%, trade finance 23.1%. By geography: USA 24%, GIFT City 16%, UK 15%, UAE 10%, Hong Kong 9%, Bahrain, Singapore and Japan 5% each, Germany and Sydney 3% each, others 5%. International GNPA fell from 0.19% to 0.11%. Highlights cite ECBs and local credit as drivers and FCNR(B) loans of USD 8.83 billion.
Four-quadrant layout: advances bar chart, loan-mix donut, GNPA bar chart and geography donut, with a bullet-point highlights column on the right.
Deposits Sep 25 to Sep 26 (₹ crore): current account 3,28,230 to 3,43,208 (+4.56%), savings bank 17,96,036 to 19,53,675 (+8.78%), CASA 21,24,266 to 22,96,883 (+8.13%), term deposits 32,36,366 to 36,97,717 (+14.26%), domestic 53,60,632 to 59,94,600 (+11.83%), foreign offices 2,31,068 to 2,83,319 (+22.61%), total 55,91,700 to 62,77,919 (+12.27%). Domestic mix: TD 61.68%, SA 32.59%, CA 5.73%; CASA ratio 38.32%.
Deposit table on the left, 3D pie of domestic deposit mix on the right with a large CASA callout.
Cumulative ratios Sep 25 / Dec 25 / Mar 26 / Jun 26 / Sep 26. NIM: domestic 3.04, 3.06, 3.03, 3.00, 3.06; whole bank 2.92, 2.94, 2.91, 2.86, 2.90; foreign offices 1.99, 1.97, 1.93, 1.74, 1.72. Yield on advances: domestic 8.68 to 8.22, foreign 5.06 to 4.56. Cost of deposits: domestic 5.13 to 4.84, foreign 3.85 to 3.52. Domestic yield on investments 7.08 to 6.90.
Four line charts in a 2x2 grid, each with labelled data points for five quarter-ends.
Q2FY27 vs Q2FY26 (₹ crore): fee income 9,549 vs 8,711 (+9.63%). Key fee components: loan processing charges 2,343 vs 1,712 (+36.92%), commission on government business 1,339 vs 1,133 (+18.19%), CVE income 1,389 vs 1,256 (+10.58%), commission on LC/BG 909 vs 854 (+6.42%). Other components: profit on sale/revaluation of investments 6,011 vs 7,470 (-19.53%), forex/derivatives income 529 vs 979 (-45.99%), recovery from AUCA accounts 2,462 vs 2,483 (-0.81%).
Fee income bar pair on the left feeding a rounded panel of four component bar pairs; a lower row of three more bar pairs with vertical growth labels.
Gross investment book Sep 25 to Sep 26 (₹ crore): domestic 16,58,106 to 17,86,298 (of which SLR 13,78,022 to 15,21,752), foreign offices 77,793 to 85,640, total 17,35,899 to 18,71,938. Domestic investment mix Sep 26: HTM 72.90%, AFS 15.99%, FVTPL-HFT 9.49%, FVTPL-NHFT 0.95%, A&S 0.67%. Yield on investments 7.08% (H1FY26) to 6.90% (H1FY27), -18 bps. AFS book: G-Sec and T-bills 50% to 53%, corporate bonds 32% to 31%; modified duration 2.33 (Sep 2025) and 2.82 (Sep 2026).
Investment table, donut chart and yield bar chart across the top; two 3D pies of AFS book composition with modified duration callouts below.
Tagline: focus continues on improving income streams with control on costs. Opex mix H1FY26 vs H1FY27: salary 43.1% to 45.0%, retiral benefits and other provisions 15.2% to 13.9%, overheads 41.7% to 41.1%. Cost-to-income ratio 48.94% (H1FY25), 48.53% (H1FY26), 48.33% (H1FY27). Cost to average assets 1.71%, 1.72%, 1.63%. Staff expenses to operating income 27.73%, 27.62%, 26.60%; overheads to operating income 21.21%, 20.91%, 21.73%.
Two donut charts of opex mix, a stacked bar chart, and two bar charts for cost ratios over three half-years.
Section divider introducing Financial Performance (slides 18–24).
Full-width gradient band with white title.
Income statement for Q2FY26 / Q1FY27 / Q2FY27 and H1FY26 / H1FY27 (₹ crore): interest income 1,19,517 / 1,27,896 / 1,32,019; interest expenses 76,670 / 80,904 / 82,876; NII 42,847 / 46,992 / 49,143 (+14.69% YoY); non-interest income 20,056 / 15,923 / 19,066 (-4.94% YoY); operating expenses 30,999 / 29,386 / 33,983; operating profit 31,904 / 33,529 / 34,226; total provisions 11,744 / 12,408 / 11,188; net profit 20,160 / 21,121 / 23,038 (+9.07% QoQ, +14.28% YoY). H1FY27 net profit 44,159 (+12.31%). Cost-to-income 49.82% in Q2FY27. Footnote: non-interest income includes a one-time ₹4,593 crore gain on the Yes Bank stake sale in Q2FY26 and ₹7,288 crore on the SBI Funds Management stake sale in Q2FY27.
Full-width financial table with quarter, half-year and growth column groups, highlighted current-period columns and a footnote.
Income detail (Q2FY26 / Q1FY27 / Q2FY27, ₹ crore): interest on loans 86,183 / 94,011 / 97,464 (+13.09% YoY); interest on resources 29,972 / 30,922 / 31,813; other interest income 3,363 / 2,963 / 2,741; fee income 8,711 / 9,476 / 9,549; profit on sale/revaluation of investments 7,470 / 4,319 / 6,011; forex/derivatives 979 / 497 / 529; miscellaneous income 2,897 / 1,631 / 2,977; total income 1,39,573 / 1,43,819 / 1,51,084 (+8.25% YoY). H1FY27 total income 2,94,904 (+7.27%).
Full-width table with quarter, half-year and growth column groups.
Fee lines (Q2FY26 / Q1FY27 / Q2FY27, ₹ crore): loan processing charges 1,712 / 2,114 / 2,343; commission on government business 1,133 / 1,578 / 1,339; commission on LC/BG 854 / 888 / 909; CVE income 1,256 / 1,140 / 1,389; remittance, collection etc. 2,060 / 1,768 / 1,616 (-21.56% YoY); miscellaneous fee income 1,696 / 1,988 / 1,953; total fee income 8,711 / 9,476 / 9,549 (+9.63% YoY). H1FY27 fee income 19,025 (+14.93%).
Full-width seven-row table with quarter, half-year and growth columns.
Expense detail (Q2FY26 / Q1FY27 / Q2FY27, ₹ crore): interest on deposits 68,946 / 71,119 / 73,528; interest on borrowings 4,286 / 6,442 / 6,021 (+40.47% YoY); other interest paid 3,438 / 3,343 / 3,326; total interest expenses 76,670 / 80,904 / 82,876; salary 12,060 / 13,182 / 12,860; provisions for employees 4,546 / 4,242 / 4,592; staff expenses 16,606 / 17,424 / 17,452; overheads 14,393 / 11,962 / 16,531; operating expenses 30,999 / 29,386 / 33,983; total expenses 1,07,669 / 1,10,290 / 1,16,859 (+8.54% YoY).
Full-width table with quarter, half-year and growth column groups.
Overhead lines (Q2FY26 / Q1FY27 / Q2FY27, ₹ crore): rent, taxes & lighting 1,663 / 1,470 / 1,872; depreciation 1,078 / 1,189 / 1,271; printing & stationery 262 / 215 / 259; postage & telecom 248 / 183 / 279; repairs & maintenance 352 / 286 / 370; travelling & halting 490 / 419 / 552; business acquisition & development 1,244 / 1,354 / 2,004 (+61.07% YoY); ATM/CDM/debit card/other 2,926 / 2,737 / 3,226; miscellaneous 6,130 / 4,108 / 6,697; total overheads 14,393 / 11,962 / 16,531 (+14.86% YoY, +38.20% QoQ).
Full-width ten-row table with quarter, half-year and growth columns.
From operating profit to net profit (Q2FY26 / Q1FY27 / Q2FY27, ₹ crore): operating profit 31,904 / 33,529 / 34,226; loan loss provisions 4,132 / 3,359 / 2,759 (-33.23% YoY); standard assets 1,198 / 477 / 377; investment depreciation -39 / -58 / -150; other provisions 109 / 1,269 / 1,232; income tax 6,344 / 7,361 / 6,971; total provisions 11,744 / 12,408 / 11,188; net profit 20,160 / 21,121 / 23,038. Annualised ratios: RoA 1.17% / 1.11% / 1.19% (H1FY26 1.15%, H1FY27 1.14%); RoE 17.87% for Q1FY27, 20.21% for H1FY26 and 18.68% for H1FY27 (Q2 cells left blank); EPS ₹87.28 / ₹91.78 / ₹99.02 (H1FY26 ₹86.71, H1FY27 ₹95.42).
Provision table across the top and a smaller annualised-ratio table below.
Section divider introducing Capital Adequacy (slides 25–26).
Full-width gradient band with white title.
Capital ratios Sep 25 / Jun 26 / Sep 26: CET-1 11.47% / 12.89% / 13.34%, AT-1 1.20% / 1.01% / 1.00%, Tier-2 1.95% / 1.77% / 1.75%, CRAR 14.62% / 15.67% / 16.09%, against regulatory minimums of 8.80% CET-1 and 12.30% total capital. RWAs to total assets 52.81% / 52.56% / 52.09%; credit RWA on advances to gross advances 55.99% / 53.33% / 52.11%. Note: under the revised RBI framework, plough-back of profit was applied in the Jun 26 and Sep 26 quarters.
Stacked bar chart of capital tiers with dotted minimum-requirement lines on the left; two simple bar charts on the right.
Section divider introducing Asset Quality (slides 27–30).
Full-width gradient band with white title.
Five quarter-ends Sep 25 to Sep 26. Gross NPA ₹76,243, 73,637, 73,452, 74,272 and 72,529 crore; GNPA ratio 1.73%, 1.57%, 1.49%, 1.47%, 1.39%. Net NPA ₹18,460, 18,012, 18,830, 19,158, 18,546 crore; NNPA ratio 0.42%, 0.39%, 0.39%, 0.38%, 0.36%. PCR 75.79% to 74.43%; PCR incl. AUCA 92.29% to 91.83%. Cumulative slippage ratio 0.60%, 0.54%, 0.54%, 0.57%, 0.50%; credit cost 0.43%, 0.39%, 0.37%, 0.27%, 0.25%.
Six charts in a 3x2 grid: combo bar-and-line charts for gross and net NPA, line charts for the two PCR measures, bar charts for slippage ratio and credit cost.
NPA movement (₹ crore) for Q2FY26, Q3FY26, Q4FY26, FY26, Q1FY27 and Q2FY27: in Q2FY27 opening GNPA 74,272, total reductions 7,120 (recovery and upgradation 3,235), gross additions 5,377 (fresh slippages 5,227), net decrease 1,743, closing GNPA 72,529. FY26 fresh slippages were 22,678. Segmental NPAs Sep 26 (amount / ratio): retail 60,413 / 2.06%, of which agri 29,608 / 6.56%, personal 11,828 / 0.65%, SME 18,977 / 2.87%; corporate 11,185 / 0.78%; international 931 / 0.11%; total 72,529 / 1.39%.
Two stacked tables: NPA movement across six periods, and segmental NPAs for three dates.
Slippages (₹ crore): H1FY26 12,699, H1FY27 12,273; quarterly 4,754 (Sep 25), 4,458 (Dec 25), 5,521 (Mar 26), 7,046 (Jun 26), 5,227 (Sep 26). SMA-1 and SMA-2 accounts with exposure above ₹5 crore (CRILC data): total 3,762, 3,870, 3,350, 4,174 and 4,801 over the five quarter-ends; at Sep 26 SMA-1 was 3,265 and SMA-2 1,536.
Two bar charts side by side: slippages on the left, stacked SMA-1/SMA-2 bars on the right.
Section divider introducing the Digital Journey section (slides 31–34).
Full-width gradient band with white title.
Market shares (latest available): debit card spends 24.13%, ATMs 31.09%, mobile banking transactions 28.40% by number and 22.23% by value. UPI: 1,828 crore remit transactions in Q2FY27, 26.30 crore unique SBI UPI users, 25.28% share of remittances. Debit cards: 25.84 crore cards, about 9.1 crore spend transactions and about ₹26 thousand crore spend in Q2FY27. About 1.1 crore ATM transactions per day. Digital share of transactions 95% (94% a year earlier); 98.9% through alternate channels. Touch points Sep 25 to Sep 26: SBI UPI users 22.1 to 26.3 crore, YONO 9.3 to 11.1 crore, YONO Lite 2.7 to 2.6 crore, active retail internet banking 11.8 to 12.8 crore, BC outlets 79.0K to 79.9K, ATMs 62.5K to 65.3K. Acceptance points: 61.44 lakh BHIM SBI Pay QR codes, 17.8 lakh POS, 10.7 lakh BHIM-Aadhaar-SBI, 10.6 lakh Bharat QR.
Left: stacked stat strips (market share, payment modes, acceptance points). Right: two donut charts of channel mix and a grid of circular before/after badges.
YONO in Q2FY27: 59.63 lakh registrations (up 95% from 30.53 lakh in Q2FY26, about 66K a day), 1.84 crore WhatsApp banking registrations, 0.81 lakh digital loans disbursed, 9.72 crore fund transfers (up 68% from 5.77 crore, about 11 lakh a day). Also 29.2 lakh savings accounts opened, 83.0 lakh YONO Cash, 0.4 lakh NPS and 0.89 lakh PPF accounts; 20.5 lakh personal accident policies, 37.0K e-Shield Insta life policies, 3.3 lakh approved credit cards and ₹8.1 thousand crore mutual fund gross sales. End-to-end digital loan disbursements: PAPL ₹1,510 crore, real-time personal loans ₹907 crore, Insta Home Top-Up ₹362 crore, loans against mutual funds ₹117 crore.
Mascot illustration with a pink stat panel, three rows of category tiles on the left, and two bar charts with daily-average callouts on the right.
Advances through analytical leads (₹ crore): FY22 65,912, FY23 1,04,139, FY24 1,37,357, FY25 1,24,268, FY26 1,80,518; H1FY26 74,355 and H1FY27 96,214 (+29.40% YoY). Digital loans in H1FY27 of ₹7,225 crore, including PAPL ₹2,824 crore, PABL ₹2,061 crore, RTPL ₹1,592 crore, Insta Home Top-Up ₹509 crore and PASBL ₹239 crore. Business through analytical leads by unit: retail loans ₹48,091 crore, ABU ₹28,220 crore, SMEBU ₹15,286 crore, REHBU ₹4,617 crore, plus ₹108 crore CVE commission fees. AI initiatives: Project SARAL collection models predicting early delinquency, and analytics-based cash-flow lending to gig workers.
Bar chart of analytical-lead advances across the top left, tile and bubble diagrams below, and two pink text panels describing AI initiatives on the right.
Section divider introducing Banking with a Purpose (slides 35–38).
Full-width gradient band with white title.
BC outlets 78,993 (Sep 25) to 79,905 (Sep 26). BC channel transactions 47.72 crore in H1FY26 and 48.02 crore in H1FY27, with transaction amount ₹2,50,749 crore and ₹2,22,471 crore. Deposits in financial inclusion accounts ₹79,472 crore to ₹91,169 crore; average balance ₹4,337 to ₹4,874 (+14.71%). Social security scheme enrolments (crore): APY 1.86 to 2.14, PMJJBY 7.67 to 8.54, PMSBY 15.43 to 16.64, PMJDY 15.39 to 15.83. Total market share: PMJJBY 34.19%, PMSBY 29.19%, PMJDY 26.61%, APY 22.03%; among PSBs 45.22%, 38.37%, 34.58% and 31.86%. Passbook printers at CSPs 36,056 to 39,165. New CSP initiatives: Mudra loan sourcing via Jan Samarth, WhatsApp receipts for transactions of ₹5,000 and above, and the mobile-app 'CSP Lite'.
Row of four small charts across the top, two tables bottom left and a bullet list with a CSP photo collage bottom right.
As on Sep 2026, grouped by capital. Financial: Q2FY27 net profit ₹23,038 crore, advances ₹52.08 lakh crore, deposits ₹62.78 lakh crore, 98.9% of transactions via alternate channels. Natural: ₹2,25,107 crore sanctioned for sustainable finance (₹1,78,948 crore for renewable energy), more than 78 GW of sanctioned RE capacity, more than 50 MW captive RE, 133 green building / net-zero certifications. Social: ₹372 crore CSR spend in Q2FY27, 79,905 BC outlets, 41,147 candidates trained through RSETIs, 4,52,979 trees planted. Human: workforce of 2,47,254, 29% women, 6,150 persons with disabilities, 100% of permanent employees covered by medical benefits.
Four-column table with icon headers (Financial, Natural, Social, Human Capital) and four stats per column on a pale green background.
CSR budget utilisation up to 30.09.2026 (₹ crore, FY27 budget / used): circles 215.00 / 95.00, SBI Foundation 520.00 / 300.00, RSETIs 34.37 / 0.00, national and miscellaneous 30.95 / 1.10, total 800.32 / 396.10. CSR spend mix (excluding SBI Foundation): education 36%, healthcare and sanitation 36%, green environment 18%, women and senior citizen empowerment 4%, other 4%, disaster management 2%. Q2FY27 initiatives include 4,52,979 trees planted, 60,000 reusable sanitary pad kits in Andhra Pradesh girls' schools, upgrades for 42 government primary schools in Telangana, medical equipment for NIMS Hyderabad and SMS Hospital Jaipur, 1,200 bicycles for girl students, and upgrades to 26 primary health centres in Kerala.
Budget table and pie chart on the left; bullet list of major CSR initiatives on the right.
Section divider introducing the final section (slides 39–45).
Full-width gradient band with a two-line white title.
As on Sep 2026 (SBI stake / H1FY27 PAT ₹ crore / H1FY27 RoE). Listed: SBI Card 68.58% / 1,442 / 17.50%; SBI Life 55.31% / 1,274 / 12.87%; SBI Funds Management 55.56% / 1,566 / 46.81%. Key unlisted: SBI General Insurance 73.87% / 205 / 7.80%; SBI Capital Markets Group 100% / 816 / 22.06%; SBI Payments Services 74% / 84 / 11.31%; SBI SG Global Securities 65% / 92 / 23.10%. Subsidiary numbers are as published by each subsidiary.
Two stacked tables (listed and unlisted subsidiaries) with four columns each.
SBI Life H1FY27: PAT ₹1,274 crore (₹1,089 crore H1FY26), RoE 12.9%; individual rated premium ₹9,722 crore (+12%), gross written premium ₹48,405 crore (+13%), VoNB ₹3,274 crore (+19%) at a 27.9% margin; new business premium ₹20,259 crore (+10%), renewal premium ₹28,145 crore (+15%), solvency 1.97, AUM ₹5,27,120 crore (+9%), embedded value ₹87,349 crore (+15%); private-market shares of 20.0%, 25.2%, 22.6% and 20.4% across new-business premium measures. SBI Card H1FY27: PAT ₹1,442 crore (+44%, ₹1,001 crore H1FY26), RoE 17.5%, RoA 4.2%, revenue from operations ₹10,181 crore (+3%); cards in force 232 lakh (+8%), spends ₹2,29,164 crore (+14%), receivables ₹58,376 crore (-2%); #2 in cards, spends and transactions, with 18.5% share of cards in force and 18.7% of spends; CRAR 26.5%, Tier I 21.2%.
Two half-page panels, each with a logo, small PAT/RoE table, three bar pairs with growth labels and bullet commentary.
SBI Funds Management H1FY27: PAT ₹1,566 crore (₹1,586 crore H1FY26), RoE 46.8% (34.9%); quarterly average MF AUM ₹13.1 trillion (+10%), 15.0% market share, #1 fund manager; alternate AUM ₹13.3 trillion as printed, including AIF average AUM of about ₹7,437 crore; SIP AUM ₹2.07 trillion (+15%), 12.3% share. SBICAPS Group: PAT ₹816 crore (₹820 crore), RoE 22.1% (28.8%); No. 1 mandated lead arranger for India borrower loans (36.19% share, FY26), No. 6 in debt private placement, No. 2 in ECM by issue amount. SBI General: PAT ₹205 crore (₹422 crore), RoE 7.8% (17.3%); gross written premium ₹8,767 crore vs ₹7,376 crore (+19%), AUM ₹26,130 crore vs ₹22,399 crore (+17%); ranked 6th among private insurers, No. 1 private player in personal accident; text cites gross direct premium of ₹8,689 crore (+21%).
Left: SBI Funds and SBICAPS panels with mini tables and highlight boxes. Right: SBI General panel with two bar charts and highlights.
Q2FY27 performance of the 9 SBI-sponsored RRBs in 9 states, with 4,199 branches in 196 districts: deposits ₹1,52,407 crore (+11.55% YoY), CASA 50.83% (-27 bps), gross advances ₹1,31,454 crore (+13.77%), CD ratio 86.25% (+168 bps), NIM 4.20% (+44 bps), gross NPA 2.43% (-24 bps), net profit ₹2,130 crore (+49.58%), RoA 2.05% (+55 bps), PCR 87.07% (-7 bps), RoE 19.97% (+464 bps).
Two pink panels side by side with five bullet KPIs each and coloured up/down arrows.
Consolidated H1FY26 vs H1FY27 (₹ crore): interest earned 2,53,467 vs 2,77,314 (+9.41%); non-interest income 92,450 vs 97,383 (+5.34%); total income 3,45,916 vs 3,74,697 (+8.32%); interest expended 1,56,269 vs 1,66,520; operating expenses 1,20,011 vs 1,31,074 (employee cost 38,558, other 92,516); operating profit 69,636 vs 77,103 (+10.72%); provisions other than tax 11,750 vs 10,664; share of associates' profit 1,018; minority interest 1,864; tax 16,119; net profit 42,339 vs 49,474 (+16.85%). Ratios: RoA 1.13% to 1.17%, RoE 19.65% to 19.11%, EPS ₹93.36 to ₹106.90, expense ratio 48.20% to 48.11%, NIM 3.04% to 3.02%, GNPA 1.73% to 1.39%, NNPA 0.42% to 0.36%. Footnote: one-time gains of ₹3,027 crore (Yes Bank, Q2FY26) and ₹6,879 crore (SBI Funds Management, Q2FY27), net of accounting-standard adjustments.
Consolidated P&L table on the left, ratio table on the right, footnote below.
Sep 25 vs Sep 26 (₹ crore), standalone (SBI Solo) and group. Solo liabilities: capital 923; reserves 5,17,136 to 5,98,663 (+15.77%); deposits 55,91,700 to 62,77,919; borrowings 6,00,551 to 6,89,511; other liabilities 2,77,158 to 3,20,776; total 69,87,469 to 78,87,793 (+12.88%). Solo assets: cash with RBI 2,72,575 to 2,20,083 (-19.26%); balances with banks 1,19,753 to 1,14,050; investments 17,28,080 to 18,64,677; net advances 43,61,737 to 51,54,323 (+18.17%); fixed assets 52,094 to 55,566; other assets 4,53,229 to 4,79,094. Group total assets 76,73,400 to 86,58,539 (+12.84%), with group deposits 63,47,305 and net advances 52,60,609.
Two stacked tables (liabilities and assets) with Solo and Group column groups.
Closing slide with 'Thank You' in a blue-to-navy gradient.
Centred text on a soft pink gradient background.
Common questions about this slide and the underlying presentation content.
It is SBI's official 46-slide 'Quarterly Results Q2FY27 Analyst Presentation', dated 3 November 2026 and filed with the stock exchanges (BSE/NSE) for SBIN. It covers the bank's results for the quarter and half year ended 30 September 2026, including profitability, loan and deposit growth, margins, asset quality, capital, digital metrics, subsidiaries, group financials and the balance sheet.
Indian banks follow an April–March financial year, so FY27 runs from April 2026 to March 2027 and Q2 FY27 is July–September 2026. H1FY27 in the deck means April–September 2026.
Standalone net profit was ₹23,038 crore (+14.28% YoY), operating profit ₹34,226 crore (+7.28%) and net interest income ₹49,143 crore (+14.69%). Domestic NIM was 3.11% and whole-bank NIM 2.94%. Gross advances grew 17.84% to ₹52.08 lakh crore and deposits 12.27% to ₹62.78 lakh crore. Gross NPA was 1.39%, net NPA 0.36% and CRAR 16.09%.
Yes. Slide 19 notes that non-interest income includes a one-time profit of ₹7,288 crore from the stake sale in SBI Funds Management in Q2FY27, and ₹4,593 crore from the Yes Bank stake sale in the comparison quarter Q2FY26. Total non-interest income was ₹19,066 crore, down 4.94% YoY.
Figures are in Indian rupees, mostly in ₹ crore (1 crore = 10 million) using Indian digit grouping, so 52,08,344 crore equals ₹52.08 lakh crore or about ₹52 trillion. Some summary slides use ₹ trillion or lakh crore directly. The page descriptions here keep the deck's own units.
SBI files its analyst presentation with BSE and NSE alongside its quarterly results, and also posts it in the investor relations section of sbi.co.in. The BSE company page for State Bank of India (scrip code 500112) lists its corporate announcements.
Yes, as a reference. It shows a common structure for a bank's quarterly analyst deck: an executive KPI summary, segment-wise credit and deposit tables, margin trend charts, detailed income statement tables, NPA movement and segmental NPA tables, capital ratios, digital and ESG sections, and subsidiary and balance sheet pages. The PDF download is free.
Yes. Slides 40–43 cover SBI Card, SBI Life, SBI Funds Management, SBI General Insurance, SBI Capital Markets, SBI Payments, SBI SG Global Securities and the nine SBI-sponsored Regional Rural Banks, and slide 44 shows consolidated group financials for H1FY27 (group net profit ₹49,474 crore, +16.85%).
Exchange page where SBI's results filings and analyst presentations are announced

Create Your Own Slides
Turn your ideas into professional presentations in seconds with 2slides AI.
Reference professional designs, choose your style, and generate slides with perfect text rendering. Powered by Nano Banana—start creating your presentation now.
Your AI Agent for slides. Save time, shine faster with intelligent presentation creation.


© 2026 2slides. All rights reserved.