
Part of Investor presentation examples · Indian investor presentation examples
Solar Industries Q2 FY27 Earnings Presentation — Solar Industries India Limited's 'Rise & Shine' Q2FY27 & HYFY27 board presentation, filed with BSE/NSE, covering the quarter ended September 30, 2026 (July–September 2026) and the half year April–September 2026. All amounts are in Rs. crore (₹ crore), as in the original deck.
Uses this deck’s cover as a style reference for slides made from your own content. Or pick any page below to use its layout as the reference.
Quick Navigation
Tags
Share the slides
Solar Industries Q2 FY27 Earnings Presentation — Solar Industries India Limited's 'Rise & Shine' Q2FY27 & HYFY27 board presentation, filed with BSE/NSE, covering the quarter ended September 30, 2026 (July–September 2026) and the half year April–September 2026. All amounts are in Rs. crore (₹ crore), as in the original deck.
Detailed view of each slide page, including layout, key content and visual elements.
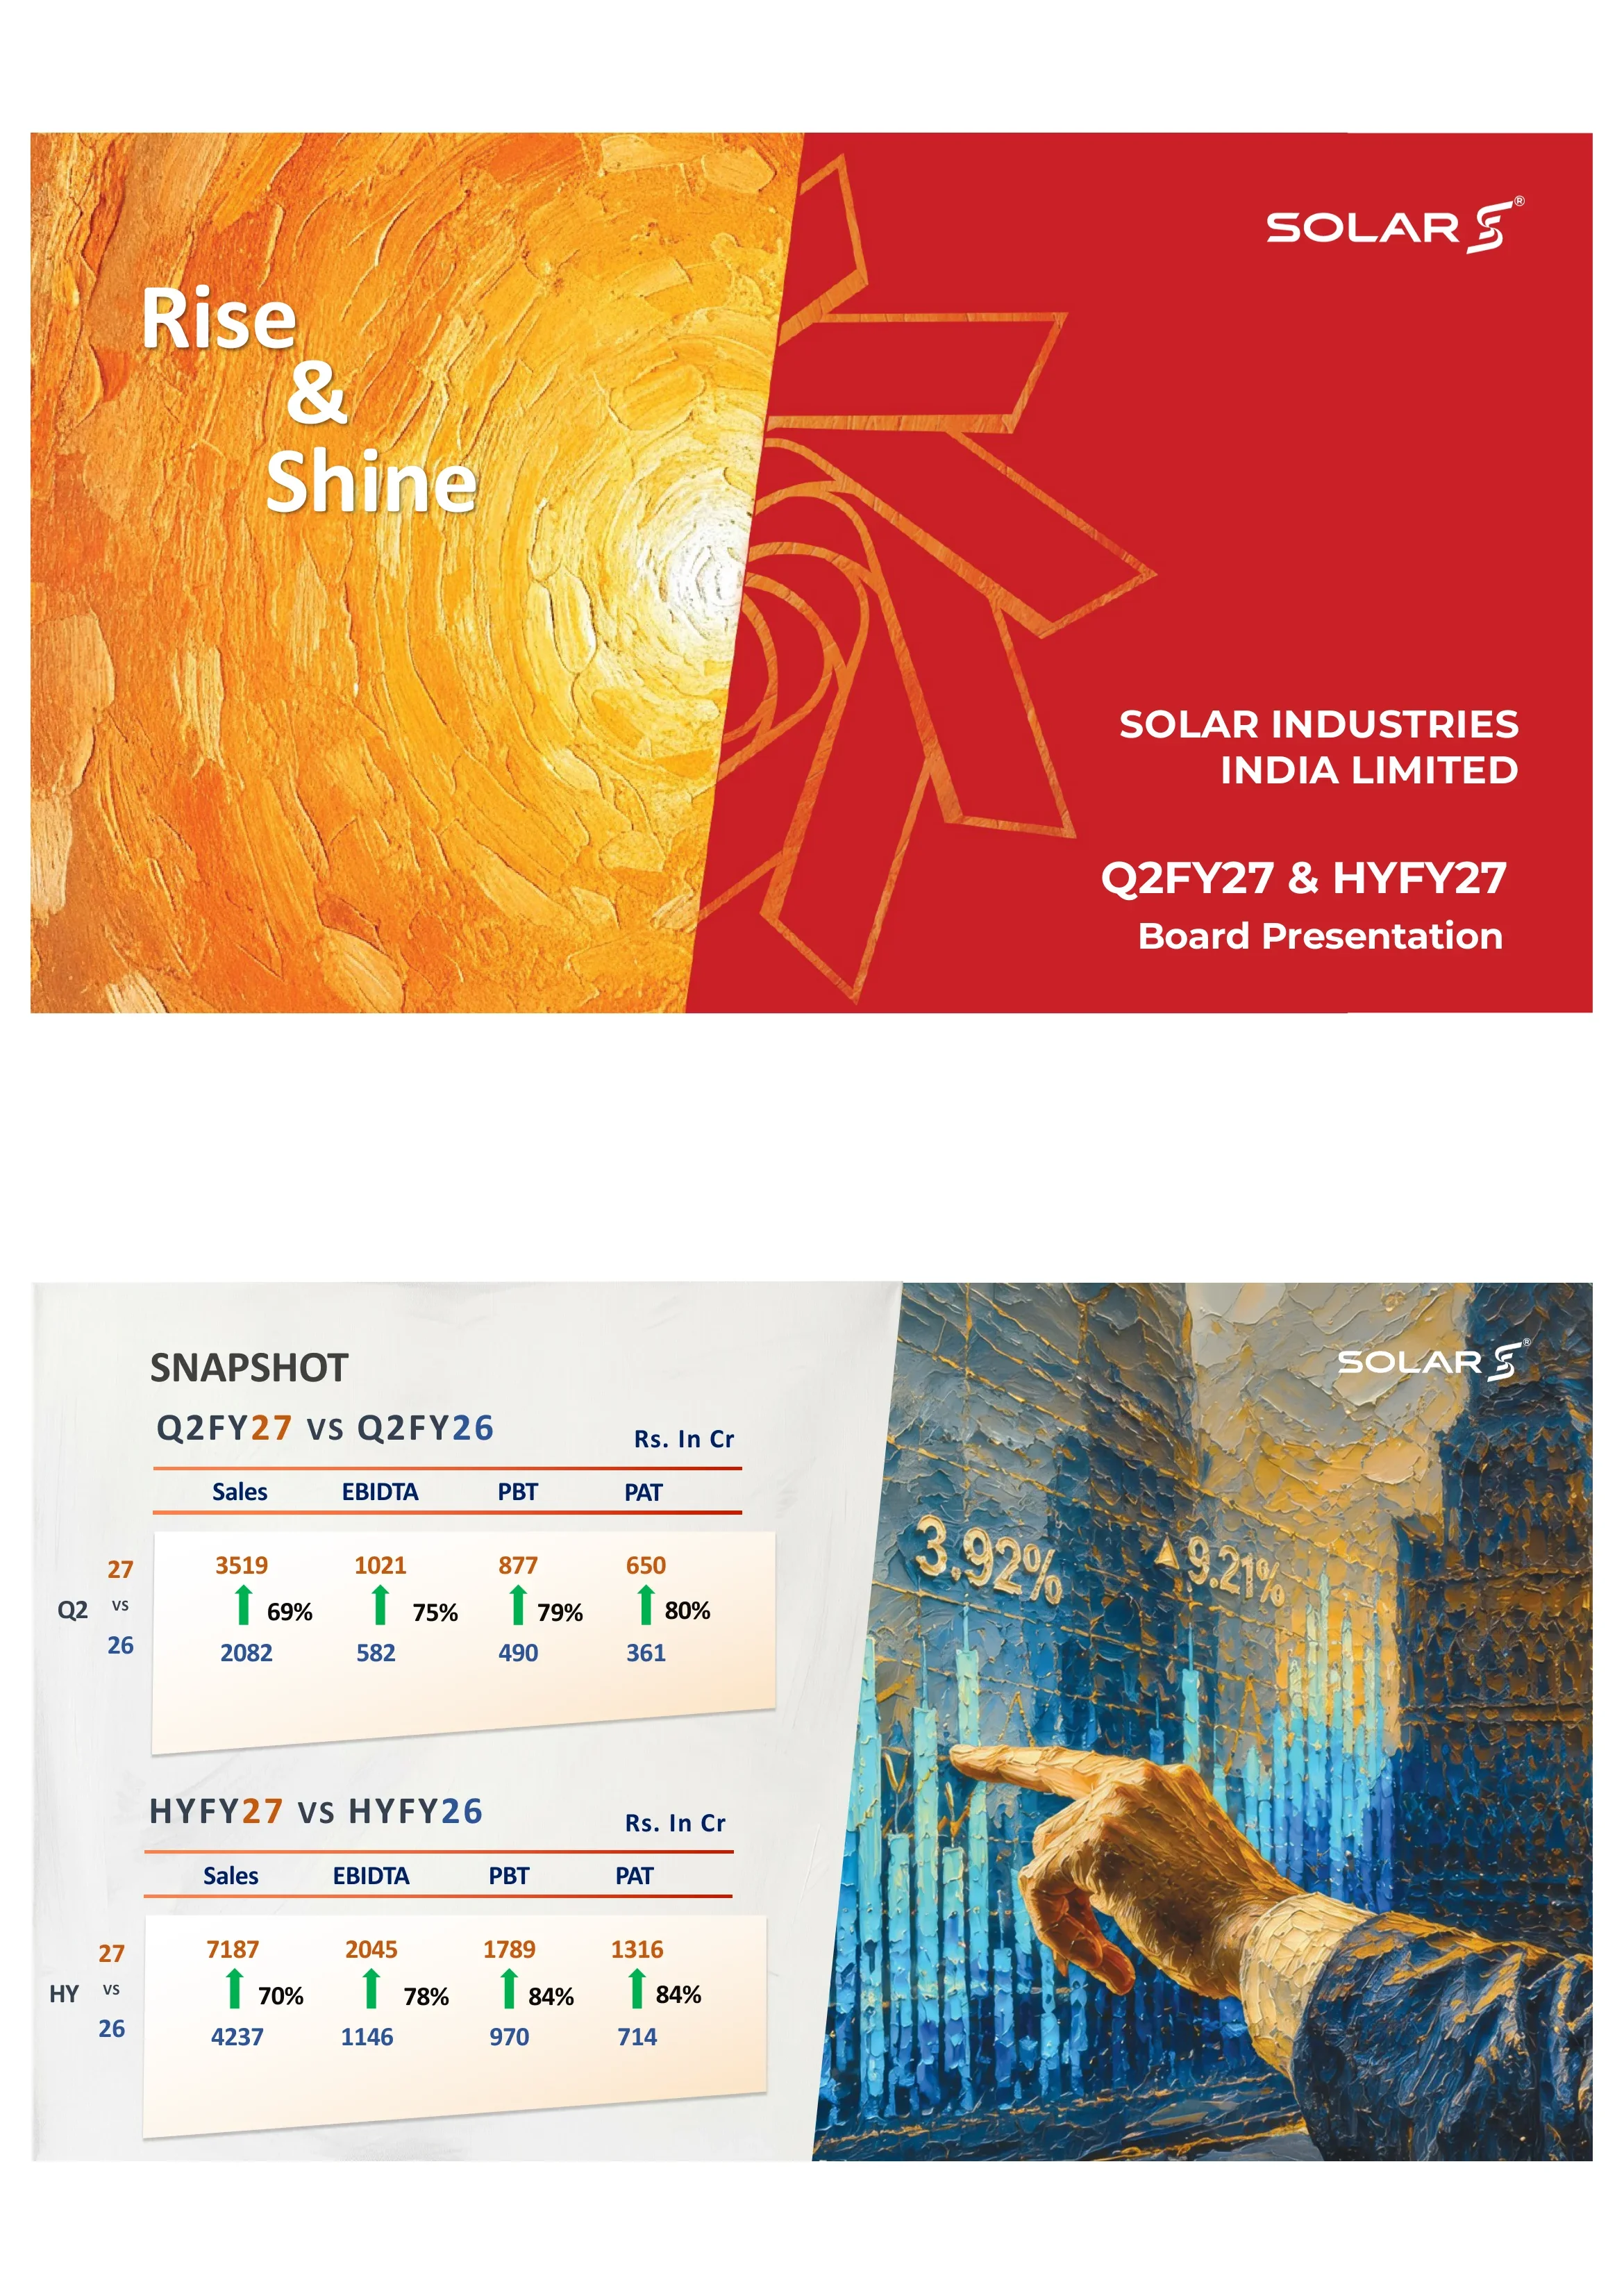
Cover slide for Solar Industries India Limited's Q2FY27 and half-year FY27 (HYFY27) board presentation, carrying the theme line 'Rise & Shine' and the SOLAR logo.
Diagonal split: left half is a textured orange oil-painting sunburst with the 'Rise & Shine' title in large white type; right half is solid red with a large outlined pinwheel/sun motif, the SOLAR logo top right and the company name and period bottom right.
Headline numbers in Rs. crore. Q2FY27 vs Q2FY26: Sales 3,519 vs 2,082 (+69%), EBITDA 1,021 vs 582 (+75%), PBT 877 vs 490 (+79%), PAT 650 vs 361 (+80%). HYFY27 vs HYFY26: Sales 7,187 vs 4,237 (+70%), EBITDA 2,045 vs 1,146 (+78%), PBT 1,789 vs 970 (+84%), PAT 1,316 vs 714 (+84%).
Left two-thirds holds two stacked comparison panels (quarter and half year), each with column headers Sales / EBIDTA / PBT / PAT, the current figure in orange above a green up-arrow with the growth percentage and the prior-year figure in blue below. Right third is a blue-and-gold painting of a hand pointing at a rising bar chart.
Q2FY27 P&L versus Q1FY27 and Q2FY26 (Rs. crore): Net sales 3,519 (Q1FY27 3,668; Q2FY26 2,082; +69% YoY); material consumed 1,676 (47.63% of sales vs 47.44%); employee cost 266 (7.57% vs 9.35%); other expenses 571 (16.22% vs 16.66%); EBITDA 1,021 with margin 29.02% vs 27.95% (+1.07 pts); depreciation 88; interest/finance 55; PBT 877 (24.94% margin); tax 227; PAT 650 (18.47% vs 17.36%, +80% YoY). Sales eased about 4% quarter on quarter from Q1FY27, while margins improved.
Full-width table with a textured copper header row. Left block shows absolute values for Q1FY27, Q2FY27 (bold) and Q2FY26 plus % change; right block shows each line as % of net sales for the same three periods and the change in percentage points, negatives in parentheses.
Sales by customer segment (Rs. crore). Q2FY27: Domestic explosives 963 (27%), international explosives 1,515 (43%), defence 1,002 (29%), others 39 (1%), total 3,519. Q1FY27: 1,361 / 1,364 / 933 / 10, total 3,668. Q2FY26: 597 / 963 / 506 / 16, total 2,082. YoY growth: domestic +61%, international +57%, defence +98%, others +144%, total +69%.
Table across the top with segment rows and columns for Q1FY27, Q2FY27 and Q2FY26 (value and % of sales) plus YoY change; below it three donut charts side by side for Q1FY27, Q2FY27 and Q2FY26 with segment percentages on the rings.
H1 FY27 vs H1 FY26 P&L (Rs. crore): net sales 7,187 vs 4,237 (+70%); material consumed 3,533 (49.16% vs 49.15%); employee cost 522 (7.26% vs 8.93%); other expenses 1,111 (15.46% vs 16.25%); EBITDA 2,045 vs 1,146 (+78%, margin 28.45% vs 27.05%); depreciation 168; interest/finance 97; PBT 1,789 vs 970 (+84%, 24.89% margin); tax 473; PAT 1,316 vs 714 (+84%, 18.32% vs 16.85%).
Same table design as the quarterly result slide: absolute values for HYFY27 (bold) and HYFY26 with % change on the left, line items as % of net sales and the change in percentage points on the right.
H1 sales by customer segment (Rs. crore). HYFY27: domestic explosives 2,324 (32%), international explosives 2,879 (40%), defence 1,935 (27%), others 49 (1%), total 7,187. HYFY26: 1,495 (35%), 1,789 (42%), 925 (22%), 28 (1%), total 4,237. YoY: domestic +55%, international +61%, defence +109%, others +82% as printed, total +70%.
Segment table on top (HYFY27 and HYFY26 values and shares, YoY change) with two donut charts below for HYFY27 and HYFY26.
Total order book of Rs. 20,178 crore, split into Rs. 2,610 crore from Coal India (CIL) and Singareni Collieries (SCCL) and Rs. 17,568 crore from defence — defence is roughly 87% of the backlog.
Headline total top left; in the upper right, circular badges with the Coal India and SCCL logos and a drone image, each captioned with its order value; the bottom half is a wide painted banner contrasting an open-cast mine and a worker in a SOLAR hard hat with a truck-mounted rocket launcher firing.
Balance sheet metrics, HYFY27 vs FY26: net debt Rs. 1,177 crore vs Rs. 867 crore; net debt/equity 0.15 vs 0.13; net debt/EBITDA 0.29 vs 0.32; capex Rs. 873 crore in H1 FY27 vs Rs. 1,556 crore for FY26; working capital days 108 vs 130.
A single centered three-column table (Particulars, HYFY27 in bold, FY26) with the copper header and beige label column, lots of white space around it.
Promoter holding 73.15% as of September 30, 2026. Non-promoter holdings (%): mutual funds & AIF 12.35, public & others 7.07, FII & FPI 6.13, other bodies corporate 0.77, insurance companies 0.53. Mutual fund detail: SBI-MF 3.76, Kotak Fund 2.60, Axis 1.14, others 4.85.
Left side: title, promoter-holding line and a five-bar column chart with values above each bar, followed by an orange-to-yellow 'Mutual Funds' banner and a line listing the largest fund holders. Right side: a painted image of a curving glass building in blue and sunset tones.
Closing slide with the tagline 'Power to Propel' and 'Thank You'.
Diagonal split mirroring the cover: left side is a painting of haul trucks on a winding open-pit mine road at sunset with the outlined pinwheel emblem and the tagline in white; right side is a light textured panel with the SOLAR logo top and 'THANK YOU' bottom right.
Common questions about this slide and the underlying presentation content.
It is Solar Industries India Limited's 10-slide 'Rise & Shine' board presentation for Q2FY27 and HYFY27, filed with BSE/NSE. It covers the quarter ended September 30, 2026 and the half year ended the same date, with figures in Rs. crore.
Indian companies use an April–March financial year. Q2 FY27 is July–September 2026 and H1 (HY) FY27 is April–September 2026. The comparison periods, Q2 FY26 and H1 FY26, are the same months of 2025.
Net sales were Rs. 3,519 crore (+69% YoY), EBITDA Rs. 1,021 crore (+75%, 29.02% margin), PBT Rs. 877 crore (+79%) and PAT Rs. 650 crore (+80%). For H1 FY27, net sales were Rs. 7,187 crore and PAT Rs. 1,316 crore.
The deck shows a total order book of Rs. 20,178 crore: Rs. 17,568 crore from defence and Rs. 2,610 crore from Coal India (CIL) and Singareni Collieries (SCCL).
In Q2 FY27, international explosives were 43% of sales (Rs. 1,515 crore), defence 29% (Rs. 1,002 crore), domestic explosives 27% (Rs. 963 crore) and others 1%. Defence sales grew 98% year on year in the quarter and 109% in the half year.
Yes. It is a compact model of an Indian results deck: a headline snapshot, P&L tables with margins as % of net sales, segment mix tables with donut charts, order book, leverage and capex, and shareholding. You can download the PDF for reference or create a similar deck with 2Slides.
Solar Industries India Limited filed it with the BSE and NSE stock exchanges alongside its Q2 FY27 results. This version has the exchange cover letter removed and contains only the 10 presentation slides.

Create Your Own Slides
Turn your ideas into professional presentations in seconds with 2slides AI.
Reference professional designs, choose your style, and generate slides with perfect text rendering. Powered by Nano Banana—start creating your presentation now.
Your AI Agent for slides. Save time, shine faster with intelligent presentation creation.


© 2026 2slides. All rights reserved.