
Part of Investor presentation examples · Japanese investor presentation examples
SMC H1 FY2026 Earnings Presentation — SMC Corporation (TSE 6273), the pneumatic and automation components maker, reports results for the six months to September 2026 (fiscal year ending March 2027, Q2), dated November 13, 2026. This is a Japanese-language deck whose original was published on TDnet (Tokyo Stock Exchange timely disclosure). H1 net sales rose 38.3% year on year to ¥553.6 billion (5,536 ¥100 million / 億円), operating profit rose 74.0% to 1,579 億円 (28.5% margin), a record half-year, and the full-year guidance was raised to sales of 10,730 億円 and operating profit of 2,940 億円.
Uses this deck’s cover as a style reference for slides made from your own content. Or pick any page below to use its layout as the reference.
Quick Navigation
Tags
Share the slides
SMC H1 FY2026 Earnings Presentation — SMC Corporation (TSE 6273), the pneumatic and automation components maker, reports results for the six months to September 2026 (fiscal year ending March 2027, Q2), dated November 13, 2026. This is a Japanese-language deck whose original was published on TDnet (Tokyo Stock Exchange timely disclosure). H1 net sales rose 38.3% year on year to ¥553.6 billion (5,536 ¥100 million / 億円), operating profit rose 74.0% to 1,579 億円 (28.5% margin), a record half-year, and the full-year guidance was raised to sales of 10,730 億円 and operating profit of 2,940 億円.
Detailed view of each slide page, including layout, key content and visual elements.
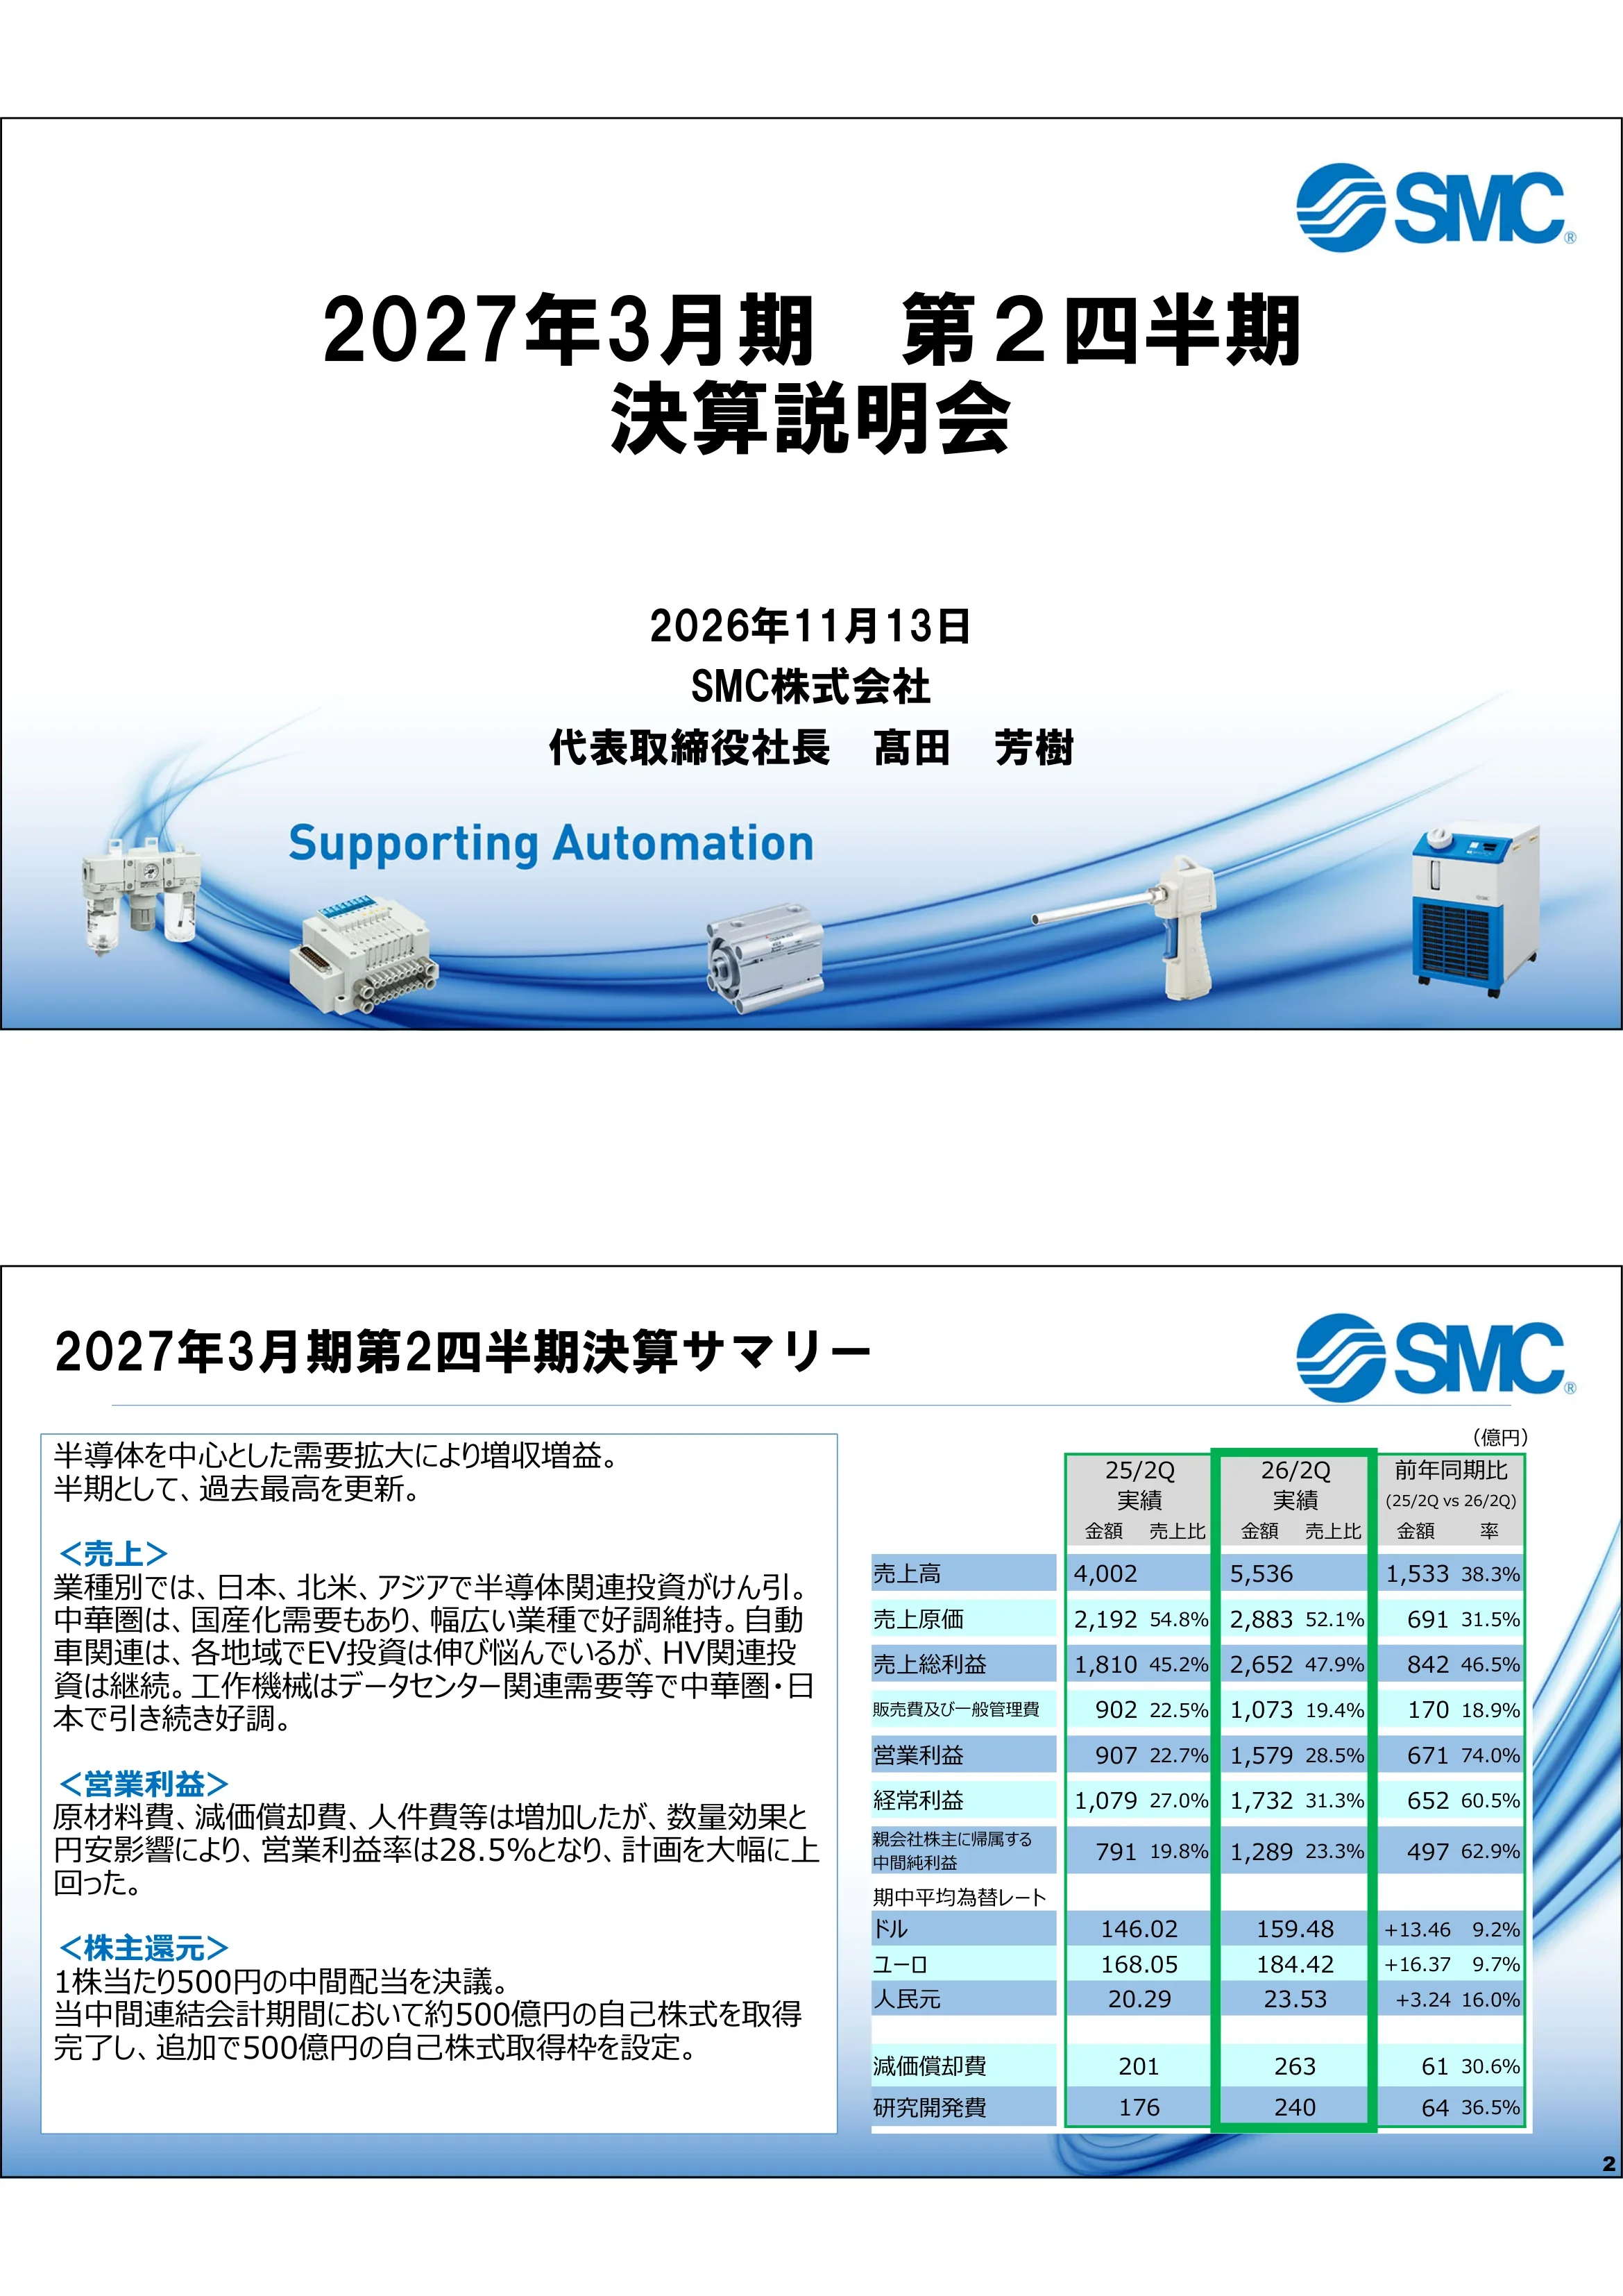
Cover for the results briefing of the fiscal year ending March 2027, second quarter, dated November 13, 2026, presented by SMC Corporation's President and Representative Director, Yoshiki Takada. Tagline 'Supporting Automation'.
Centered title and presenter block on white, SMC logo top right, blue swoosh band along the bottom with product photos.
Higher sales and profit on expanding demand centred on semiconductors; a record for a half-year. Net sales 5,536 億円 vs 4,002 (+1,533, +38.3%); cost of sales 2,883 (52.1%); gross profit 2,652 (47.9% vs 45.2%); SG&A 1,073; operating profit 1,579 (28.5%) vs 907, +74.0%; ordinary profit 1,732 (+60.5%); interim net income attributable to owners 1,289 (+62.9%). Average FX: USD 159.48 (vs 146.02), EUR 184.42 (vs 168.05), CNY 23.53 (vs 20.29). Depreciation 263, R&D 240. Narrative: semiconductor investment led in Japan, North America and Asia; Greater China strong across industries helped by localisation demand; automotive EV investment sluggish but HV investment continued; machine tools strong on data-centre demand. Operating margin of 28.5% far exceeded plan despite higher materials, depreciation and labour costs, helped by volume and weak yen. Interim dividend of ¥500 per share; about 500 億円 of own shares acquired in the period and a further 500 億円 buyback authorization set.
Two-column: left text box with headed sections (Sales, Operating profit, Shareholder returns); right comparison table with H1 FY25, H1 FY26 (highlighted in green) and YoY columns.
Full-year forecast revised upward based on Q2 progress. Revised guidance vs current guidance vs FY25 actual: net sales 10,730 / 10,000 / 8,425 億円; gross profit 5,100 (47.5%) / 4,490 / 3,814; SG&A 2,160 / 2,300 / 1,908; operating profit 2,940 (27.4%) / 2,190 / 1,905; ordinary profit 3,250 / 2,390 / 2,355; net income 2,380 / 1,700 / 1,673. FX assumptions USD 158.00, EUR 181.00, CNY 23.60. Capex 1,000, depreciation 623, R&D 470 unchanged; annual dividend ¥1,000 per share. Outlook: semiconductors expected to see high orders in H2; automotive EV in Greater China slowing slightly; machine tools strong on data centres. By region: Japan led by semiconductors; North America semiconductor and data-centre capex continues; Greater China semiconductor localisation, while secondary-battery investment slows; Other Asia semiconductor investment in Korea, Singapore, Malaysia; Europe recovering via semiconductors, electrical machinery and food machinery after German automotive/machinery stagnation. Production: headcount increases at plants; supplier BCP advancing.
Two-column: left narrative box (industry, regional, production/procurement trends); right table with three year columns, revised guidance outlined in red.
Medium/long-term priorities: (1) sales strategy leveraging strengths for growth and share gains — broad global footprint, wide product range and short lead times; (2) proactive investment to differentiate — steady supply-capacity investment regardless of cycle, multi-site production for a resilient supply system, human-capital investment; (3) development system for customer-required performance — fast development, compact/lightweight and eco-friendly products, products and services that help customers cut CO2. FY2026 initiatives: Sales — Deeper Penetration, expanding sales force, strengthening supply; Manufacturing — production strategy for innovation and business expansion, sustainability contribution, BCP evolution; Development — faster development, cost reduction, global collaboration and talent.
Two side-by-side bordered boxes: numbered underlined headings with bullets on the left; three category lists (Sales, Manufacturing, Development) on the right.
FY2025 regional shares broadly flat, with share gains in fiercely competitive Greater China centred on the high end. Share (%) '21→'25: Japan 63, 62, 62, 62, 62; North America 32, 33, 34, 32, 33; Europe 23, 23, 22, 22, 22; Greater China 43, 40, 36, 35, 36; Other Asia 55, 53, 53, 54, 54; World 39, 37, 35, 35, 36. USD/JPY rates shown per year: 112.39, 135.56, 144.58, 152.59, 150.64. Greater China defined as China, Taiwan, Hong Kong.
Single-line summary box above a centered five-year table with region rows and a world total row.
Of the 1,000 億円 capex plan, 328 億円 was completed by Q2, including warehouse buildings at domestic plants and the CTC (China New Technology Center). Next year's capex is also expected to be just under 1,000 億円. Plan vs Q2 actual: manufacturing Japan 347 / 110 (Soka, Shimotsuma, Tsukuba, Tono plants and others); manufacturing overseas 296 / 127 (Vietnam, China Tianjin/Beijing, Singapore); HQ/R&D/sales/logistics Japan 66 / 27 (JTC and others); overseas 291 / 64 (SMC China sales, Taiwan, Australia, Germany, Europe warehouse, Romania).
Summary text box above a centered matrix table: purpose and region rows against FY2026 plan and Q2 actual columns with project lists; totals in lime cells.
Policy of stable dividends combined with flexible share buybacks. A 500 億円 buyback authorization was set at the November 13, 2026 board meeting. FY2026 buybacks: May 14 resolution 500 億円 (completed in September); November 13 resolution 500 億円, giving a total payout ratio of 68.1% if fully executed. Dividend per share chart: ¥400 (2018), 400, 500, 750, 900, 950, 1,000 (2024), 1,000 (2025), 1,000 (2026 plan). Shareholder return chart (億円) shows dividends and buybacks with total payout and dividend payout ratio lines, 2018–2026; FY2026 shown as 1,000 億円 of buybacks with a 26.1% dividend payout and 68.1% total payout. Several bar and line labels in the right-hand chart overlap, so some individual year values cannot be read with certainty.
Text box at top; two charts below — a single-series bar chart on the left and a combined stacked bar/dual-line chart on the right.
Brand interstitial closing the management section: SMC logo and 'Supporting Automation' tagline; no data.
Centered logo on white with sweeping blue ellipse graphics.
Cover for the detailed results materials dated November 13, 2026, presented by Kyoichi Miyazaki, Director, Executive Officer, General Manager of Administration Division and Accounting Department.
Same template as the main cover: centered title and presenter, product photos along the bottom.
Detailed P&L table. H1 FY25 vs H1 FY26: sales 4,002 → 5,536 (+38.3%); operating profit 907 → 1,579 (+74.0%). Full-year plan (pre-revision): sales 10,000, operating profit 2,190. Standalone quarters: Q1 sales 2,709, Q2 2,826 (+116, +4.3% QoQ); gross profit 1,269 (46.8%) → 1,383 (49.0%); operating profit 739 (27.3%) → 839 (29.7%), +13.5%; ordinary profit 917 → 814 (−11.3%); net income 678 → 611 (−9.9%). Q2 average FX: USD 159.40, EUR 183.43, CNY 23.63. Progress vs plan: depreciation 263 of 623 (42.3%), R&D 240 of 470 (51.1%).
Wide multi-column table: green-outlined YoY block on the left, plan column in the middle, red-outlined quarterly block on the right.
Sales bridge 4,002 → 5,536 (+1,533 億円): volume +1,039, price +23, FX +461, consolidation scope +10. Volume +26.0% YoY: Japan +167 (+21%), North America +61 (+12%), Europe +77 (+10%), Greater China +505 (+42%), Other Asia +226 (+37%). Price +0.6% (Japan +19, overseas +4). FX +11.5% (North America +62, Europe +73, Greater China +247). Operating profit bridge 907 → 1,579 (+671): volume +469, price +23, FX +302, inventory valuation −4, processing/materials/other −31, SG&A −88. FX split: transaction +194, translation +107. SG&A: personnel −30, logistics −24, R&D −12. Note that a US tariff refund was allocated as a negative to cost of sales, reducing cost.
Two stacked horizontal waterfall charts on the left (sales, operating profit) with explanatory text boxes on the right.
Sales 2,709 → 2,826 (+116 億円): volume +94, price +7, FX +5, consolidation scope +10. Volume +3.5% vs Q1: Japan +24 (+5%), North America +29 (+9%), Europe +7 (+2%), Greater China +2 (±0%), Other Asia +24 (+6%). Price +0.3% (Japan −4, overseas +12). FX +0.2% (North America ±0, Europe −6, Greater China +5). Operating profit 739 → 839 (+99): volume +43, price +7, FX +40, inventory valuation ±0, processing/materials/other +17, SG&A −8 (taxes and dues). FX split: transaction +11, translation +29.
Same two-waterfall layout as page 11 with commentary boxes on the right.
Quarterly sales (億円) from FY25 Q2 to FY26 Q2. Consolidated: 2,000, 2,096, 2,326, 2,709, 2,826. Japan 395→486; North America 259→341; Europe 377→459; Greater China 595, 658, 689, 967, 987; Other Asia 310→477. Sales mix: Japan 17%, North America 12%, Europe 16%, Greater China 35%, Other Asia 17%. Industry mix of consolidated sales: semiconductor rose from 19% to 28%; automotive fell from 17% to 14%. Greater China semiconductor share 35% in FY26 Q2; Other Asia 43%. Manufacturing bases: Soka and others (6 plants), Indiana (US), Czech Republic, Beijing/Tianjin, Vietnam/Singapore/India. FX sensitivity (annualised operating-profit impact of a 1% move): total 48.3 億円; USD 1.5, EUR 9.2, CNY 19.3, KRW 5.5 億円.
Grey step-bar charts per region across the top; dense table below with quarterly sales, industry mix percentages, bases and FX sensitivity.
FY25 end vs FY26 Q2 (億円): total assets 23,118 → 23,601 (+2.1%); current assets 15,042 → 15,844, incl. cash 6,638 → 6,891, receivables 2,353 → 2,890, securities 478 → 466, inventories 5,066 → 5,181; fixed assets 8,075 → 7,756; liquid assets 8,278 → 8,118; liabilities 1,965 → 2,088; net assets 21,152 → 21,513. Equity ratio 91.5% → 91.1%; BPS ¥33,498 → ¥34,509; ROE 8.3% → 6.0% (12.1% annualised). Inventory detail: finished goods 1,984 → 1,889, WIP 332 → 367, raw materials 2,749 → 2,924; underlying change 100 after scope (+8), FX (−3) and valuation (+8) effects. Inventory months: average 7.2 → 5.6, period-end 5.9 → 5.5. Period-end FX: USD 157.33, EUR 178.30, CNY 23.45.
Main balance-sheet table on the left; inventory breakdown, inventory-turn and FX tables on the right linked by a red arrow.
Revised FY2026 guidance vs FY25 actual and vs current guidance: sales 10,730 (+2,304 / +27.4% vs FY25; +730 / +7.3% vs prior guidance); gross profit 5,100 (+610 vs guidance); SG&A 2,160 (−140); operating profit 2,940 (+1,034 / +54.3%; +750 / +34.2%); ordinary profit 3,250 (+860 vs guidance); net income 2,380 (+706 / +42.3%; +680 / +40.0%). FX assumption changes: USD +3.00 to 158.00, EUR −2.00 to 181.00, CNY +0.90 to 23.60. Capex 1,000 (−502 vs FY25), depreciation 623, R&D 470, dividend ¥1,000 unchanged.
Five-column comparison table with the revised guidance column outlined in red.
Four waterfalls. (1) Sales vs FY25: 8,425 → 10,730 (+2,304): volume +1,639, price +40, FX +595, scope +30. (2) Operating profit vs FY25: 1,905 → 2,940 (+1,034): volume +742, price +40, FX +380, inventory valuation −41, processing/materials/other +63, SG&A −150. (3) Sales vs current guidance: 10,000 → 10,730 (+730): volume +441, price ±0, FX +259, scope +30. (4) Operating profit vs current guidance: 2,190 → 2,940 (+750): volume +203, price ±0, FX +120, inventory valuation ±0, processing/materials/other +267, SG&A +160.
2×2 grid of horizontal waterfall charts with circled-number headings.
Stacked bars by region (億円): FY25 actual 1,502 (Japan 1,099, North America 19, Europe 34, Asia 340, other 10); FY26 plan 1,000 (Japan 413, North America 52, Europe 75, Asia 421, other 39); FY26 actual to Q2 328 (Japan 137, North America 9, Europe 33, Asia 142, other 7). Right-hand table repeats the plan vs Q2 actual project breakdown from page 6 (347/110, 296/127, 66/27, 291/64).
Stacked column chart on the left, project matrix table on the right.
Order index by industry, FY26 / Q1 / Q2 / October 2026: semiconductor/electrical 185 / 173 / 191 / 205 (Greater China and Other Asia up, Japan and North America levelling off); automotive 112 / 115 / 110 / 111; machine tools 121 / 119 / 118 / 134; food 108 / 111 / 105 / 109; medical 112 / 111 / 108 / 125; other 116 / 113 / 116 / 128. By region: Japan 138 / 127 / 140 / 147; North America 127 / 121 / 132 / 135; Europe 109 / 109 / 107 / 119; Greater China 159 / 156 / 157 / 174; Other Asia/Oceania 149 / 146 / 149 / 158; consolidated 140 / 135 / 140 / 151. October commentary per row (e.g., Europe: semiconductors down, medical up).
Bordered grid table: industry block on top, region block below, with an October commentary column.
Monthly line chart, October 2024 to October 2026, FY25 = 100 at fixed FX, for semiconductor/electrical, machine tools, medical, automotive and food. Semiconductor/electrical climbs from roughly 80–90 in FY24 to above 200 by late 2026, while the other industries range roughly between 90 and 130. Individual monthly points are not labelled; values can only be estimated from the gridlines.
Single large line chart on a pale-yellow plot area with fiscal-year dividers and coloured series labels at the right end.
Monthly line chart, October 2024 to October 2026, FY25 = 100 at fixed FX, for Greater China, Other Asia/Oceania, Japan, North America and Europe. All regions rise from early 2026; Greater China shows a sharp spike in April 2026 and ends highest, Europe remains lowest. Points are unlabelled, so monthly values are approximate only (exact September–October figures are on page 21).
Single line chart on pale-yellow background with fiscal-year dividers and region labels at the right.
Order index July / August / September / October 2026. Industry: semiconductor/electrical 172 / 200 / 202 / 205; automotive 116 / 99 / 113 / 111; machine tools 114 / 114 / 127 / 134; food 110 / 94 / 108 / 109; medical 104 / 98 / 121 / 125; other 112 / 111 / 123 / 128. Region: Japan 123 / 141 / 160 / 147; North America 143 / 120 / 131 / 135; Europe 105 / 96 / 118 / 119; Greater China 149 / 155 / 167 / 174; Other Asia/Oceania 138 / 151 / 158 / 158; consolidated 134 / 136 / 150 / 151.
Two simple bordered tables stacked on the left half; decorative blue swoosh on the right.
Disclaimer that forecasts are based on information available at the date of publication and involve risks and uncertainties, so actual results may differ materially. Closes with 'Thank you for your attention.'
Centered paragraph and closing line above the product-photo band used on the cover slides.
Common questions about this slide and the underlying presentation content.
The slides are in Japanese. It is SMC Corporation's results briefing material (決算説明会資料) for the six months to September 2026, originally published on TDnet, the Tokyo Stock Exchange timely disclosure system, on November 13, 2026. The page-by-page notes here translate the slide titles and key figures into English.
Net sales were 5,536 億円 (¥100 million units), up 38.3% year on year, and operating profit was 1,579 億円, up 74.0%, for a 28.5% operating margin. The company describes it as a record half-year driven mainly by semiconductor-related demand.
Yes. Guidance for the year ending March 2027 was raised from sales of 10,000 億円 and operating profit of 2,190 億円 to 10,730 億円 and 2,940 億円, with net income raised from 1,700 to 2,380 億円. The annual dividend forecast stays at ¥1,000 per share.
Most financial figures are in ¥100 million (億円), so 5,536 億円 equals about ¥553.6 billion. Order trends are indices with FY2025 = 100 at fixed exchange rates, and market share figures are percentages.
SMC paid an interim dividend of ¥500 per share, completed a 500 億円 buyback in September, and authorized another 500 億円 buyback on November 13, 2026. If that is fully executed, the total payout ratio would be 68.1%.
Pages 18–21 show order indices by industry and region, monthly through October 2026, with semiconductor/electrical at 205 in October. Page 13 shows quarterly sales by location and industry mix, and page 5 shows SMC's market share by region.
Yes, as a structural reference. It follows a common Japanese IR pattern: a summary slide, a guidance slide, strategy, capex and returns, then a data appendix with the P&L, bridge charts, balance sheet and order indicators. The content and branding belong to SMC, so build your own deck with your own data.

Create Your Own Slides
Turn your ideas into professional presentations in seconds with 2slides AI.
Reference professional designs, choose your style, and generate slides with perfect text rendering. Powered by Nano Banana—start creating your presentation now.
Your AI Agent for slides. Save time, shine faster with intelligent presentation creation.


© 2026 2slides. All rights reserved.