
Part of Investor presentation examples · E-commerce presentation examples
Shopify Q3 2026 Investor Presentation: the 28-page investor deck Shopify (NASDAQ/TSX: SHOP) published on shopify.com/investors on November 3, 2026 with its third-quarter 2026 results. It covers $119B GMV (+30% YoY in constant currency), $3.7B revenue (+32% constant currency), $1.8B gross profit (+28%), a 22% free cash flow margin, more than 14% US ecommerce market share, a timeline of AI agent and connector launches, merchant cohort charts, and GAAP to non-GAAP reconciliations.
Uses this deck’s cover as a style reference for slides made from your own content. Or pick any page below to use its layout as the reference.
Quick Navigation
Tags
Share the slides
Shopify Q3 2026 Investor Presentation: the 28-page investor deck Shopify (NASDAQ/TSX: SHOP) published on shopify.com/investors on November 3, 2026 with its third-quarter 2026 results. It covers $119B GMV (+30% YoY in constant currency), $3.7B revenue (+32% constant currency), $1.8B gross profit (+28%), a 22% free cash flow margin, more than 14% US ecommerce market share, a timeline of AI agent and connector launches, merchant cohort charts, and GAAP to non-GAAP reconciliations.
Detailed view of each slide page, including layout, key content and visual elements.
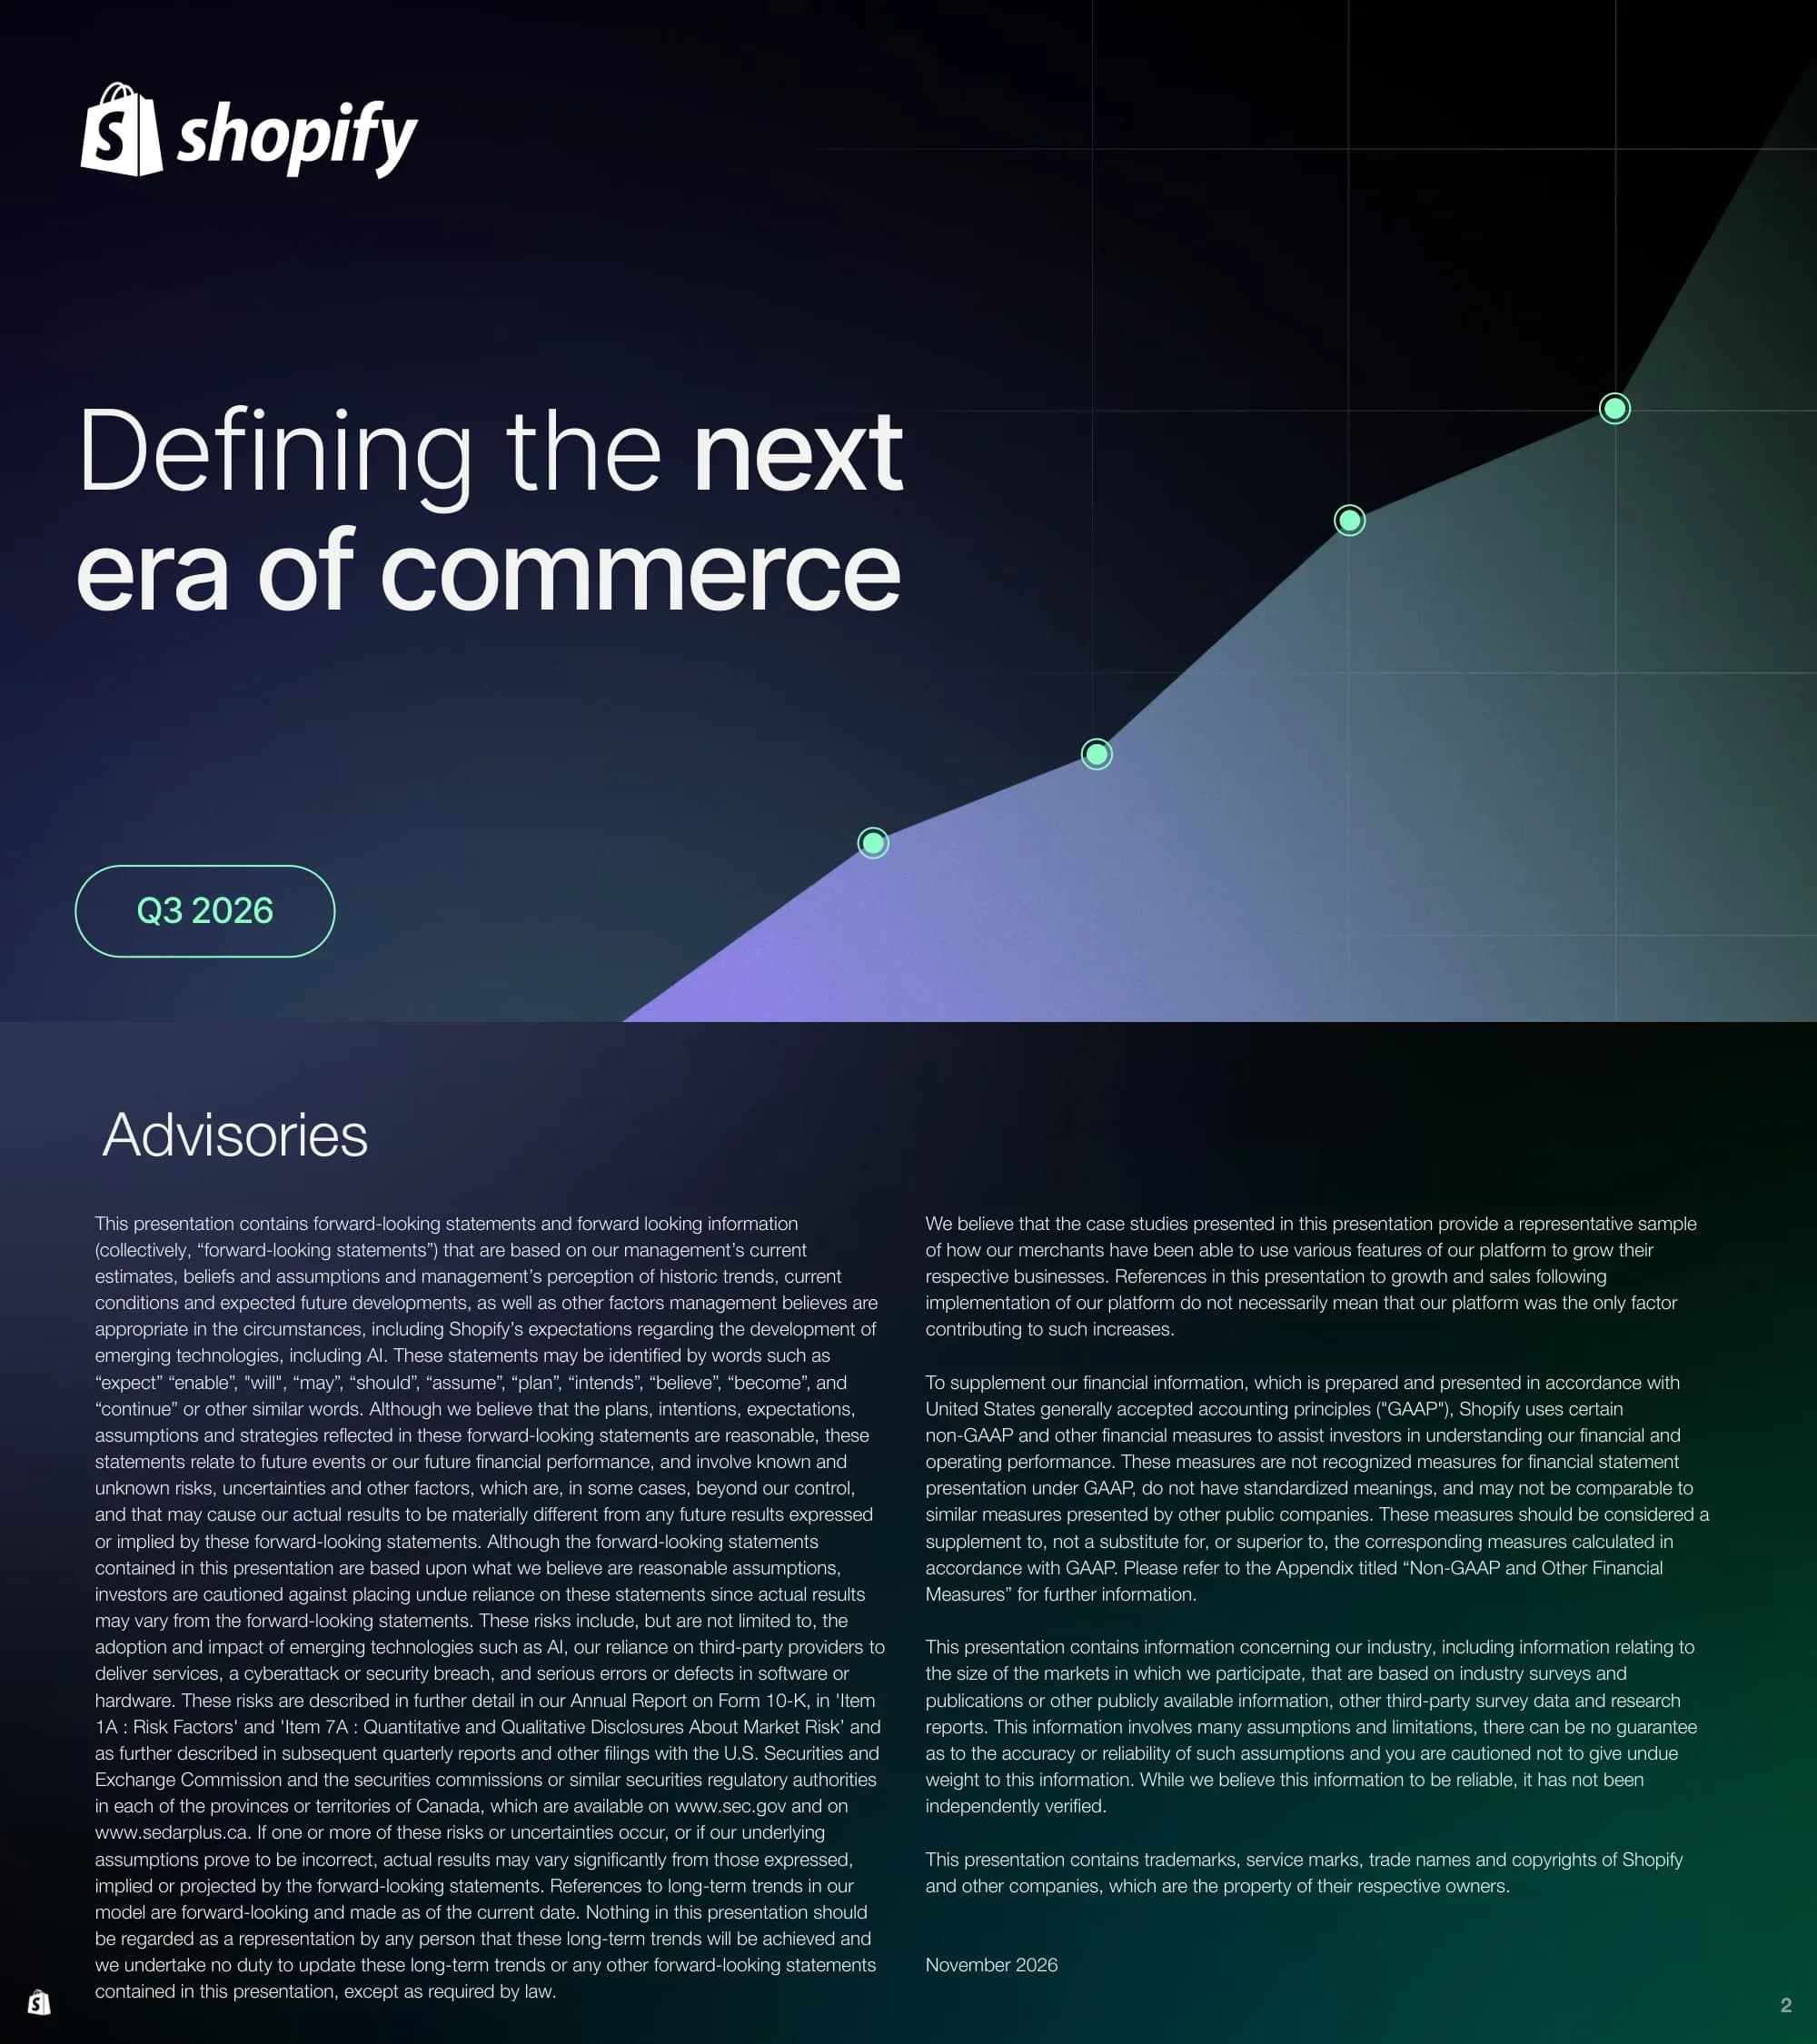
Title slide with the Shopify logo, the headline 'Defining the next era of commerce' and a 'Q3 2026' pill label.
Full-bleed dark navy background with the logo top left, a large two-line headline at left center, and a rising area chart with four glowing green data points filling the lower right.
Legal disclaimer covering forward-looking statements (including expectations about AI and other emerging technologies, risk factors in the Form 10-K, filings on sec.gov and sedarplus.ca), merchant case studies, use of non-GAAP measures, third-party market data and trademarks; dated November 2026.
Two-column body text on a dark gradient background under a left-aligned 'Advisories' heading, with the page number at bottom right.
Quarter highlights: a quote from President Harley Finkelstein ('In Q3, we powered $119 billion in GMV...'), Q3 launched brands (BevMo!, Canada Goose, The Body Shop, MAC, lululemon) and six KPIs: $1.9T cumulative GMV since inception, $3.7B revenue (+32% YoY constant currency), $1.8B gross profit (+28% YoY), $119B GMV (+30% YoY constant currency), 22% free cash flow margin, and more than 14% US ecommerce market share based on 2025 US Census data.
Split layout: left panel holds the quote and a brand logo grid; right panel has a strip of four black-and-white merchant photos above a 2x3 KPI grid separated by dotted lines, with footnotes at the bottom.
Shopify positioned as a Unified Commerce Hub at the center of eight channels: Online, Offline, B2B, Social Commerce, Marketplaces (Amazon, eBay), Shop App, AI Channels (ChatGPT, Perplexity, Meta, Microsoft Copilot and others) and Shoppable Agentic Experiences.
Left-aligned headline; on the right a large circular wheel diagram divided into dotted segments around a glowing central Shopify hub, set in concentric purple rings.
In 2025 entrepreneurs on Shopify generated more than $1.2 trillion in economic activity, up 110% from 2022, broken down by country: USA $688B, UK $94B, Australia $70B, Germany $49B, Canada $43B, France $25B, Japan $21B, Spain $13B, Italy $13B and rest of the world $221B; plus 9.6+ million jobs supported (+193% from 2022). Source: The Entrepreneur Effect.
Headline and subtitle across the top, a packed bubble chart sized by country value in the middle, and a single large statistic below a dotted divider.
Section opener for Platform Highlights with the statement 'Shopify is the best place to start, build, and manage a business with agents.'
Full-bleed purple-to-teal gradient with a green outlined section pill at top left, Shopify bag icon at top right, and a large three-line statement at the bottom left.
Five-stage progression of AI agent experiences for merchants: Chat (advice only, work happens in Admin), Connector integrations (reads and changes the store from chat), Visual widgets (interactive Shopify cards in the chat), Cross-platform plugins (Shopify alongside other tools in one workflow) and Rich visual experiences (Shopify's own interface inside the agent), each illustrated with a mock chat screen.
Two-line headline over five white rounded cards in a row showing UI mockups, with labels and one-line descriptions underneath linked by green arrows.
Monthly timeline of 2026 AI launches from April to October, including AI Toolkit (Apr 9), ChatGPT plugin and Claude connector (May 4), Perplexity connector (May 26), Replit, Manus and v0 (Jun 4), Preview Stores in Shopify CLI (Jul 9), Claude Commerce Agents (Sep 2), ChatGPT Small Business Plugin (Sep 8), Claude for Small Business (Sep 15), Canvas (Oct 1), Grok, Gemini and Microsoft Copilot connectors, Hydrogen GA (Oct 14) and mock.shop (Oct 26); 15 launches in 8 weeks across September and October, with 'Canvas in agents' coming soon.
Headline and subtitle at top; a stepped bar timeline along a month axis where each bar lists dated launches, bars grow taller toward September and October, and a dotted 'Coming soon' box at the right.
AI impact metrics for Shopify merchants as of Q3 2026, sourced from Shopify global search API usage: 2.6x increase in AI traffic to merchant storefronts YoY, 3.3x increase in orders originating from AI searches YoY, 2x new buyer order rate versus other online channels, and +64% better conversion from AI-referred sessions than organic search.
Headline and subtitle at top left with four green gradient cards rising in height from left to right like a staircase, connected by dotted lines.
Section opener for Quarterly Financials with the statement 'When our merchants are more successful, Shopify is more successful.'
Full-bleed navy-to-teal gradient with a green outlined section pill at top left and a large statement at bottom left.
Quarterly GMV from Q1 2023 ($50B) to Q3 2026 ($119B), with Q4 2025 at $124B and Q3 2026 growth of +29% reported and +30% in constant currency; quarterly revenue from $1.5B in Q1 2023 to $3.7B in Q3 2026 (+32% reported and constant currency), split into Merchant Solutions (78%) and Subscription Solutions (22%). Both charts carry YoY growth rows in reported and constant currency for every quarter.
Two-panel chart: purple bar chart of GMV on the left and a stacked area chart of revenue on the right, each with two rows of YoY growth percentages beneath the axis.
Quarterly revenue of the Q1 2015 merchant cohort (excluding Logistics) from 2015 to 2026, showing 3.4x growth and a 12% CAGR, where growth compares the last four quarters ending Q3 2026 with the cohort's first four full quarters (Q2 2015 to Q1 2016).
Headline and subtitle at top left, a dark callout box with the 3.4x / 12% CAGR figures, and a full-width mint green bar chart with year markers along the bottom.
Revenue retention curves for the Q1 cohorts of 2015 through 2026 plotted by age in quarters (1 to 46), showing older and newer cohorts alike growing revenue over time with seasonal Q4 peaks; the y-axis is relative revenue growth with no absolute values.
Multi-line chart filling the slide with a 12-item color legend across the top, age-in-quarters x-axis and a rotated y-axis label.
YoY GMV growth in constant currency from Q1 2023 to Q3 2026 for Europe, North America and total: in Q3 2026 Europe grew 33%, North America 28% and total GMV 30%; Europe peaked at 42% in Q2 and Q3 2025.
Three-line chart with data labels on every point, legend at top left and an axis caption at the bottom.
Gross Payments Volume (GMV processed through Shopify Payments) grew from $36B in Q1 2024 to $81B in Q3 2026, with GMV penetration rising from 60% to 68% (61%, 62%, 64%, 64%, 64%, 65%, 68%, 67%, 68% in the quarters between).
A widening cone-shaped gradient band running left to right from a small $36B circle to a large $81B circle, with quarterly penetration percentages on vertical stems below.
Subscription Solutions revenue grew from $382M in Q1 2023 to $836M in Q3 2026 (+20% YoY), shown as a mix of Standard plans (52% in Q3 2026), Shopify Plus (28%) and apps, themes, domains and variable platform fees (20%).
15 stacked columns with percentage labels in each segment, legend across the top and highlighted value bubbles over the first and last columns.
Quarterly gross profit from $717M in Q1 2023 (+13%) to $1.8B in Q3 2026 (+28%), with gross margin for each quarter ranging from 46.1% (Q4 2025) to 52.6% (Q3 2023); Q3 2026 gross margin was 47.6%.
Purple gradient bar chart with value and growth labels above each bar, dotted year separators, and a gross margin row along the bottom.
Operating expenses excluding one-time items as a percentage of revenue, grouped by quarter across years: Q1 fell from 60% (2023) to 37% (2026), Q2 from 48% to 34%, Q3 from 43% to 32%, and Q4 from 36% (2023) to 29% (2025).
Four groups of mint gradient bars separated by dotted lines, with a dotted downward trend arrow across the top and a caption under the chart.
Adjusted operating expenses as a share of revenue fell from 33% in Q3 2024 and Q3 2025 to 29% in Q3 2026; in Q3 2026 sales and marketing was 12%, research and development 11%, general and administrative 3% and transaction and loan losses 3%.
Three stacked columns for Q3 2024, Q3 2025 and Q3 2026 with segment labels on the left of each column and circled totals above connected by a dotted line.
Operating income rose from $1.1B (12% margin) in 2024 to $1.5B (13%) in 2025 and $2.1B (15%) for the last twelve months ended September 30, 2026; free cash flow rose from $1.6B (18% margin) to $2.0B (17%) and $2.7B (19%) over the same periods. A footnote explains that from April 2026 merchant cash advance cash flows are presented within investing activities, a $30 million net cash use in Q3 2026.
Two side-by-side bar charts divided by a vertical rule, green for operating income and purple for free cash flow, each with a margin line overlaid.
Closing statement: 'However commerce evolves, Shopify will be the engine behind it. The merchants who are the backbone of the economy demand it of us.', paired with a photo of the founder of merchant brand Merci Handy.
Split slide with a teal-blue gradient text panel on the left carrying a section pill and statement, and a full-height lifestyle photo with the brand wordmark on the right.
Appendix section divider introducing the non-GAAP and other financial measures that follow.
Full-bleed green-to-blue gradient with an 'Appendix' pill at top left and a large two-line title at the bottom.
Definitions of adjusted operating expenses, operating expenses excluding one-time items, operating leverage, free cash flow (cash from operations less capital expenditures) and free cash flow margin, with an explanation of why management uses them; dated November 2026.
Light gray background with a large dark heading and three justified paragraphs of body text.
Quarterly table in US$ millions from Q1 2023 to Q3 2026 reconciling GAAP sales and marketing and research and development to adjusted figures; in Q3 2026 GAAP sales and marketing was 466 and adjusted 453 (12% of revenue), and GAAP R&D was 497 and adjusted 393 (11% of revenue).
Full-width 15-column financial table on a light background with bold subtotal rows and heavy rules separating sections.
Continuation table covering general and administrative, transaction and loan losses and total operating expenses; in Q3 2026 GAAP operating expenses were 1,213 and adjusted operating expenses 1,067, or 29% of revenue. Q2 2023 shows the one-time 1,340 impairment on the sale of Shopify's logistics businesses.
Full-slide table without a title, same 15 quarterly columns, with line items for SBC, impairments, severance and litigation adjustments.
Table reconciling GAAP operating expenses to operating expenses excluding one-time items for Q1 2023 to Q3 2026, the basis of the operating leverage chart; the ratio fell from 60% of revenue in Q1 2023 to 32% in Q3 2026, with no one-time items in 2026.
Title above a shorter version of the same 15-column table occupying the top two-thirds of the slide.
Annual free cash flow from 2020 to 2025 (383, 485, (186), 905, 1,597 and 2,007 in US$ millions; 2025 margin 17% on revenue of 11,556) and quarterly figures from Q1 2023 to Q3 2026, with Q3 2026 operating cash flow of 818, capital expenditures of (2), free cash flow of 816 on revenue of 3,742 for a 22% margin.
Two stacked tables on a light background, an annual table on top and a 15-quarter table below, with footnotes on capital expenditures and the merchant cash advance presentation change.
Closing slide repeating the cover design with Shopify's mission line 'Make commerce better for everyone'.
Mirror of the cover: dark navy background, logo top left, large headline at left center and the rising area chart at lower right.
Common questions about this slide and the underlying presentation content.
It is the 28-page investor deck Shopify published on its investor relations site (shopify.com/investors) on November 3, 2026, alongside its third-quarter 2026 results. It summarizes the quarter, the AI and agentic commerce strategy, 15 quarters of financial charts, and a non-GAAP reconciliation appendix.
According to the deck, Shopify reported $119B in GMV (+30% YoY in constant currency), $3.7B in revenue (+32% in constant currency), $1.8B in gross profit (+28%), Gross Payments Volume of $81B (68% of GMV), Subscription Solutions revenue of $836M (+20%), and a 22% free cash flow margin ($816M of free cash flow on $3,742M revenue).
Pages 4 and 7 to 9 cover it. Shopify lists AI channels such as ChatGPT, Claude, Gemini, Perplexity and Microsoft Copilot, shows a timeline of 2026 AI and connector launches (15 in 8 weeks across September and October), and reports 2.6x more AI traffic to storefronts, 3.3x more orders from AI searches, a 2x new buyer order rate and 64% better conversion from AI-referred sessions than organic search.
The deck uses adjusted operating expenses, operating expenses excluding one-time items, operating leverage, free cash flow and free cash flow margin. Page 23 defines each one, and pages 24 to 27 reconcile them to GAAP figures quarter by quarter from Q1 2023 to Q3 2026, plus annual free cash flow from 2020 to 2025.
Yes. The original PDF is available as a free download from this page. An editable PowerPoint version is not attached for this deck.
It is a strong structural reference: a snapshot KPI page, a strategy section, section dividers, one chart per financial metric, cohort charts and a reconciliation appendix. You can follow the same order and design patterns, such as dark gradients, big numerals and pill-shaped section labels, or use 2Slides to generate a similar deck from your own data.
Page 12 tracks quarterly revenue from merchants who joined in Q1 2015, which reached 3.4x their first-year revenue (a 12% CAGR). Page 13 plots revenue retention curves for each Q1 cohort from 2015 to 2026 by age in quarters, showing that cohorts keep growing revenue over time.
Page 18 shows operating expenses excluding one-time items falling as a share of revenue, from 43% in Q3 2023 to 32% in Q3 2026. Page 19 breaks adjusted operating expenses down by category (29% of revenue in Q3 2026), and page 20 shows LTM operating income of $2.1B (15% margin) and free cash flow of $2.7B (19% margin).
Official investor relations site where Shopify publishes its quarterly results, investor presentations and SEC filings.

Create Your Own Slides
Turn your ideas into professional presentations in seconds with 2slides AI.
Reference professional designs, choose your style, and generate slides with perfect text rendering. Powered by Nano Banana—start creating your presentation now.
Your AI Agent for slides. Save time, shine faster with intelligent presentation creation.


© 2026 2slides. All rights reserved.