
Part of Investor presentation examples
Revvity Investor Day 2026 — Revvity's (NYSE: RVTY) 91-slide investor day presentation of November 13, 2026, themed 'Powering scientific intelligence', covering its Life Sciences and Diagnostics segments, Signals Software, AI-driven drug discovery, operating model, long-range plan and 2027 considerations.
Uses this deck’s cover as a style reference for slides made from your own content. Or pick any page below to use its layout as the reference.
Quick Navigation
Tags
Share the slides
Revvity Investor Day 2026 — Revvity's (NYSE: RVTY) 91-slide investor day presentation of November 13, 2026, themed 'Powering scientific intelligence', covering its Life Sciences and Diagnostics segments, Signals Software, AI-driven drug discovery, operating model, long-range plan and 2027 considerations.
Detailed view of each slide page, including layout, key content and visual elements.
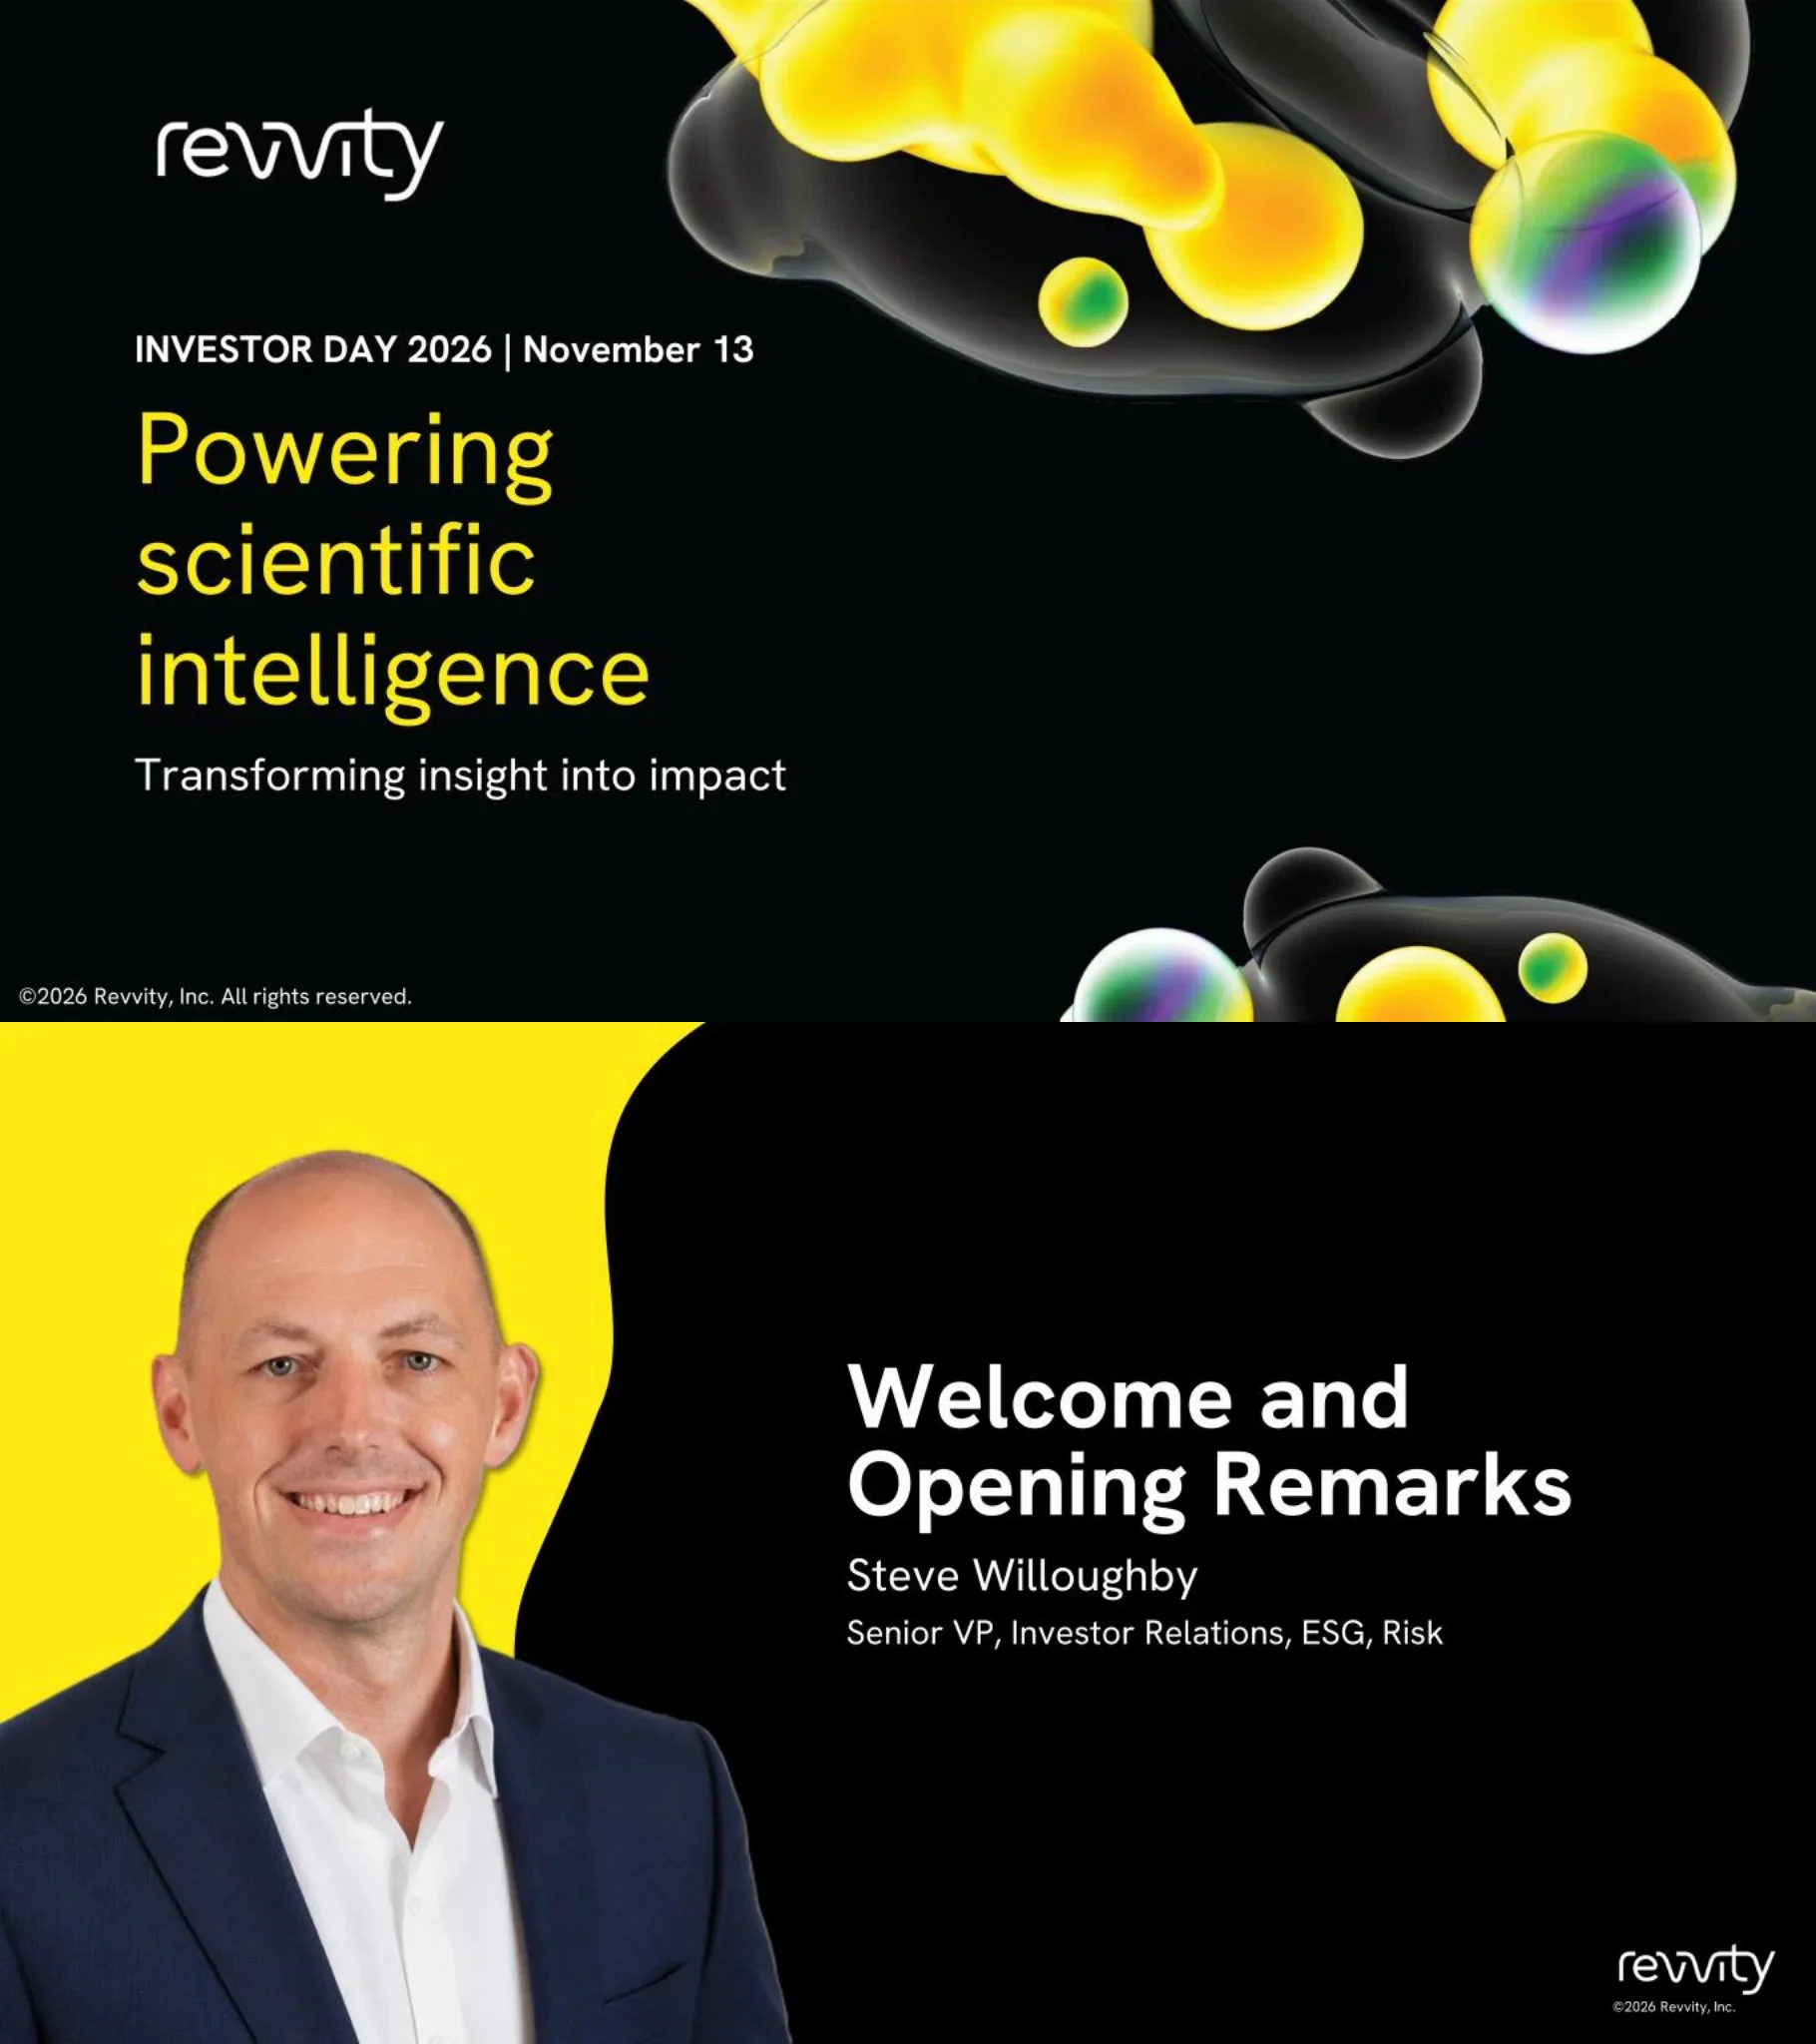
Revvity Investor Day 2026, November 13, titled 'Powering scientific intelligence' with the tagline 'Transforming insight into impact'.
Dark full-bleed cover with left-aligned yellow headline, event date line and logo; abstract glossy bubble artwork top right and bottom right.
Steve Willoughby, Senior VP, Investor Relations, ESG, Risk, opens the event with welcome and opening remarks.
Speaker divider: portrait on yellow organic shape at left, white title and name/title text on black at right.
Forward-looking statements disclaimer under the Private Securities Litigation Reform Act of 1995, pointing to Risk Factors in the most recent Form 10-Q, plus a note that guidance is non-GAAP and cannot be reconciled to GAAP without unreasonable effort.
Text-only white slide with bold title and two dense paragraphs.
Future results and historical growth rates are based on 2026 pro forma guidance as provided on November 3, 2026 (2026E) and exclude the China immunodiagnostics business under a definitive divestiture agreement. Key definitions: LSD 1-3%, MSD 4-6%, HSD 7-9%, LDD 10-12%, plus LRP, ARR and APV.
Yellow organic shape with title at left; two rounded outline boxes at right (basis of presentation, key definitions list).
Five agenda items: Welcome (Steve Willoughby), Company Overview (Prahlad Singh, PhD, President and CEO), Signals Software Overview (Kevin Willoe, President, Signals Software), New Era of Scientific Discovery (Craig Monell, PhD, Senior VP, Reagents, and David Gosalvez, PhD, Chief Strategy Officer, Signals Software), and Driving Operational Success and Creating Long-Term Value (Max Krakowiak, Senior VP, CFO).
Dark slide with yellow underline; numbered green circles in left column, presenter names and roles in right column.
Section divider introducing Prahlad Singh, PhD, President and CEO, for the Company Overview titled 'Powering scientific intelligence'.
Speaker divider with portrait on purple organic shape at left, white title and name on black at right.
Revvity's purpose: 'Expanding the boundaries of human potential through science', under the headline 'Revolutionizing science and transforming human lives through groundbreaking innovation'.
Large black headline on white at left, family photograph at right with a purple circle overlay carrying the purpose statement.
Five pillars: Diagnostics delivering durable growth; Life Sciences providing scientific answers; connecting critical workflows; positioned for the future of drug discovery; advancing science and improving health.
Five yellow header cards with white description boxes in a row over a fluorescence-microscopy cell image.
2026E revenue of about $2.9B: segments ~55% Life Sciences and ~45% Diagnostics; geography ~45% Americas, ~35% EMEA, ~20% APAC; ~85% recurring revenue (consumables, services and software) and ~15% non-recurring. About 10,000 employees.
Title with revenue subtitle; three donut charts in rounded boxes (Segments, Geography, Products) and a yellow banner on employees.
Diagnostics 2026E segment revenue of about $1.4B, ~55% Immunodiagnostics and ~45% Reproductive Health; addressable market of $30B+ with an MSD 5-year market CAGR and ~90% recurring revenue.
Yellow tagline banner and donut chart at left; right panel with two black stat tiles and three bullet points.
Immunodiagnostics 2026E revenue of about $0.8B: ~60% autoimmune, ~35% infectious disease, ~5% allergy and other. Autoimmune is described as a global leader with a broad testing menu; infectious disease is improving positioning in a high-growth market.
Two yellow pill callouts with icons at left; donut chart with percentage legend in a rounded box at right and a yellow caption banner.
Three rows: Autoimmune (comprehensive menu of sensitive tests, automation and AI-supported software; examples include rheumatoid arthritis, multiple sclerosis, lupus and 80+ rare conditions), Infectious disease (acute and chronic diagnostics across automated throughput needs) and Allergy and other (comprehensive allergy testing with automation).
Three rows, each with a green arrow header at left, description in the middle and product photos with captions at right.
Reproductive Health 2026E revenue of about $0.6B: ~70% newborn screening, ~10% maternal and prenatal health, ~10% cord blood banking, ~10% multiomics services. Claims #1 in newborn screening, 40+ years of leadership and 85+ newborn lives saved daily.
Yellow '#1' banner with four bullets at left; donut chart with percentage legend at right.
Four rows: newborn screening (complete workflow from sample to result, over 760M infants screened), maternal and prenatal health (full workflow offerings for all trimesters including NIPT and pre-eclampsia), cord blood banking (collection through long-term storage) and multiomics services (insights into diagnosis, monitoring and treatment).
Four rows with green arrow headers, descriptions and product images with captions (NBS immunoassay system, PlGF testing, banking kits, whole genome sequencing).
Statement slide: unique positions in specialty diagnostics provide a strong foundation to expand access to more actionable clinical answers.
Large headline with green emphasis on white organic shape; blue-green fluorescent chromosome-style imagery on black at right.
Innovation spotlight: 9 in 10 adults with chronic kidney disease are undiagnosed (source: CDC). Revvity is expanding its autoimmune portfolio using ELISA, IIFT, ChLIA and immunoblot technologies, with an IVD portfolio and biomarker work on immune-related kidney filter damage and inflammation.
Green banner with kidney icon; left headline; right rounded box split into 'IVD portfolio' and 'Biomarkers' columns with chevron bullets.
Revvity states it is a global market leader in dried blood spot testing and looks ahead to one complete NGS workflow for newborn screening labs: sample collection, extraction and QC, library prep and QC, sequencing services and analysis software, with LIMS and data analysis integration.
Left photos of dried blood spot instruments; right yellow five-step vertical workflow with checkmark benefits; green banner at bottom.
Revvity is developing a multiplex assay from one dried blood spot, leveraging BioLegend reagents, Euroimmun automation and disease expertise, Reproductive Health commercial scalability and its global lab footprint. Future applications: type 1 diabetes, autoimmune thyroid disease and celiac disease.
Yellow top banner with infant foot photo, four capability cards beneath, three future-application cards at the bottom.
Revvity brings together Life Sciences and Diagnostics to bridge the gap from discovery to cure, applying its portfolio to rare disease, chronic disease and oncology while supporting an innovative customer base.
Three stacked rounded rows linked by teal arrows; colored pills for Life Sciences (purple) and Diagnostics (green) and yellow application pills.
Life Sciences 2026E segment revenue of about $1.5B, ~85% Life Sciences Solutions (Reagents & Instruments) and ~15% Signals Software; addressable market of $30B+ with an MSD 5-year market CAGR and ~85% recurring revenue.
Yellow tagline banner and donut chart at left; right panel with two black stat tiles and three chevron bullets.
Signals Software, a leading provider of scientific SaaS, has about $260M of 2026E revenue, 46 of the top 50 pharma and biotech companies as customers, 1M+ users across 4,000+ customers worldwide, and is the #1 ELN (Electronic Lab Notebook) provider, with broad adoption in pharma research and expansion opportunities in development and manufacturing.
Yellow tagline pill and photo collage at left; 2x2 grid of KPI tiles and a teal 'Broad adoption' banner at right.
Reagents 2026E revenue of about $0.7B: ~55% RUO antibodies and ~45% research reagents, with 75k+ reagents offered, global Centers of Excellence and unique biomarker development and detection capabilities.
Yellow tagline pill with bullets and '75k+' badge at left; donut chart with two-item legend in a rounded box at right.
Two rows: RUO antibodies (reagents and consumables including flow cytometry antibodies, recombinant proteins and multiomics assay kits; antibody conjugates) and research reagents (cell function and viability reagents and immunoassay kits as an alternative to traditional ELISA; Alpha assays). Banner: differentiated biological content, assay technologies and scientific expertise support critical workflows.
Two purple arrow-header rows with descriptions and icons, yellow banner across the bottom.
Instruments 2026E revenue of about $0.5B: ~30% cellular analysis, ~30% sample prep and automation, ~20% in vivo imaging and ~20% detection, supported by global instrument Centers of Excellence.
Yellow tagline pill with bullets at left; donut chart with four-item legend at right.
Four rows: cellular analysis (cell counters and high-content screening, Opera Phenix OptiQ), sample prep and automation (liquid handling and robotics, Fontus), in vivo imaging (optical, microCT, ultrasound with AI-integrated software, IVIS Spectrum 2) and detection (multimode plate readers and radiometric detection, EnVision Nexus).
Four purple-shaded arrow-header rows with descriptions and product photos with captions.
Statement slide: advancing the next generation of Life Sciences innovation with unique reagents, instruments and software solutions.
Large headline with purple emphasis on white organic shape; molecular protein-structure rendering at right.
Stacked area chart of revenue contribution from new LSS reagents by year, 2015 through 2026, rising steadily; yellow callout states about 1,500 new reagents, kits and antibodies are developed annually. Chart axis values are not shown.
Stacked area chart at left with year legend; large yellow callout with product image at right.
Three software products: Image Artist (cloud-based AI-powered HCS and cell imaging analysis), CytoScribe (cloud-based flow cytometry data management and analysis, panel design) and Living Image Synergy AI (AI-based in vivo image segmentation combining optical, microCT and ultrasound data). Novel software is being integrated into the Signals platform.
Three purple-titled cards with bullets and screenshots over a bracket into a yellow bottom banner.
Segment breakdown of 2026E revenue: Life Sciences ~$1.5B (~85% Life Sciences Solutions, ~15% Signals Software) and Diagnostics ~$1.4B (~55% Immunodiagnostics, ~45% Reproductive Health). Key customers: pharma/biotech and academia/government for Life Sciences; public health labs, reference labs and hospitals/clinics for Diagnostics.
Yellow organic shape with headline at left; two donut charts and customer tiles at right.
Revvity is: a differentiated portfolio (strong positions across attractive Diagnostics and Life Sciences markets); positioned for the future of scientific discovery (unique capabilities across biology, measurement and data integration); set to deliver compelling long-term value creation (continued confidence in the long-range outlook).
Three outlined rows with yellow chevron markers at left; fluorescence cell image at right.
Section divider for the Signals Software overview, 'Connecting the scientific workflow', presented by Kevin Willoe, President, Signals Software.
Speaker divider with portrait on teal organic shape at left, white and yellow italic title on black at right.
Signals Software is positioned as connecting scientific work and turning data into decisions. Three messages: embedded in how science is done (digital system of record from idea to creation), more valuable as science transforms (unified platform for accelerated data generation and AI-enabled workflows), and a proven foundation for growth (scaled platform with a robust innovation engine).
Teal arrow-shaped panel with italic tagline at left; three headed text blocks separated by rules at right.
Signals is scientific software that lets teams plan and carry out research, understand their data and decide what comes next, structured as four stages: Design, Make, Test, Decide. A teal banner states it creates a trusted foundation of data and experimental records for downstream development.
Four photo tiles in a row with question headings above and captions below; teal banner at bottom.
Timeline of Signals lineage: 1985-2000 Personal Computers (ChemDraw, ChemBioOffice); 2000-2015 The Internet (E-Notebook Enterprise, Spotfire, ChemOffice Enterprise); 2015-2020 The Cloud (Signals Notebook, Signals VitroVivo, Signals Lead Discovery); 2020-2025 SaaS (Signals ChemDraw, Signals One, Signals Clinical, Signals Synergy); 2025 and beyond AI (Signals Xynthetica, AI Co-Scientist, Signals BioDesign, Signals LabGistics).
Five-stage snake timeline in teal bars with yellow chevrons and product-name pills; yellow closing banner.
Key software metrics, 2020 versus 2026E: APV (annualized portfolio value) >$130M to >$275M, 13% CAGR; ARR (annual recurring revenue) ~$10M to >$100M, 47% CAGR; SaaS penetration ~5% to ~35%, 40% CAGR; net retention rate ~107% historical average. Evolving beyond user-based pricing with pay-per-use, self-funding growth from AI and storage-based pricing.
Metrics matrix with column headers and 2020/2026E rows, yellow CAGR chips between rows, pricing-model strip and yellow banner at the bottom.
Six reasons: transformational capabilities, enterprise-grade security, scientific system of record, depth and breadth, SaaS done right and proven at scale.
Teal arrow panel with headline at upper left, two columns of three bulleted reasons, wide laboratory photo with yellow wave border at bottom.
Contrasts fragmented systems (experiments and protocols, teams and workflows, analytics and AI, samples/results/conditions, institutional memory; context lost between tools so teams repeat work) with Signals connected knowledge (context kept with the data so teams reuse it). Tagline: a scientific system of record preserving the context behind every decision.
Left gray panel with dashed circles, central gradient arrow, right panel with five connected bubbles around the signals logo.
Signals modules mapped across Research (AI-augmented design; large molecule, small molecule, formulations research), Development (testing/assay development; large molecule, small molecule, formulations development) and Pre-Clinical plus Manufacturing (clinical trials analytics; CMC QA/QC). A single unified platform keeps work, data and decisions connected.
Three blob clusters left to right with arrows, product icons, yellow banner at bottom right.
Product cards: ChemDraw (chemical drawing standard), Spotfire (analytics and visualization), signalsNotebook (data capture and collaboration), signalsOne (end-to-end support, key module Signals Xynthetica), signalsBioDesign (large molecule design), signalsSynergy (CRO integration), signalsClinical (clinical trial data analytics) and signalsLabGistics (digitalize and unify scientific workflows), under the 'Signals Technology Framework - SaaS done right'.
Left column of two product cards; right teal header bar over a 2x3-plus grid of product cards with logos and descriptions.
Growth strategy: expanding existing capabilities (depth) to increase penetration in scientific communities and workflows, and offering new solutions (breadth) into additional disciplines, user groups and R&D stages, with opportunity to fold in high-value software assets from broader Revvity and expand across Tier 2 and 3 biopharma and materials science customers.
Two outlined boxes labeled Depth (teal) and Breadth (green) with directional arrows over a faded lifecycle map; yellow banner.
Signals LabGistics, a single source of truth for scientific operations, captures complex workflows with AI tools that convert SOPs and natural language into repeatable processes, accelerates technology transfer between development and manufacturing, and simplifies regulatory compliance with documentation and traceability in GxP environments.
Orange spotlight panel with product logo at left; three icon rows at right; workflow diagram strip (Execute, Track, Audit) at bottom; orange corner badge.
Signals Xynthetica is a scalable Models-as-a-Service offering that converges with the wet lab, building on Signals One for a continuous learning system: flexible AI model ecosystem (proprietary, third-party and Revvity-developed), integration of in-silico and wet-lab workflows, and secure federated learning. Partnership spotlight: Lilly TuneLab and Revvity Signals federated learning platform.
Teal spotlight panel with logo at left; outlined checklist box at right; partnership logos at bottom; ML graphic top right.
Three points: Signals has evolved into a broad, connected scientific platform; it is embedded in customer workflows as a scientific system of record; expansion and innovation have produced a scaled, recurring-revenue business with accelerated growth potential. AI, models and convergence of digital and experimental workflows are transforming how science is done.
Three bubble-bulleted statements with purple emphasis, yellow banner below, large teal network-graph image in yellow-bordered shape at right.
Section divider for 'The New Era of Scientific Discovery: Where AI-driven design meets biological evidence', presented by Craig Monell, PhD, Senior VP, Reagents, and David Gosalvez, PhD, Chief Strategy Officer, Signals Software.
Speaker divider with two stacked portraits on teal shape at left, white and yellow italic title on black at right.
Three messages: discovery is accelerating (more high-quality biological data enables increased exploration, better prediction and faster prioritization); biology still decides (experimental evidence determines what works and creates new data for continuous learning); Revvity connects biology and data (reagents, instruments and software support prediction, validation and learning).
Dark slide with teal arrow panel at left carrying an italic tagline; three headed messages with glowing rules at right.
AI expands what can be explored, predicted and prioritized (broader chemical and biological spaces, faster analysis, more promising hypotheses), while progress increasingly depends on high-quality biological data to reveal responses, test predictions and strengthen models.
Two rounded colored boxes (purple, teal) with arrows to bullet lists; closing statement with yellow highlighted phrases.
Process chain Generate, Predict, Prioritize, Test, Measure, Validate; Generate and Predict (in-silico discovery with limited ability to predict at scale) are labeled the previous bottleneck, while Prioritize through Validate sit under physical biology. The challenge was identifying the most promising opportunities from a vast set of possibilities.
Teal and purple header bar above a six-icon horizontal process line, first two steps boxed as the bottleneck.
Three outcomes: more data analyzed (larger, higher-dimensional datasets), better insights from data (unlock previously unusable data) and faster iteration (quicker move to the next experiment). Faster analysis increases demand for decision-grade biological evidence, shifting the constraint toward evidence generation.
Three glowing-particle columns with headings and captions; yellow-highlighted closing line.
Contrasts in-silico virtual lab (Generate, Predict, Prioritize: explore more, faster) with physical biology wet lab (Test, Measure, Validate: reveal, test and validate biology), meeting at an emerging bottleneck. As more promising hypotheses reach the lab, richer biological validation becomes increasingly important.
Purple and teal header boxes over a six-icon line converging at a central bottleneck; highlighted closing statement.
Three validation questions: does it work (validate biological function), how does it work (understand cellular response) and what else does it affect (assess selectivity and safety). No single readout tells the whole biological story.
Three icon rows at left, outlined yellow callout, lab-scientist photo in yellow-bordered shape at right.
Richer data yields better models, usable data yields better predictions, and faster experimentation yields faster iteration; the slide concludes this requires more from wet lab experimentation to inform what comes next.
Outlined box with three cause-and-effect arrow rows at left; three circular fluorescence cell images at right; highlighted closing line.
Three pillars: Instruments (generate and measure experimental evidence), Reagents (reveal biological function and response) and Software (connect data, context and scientific decisions), helping characterize biological responses from multiple angles for a faster, more informed cycle of prediction, validation and learning.
Three yellow-outlined rounded cards on black with bubble artwork at the bottom of each; highlighted closing statement.
Statement slide: Revvity's unique reagents and instruments enable faster, richer and more informative experimentation.
Large white headline with yellow highlighted words on black; multicolor fluorescence cell image at right.
Foundational enablers (automation, no-wash assays, multimode plate readers) increase the speed and efficiency of experimentation; data-rich differentiators (high-content imaging, high-dimensional flow cytometry, single-cell biology) increase information captured per experiment; software (signalsXynthetica, ChemDraw, Phenologic.AI, signalsOne, signalsLabGistics, CytoScribe) connects data, context and decisions.
Two black-tabbed outlined panels with bracket arrows to outcome statements and a full-width software strip with logos at the bottom.
Multimode plate readers and no-wash assays streamline routine screening. Offered: HTRF / AlphaLISA high-performance assay technologies and EnVision and VICTOR detection families; no-wash formats reduce steps, 1,536-well scalability increases validation throughput, and specialty assays span a broad set of pathways and targets.
Teal tagline panel at left; large outlined area with assay illustration and instrument photos above three benefit cards.
High-content screening captures rich visual information on how individual cells respond across conditions: PhenoVue reagents capture more biology, Opera Phenix OptiQ generates more data and Phenologic.AI extracts more information, shown as traditional output versus with Phenologic.AI. Customers were already generating rich biological data and AI is unlocking new ways to analyze it.
Teal tagline panel at left; product images and a before/after image pair above three benefit cards.
High-dimensional flow cytometry shows which cell populations respond and how strongly: antibody conjugates for full spectrum (brighter signals), TotalSeq and LEGENDplex reagents (broader coverage) and panel design plus data analysis software (intelligent analysis). More biology is being measured and greater resolution reveals more meaningful variation.
Teal tagline panel at left; product and software images above three benefit cards.
Faster experimentation, richer biological data and more usable evidence feed a statement that as discovery generates more possibilities, Revvity's solutions help scientists generate the data and evidence needed to determine what advances and inform what comes next.
Three teal stacked boxes at left, black chevron, large outlined statement box at right over bubble artwork.
Statement slide: generating more biological data is only part of the opportunity, and software turns data into insight for what comes next.
Large white and yellow text on black at left; glowing stacked data-layer image at right.
Traditionally, fragmented software supported in-silico and wet lab discovery separately: the AI in-silico design cycle (Generate, Predict, vScreen, Validate) had limited experimental feedback, while the traditional wet lab approach (Design, Make, Test, Decide) produced sparse and disconnected data.
Two circular four-step cycle diagrams (purple and teal) separated by a vertical rule, with descriptors at each side.
The AI-powered design cycle (Generate, Predict, vScreen, Validate) lets scientists generate at greater scale, predict with greater precision and prioritize with greater confidence, but a faster design loop is only as valuable as the experimental evidence and context it can connect back to.
Purple and teal circular cycle diagram at left, three italic-headed columns at right, highlighted closing statement.
An infinity-loop diagram joins the in-silico side (AI-powered design: Generate, Predict, vScreen) with the physical biology side (wet science: Validate, Make, Test) so scientists can generate and prioritize hypotheses and test and generate experimental evidence in one continuous learning system.
Central purple and teal infinity-loop graphic with labeled side descriptions and a highlighted closing line.
One connected environment to plan experiments, capture scientific work, connect experimental data and inform the next decision: from idea to next candidate, signalsXynthetica and signalsOne sit around the design-and-validation loop, all resting on the connected scientific context in a unified solution (experiments and protocols, samples/results/conditions, teams and workflows, analytics and AI, institutional memory).
Infinity-loop graphic centered with Idea and Next candidate bubbles at the sides, product logos above, and a context platform strip at the bottom.
Under the banner 'Powering scientific intelligence': AI is amplifying the value of high-quality biological data; Revvity's instruments and reagents generate critical biological evidence; its software connects data, context and scientific insights, with Signals transforming experimental evidence into actionable insights.
Yellow tagline panel at left with three outlined rows, each with a teal icon, at right.
Section divider introducing Max Krakowiak, Senior VP, CFO, for 'Driving Operational Success and Creating Long-Term Value'.
Speaker divider with portrait on green organic shape at left, white title and name on black at right.
Three messages: differentiated financial performance (strong results across varying market environments), operational excellence (margin expansion, earnings growth and free cash flow) and attractive long-term potential (durable growth powered by innovation and expanding end-market opportunities).
Green arrow panel with italic tagline at left; three headed messages with rules at right.
Three successive waves of market disruptions: 2023 post-COVID normalization, 2024 pharma/biotech market pressure and 2025 geopolitical and policy uncertainty.
Three purple wave graphics left to right with yellow label boxes, icons and years; caption beneath.
2026E versus 2022: adjusted revenue ~$2.9B, adjusted operating margin ~28.8%, adjusted EPS ~$5.43, free cash flow >$575M with >90% FCF conversion. Since 2022: $2B capital deployed, 0.6x net leverage decrease and 12% reduction in share count. The 2022 bars carry no value labels.
Four gray tiles with 2022 versus 2026E bar pairs at left; Key Highlights column of three stats at right.
Strategic priorities: (1) Efficiency, capturing AI-enabled productivity gains; (2) Simplification, creating a nimbler organization; (3) Optimization, streamlining operations. The operating model rests on accountability, agility, talent and digitalization.
Numbered priority rows with yellow labels at left; diamond diagram of four purple icon nodes around 'Our Operating Model' at right.
Before versus now: in the past, software engineering capacity was a bottleneck (limited bandwidth, longer development cycles, slower time to market); today, software engineering is an initial AI use case with >90% of coding projects leveraging AI and a 2-3x increase in productivity per developer.
Two outlined boxes (In the past, Today at Revvity) joined by a large purple arrow, with stat rows on the right.
From 2023 to 2026, headcount was reduced by about 16%, supported by advancing integration initiatives to capture synergies, delayering of management structure to drive efficiency and driving commercial and operational synergies across LS and Dx.
Large yellow blob with ~16% stat at left, chevron into an outlined box with three icon rows at right.
From 2023 to 2026, global square footage was reduced by about 25%. Levers: reduce structural cost (insourcing, product re-engineering, vendor consolidation), optimize the network (consolidate packaging and shipping lanes) and increase flexibility (simplify footprint for responsiveness and resiliency).
Purple world map with yellow ~25% stat card at left; three outlined rows with purple check circles at right.
Four operating model pillars on a yellow timeline bar: Accountability, Agility, Digitalization and Talent, closing with '...to drive long-term value creation'.
Full-width yellow bar with four purple icon circles hanging from it and a teal banner at the bottom left.
Section divider titled 'Our Attractive Long-Term Potential' introducing the long-range outlook portion of the CFO section.
Black slide with centered white and yellow title and glossy bubble artwork at top right and bottom right.
2026E revenue of ~$2.9B (~45% Life Sciences Solutions, ~25% Immunodiagnostics, ~20% Reproductive Health, ~10% Signals Software). CAGR since becoming Revvity: Immunodiagnostics +HSD, Reproductive Health +MSD (Total Dx +MSD), Life Sciences Solutions -LSD, Signals Software +LDD (Total LS flat), Total Revvity +LSD. Signals CAGR is based on APV; the company expects differentiation to continue as markets normalize.
Donut chart at left; right outlined box listing growth by line of business with brackets to segment totals and a yellow total tile.
Section divider: Diagnostics, with strong innovation and competitive advantages driving durable growth across specialty areas.
Black slide with white and yellow headline and a teal bubble-macro photo under a yellow wave border.
Long-range plan growth drivers add up: 500bps underlying market growth + 200bps innovation + 100bps geographic penetration = 7-9% LRP organic growth. Key messages: strong innovation, increasing market adoption and expanding geographic reach; specialty diagnostics solutions with increasing automation and more actionable insights.
Row of three outlined driver cards joined by plus signs to a yellow result tile; green Key messages panel with two columns below.
Long-range plan growth drivers: -200bps birth rate headwind, +50bps geographic expansion, +300bps menu adoption, +200bps new products and +50bps stability in prenatal and cord blood, yielding 3-5% LRP organic growth. Brackets show newborn growth of 4-6% and prenatal/cord blood growth of 1-2%.
Row of five driver cards with plus signs into a yellow result tile; brackets under cards; Key messages panel at the bottom.
Diagnostics long-term outlook: Immunodiagnostics 7-9% (~55% of Dx) plus Reproductive Health 3-5% (~45% of Dx) equals 5-7% LRP organic growth for the segment. Key messages: differentiated specialty diagnostics portfolio with durable competitive advantages, and novel innovations in new markets leveraging capabilities from across the organization.
Two outlined tiles with a plus sign and a yellow result tile; dark-green Key messages panel at the bottom.
Section divider: Life Sciences, advancing discovery through connected workflows with data-rich instruments, specialized reagents and innovative software.
Black slide with white and yellow headline and a molecular antibody rendering under a yellow wave border.
Long-range plan growth drivers: 500bps underlying market growth + 100bps innovation + 100bps downstream expansion = 6-8% LRP organic growth. Key messages: data-rich solutions supporting discovery and validation of fundamental and complex biological insights, and leveraging core capabilities to capture adjacent market opportunities.
Three outlined driver cards joined by plus signs to a yellow result tile; purple Key messages panel below.
Growth drivers: 500bps expansion with existing customers + 300bps new offerings + 300bps new customer wins = 10-12% APV LRP. Key messages: digital system of record connecting scientific workflows from idea to creation, and a robust, scaled and entrenched platform driving sustainable growth in new and existing markets.
Three outlined driver cards with plus signs and a yellow result tile; light-purple Key messages panel below.
Life Sciences long-term outlook: Life Sciences Solutions 6-8% (~85% of LS) plus Signals 10-12% (~15% of LS) equals 7-9% LRP organic growth for the segment. Key messages: innovative specialty scientific solutions with above-market growth and attractive margins; integrated offerings help customers generate richer data, accelerate decisions and improve research outcomes.
Two outlined tiles with a plus sign leading to a yellow result tile; dark-purple Key messages panel at the bottom.
2026E revenue of ~$2.9B (~45% Life Sciences Solutions, ~25% Immunodiagnostics, ~20% Reproductive Health, ~10% Signals Software). LRP organic growth: Immunodiagnostics 7-9%, Reproductive Health 3-5% (Total Dx 5-7%), Life Sciences Solutions 6-8%, Signals Software 10-12% (Total LS 7-9%); total company 6-8%, 200bps above underlying market growth. Signals LRP is based on APV.
Donut chart at left; outlined table of LRP organic growth by business with brackets to segment totals and a yellow total tile.
Adjusted operating margin walk from ~28.8% in 2026E, adding 25bps per year from gross margin expansion and 50bps per year from SG&A operating leverage and cost efficiencies, to a future mid-30s% margin; incremental adjusted operating margins in the low 40s%.
Headline and callout at left; waterfall-style bar chart with four labeled bars at right.
Long-term outlook equation: 6-8% organic revenue growth (200bps above market) plus 3% from 75bps of operating margin expansion equals double-digit adjusted EPS growth, with several areas for potential upside.
Large outlined box with two colored circles joined by plus and equals signs to a yellow result tile.
Capital allocation mix shifts from historical (2023-2026E, predominantly buybacks with smaller dividends and M&A) to future intentions (2027-2031, predominantly M&A with buybacks and dividends); no slice percentages are labeled. Priorities: targeted M&A to complement Life Sciences capabilities, consistent share repurchases, maintain existing dividend; about $5B of capital capacity through 2031 with commitment to an investment-grade credit rating.
Two donut charts (Historical 2023-2026E, Future Intentions 2027-2031) with a legend; bullet list and magenta callout at right; footnote.
Three upside areas beyond the long-range plan: outsized AI-driven demand, additional strategic partnerships, and disciplined and opportunistic capital deployment.
White organic shape with yellow list panel of three purple-chevron bullets; virus-and-cell artwork on black at right.
Preliminary 2027 considerations: ~6% organic growth (~200bps above market growth); ~20bps margin expansion in addition to normal operating leverage; below the line net interest of ~$85M, tax rate of ~19% and flat share count. Formal 2027 guidance to be provided on the Q4 earnings call.
Three yellow-headed outlined cards (Organic Growth, Margin Expansion, Below the Line) with a purple banner across the bottom.
Revvity is delivering compelling long-term value creation through its differentiated portfolio, powering scientific intelligence by bringing together biological expertise, innovative technologies and connected data, and revolutionizing science and transforming human lives through groundbreaking innovation.
Three outlined rows with yellow chevrons at left; family photograph in an organic shape at right.
Closing slide showing the Revvity logo mark in white on black; no other text beyond the copyright notice.
Black slide with a large centered white logo mark and the small Revvity logo and copyright at bottom left.
Common questions about this slide and the underlying presentation content.
It is the presentation for Revvity's Investor Day held November 13, 2026, titled 'Powering scientific intelligence: Transforming insight into impact'. Estimates are based on 2026 pro forma guidance as provided on November 3, 2026 (2026E).
2026E revenue is about US$2.9B (US dollars; ~55% Life Sciences, ~45% Diagnostics), with ~28.8% adjusted operating margin, ~$5.43 adjusted EPS and free cash flow above $575M. The long-range plan targets 6-8% organic growth, margin expansion of 75bps and double-digit adjusted EPS growth.
Immunodiagnostics 7-9%, Reproductive Health 3-5% (Diagnostics total 5-7%), Life Sciences Solutions 6-8% and Signals Software 10-12% on an APV basis (Life Sciences total 7-9%). The deck defines MSD as 4-6%, HSD as 7-9% and LDD as 10-12%.
The slides were filed with the SEC as an exhibit (EX-99.1) to a Form 8-K on 2026-11-13. This gallery page is based on rasterized images of that filing, so very small print may not be legible; where text was unclear it has not been transcribed.
There are 91 slides. The agenda has five parts: Welcome (Steve Willoughby), Company Overview (Prahlad Singh, PhD, CEO), Signals Software Overview (Kevin Willoe), New Era of Scientific Discovery (Craig Monell, PhD, and David Gosalvez, PhD) and Driving Operational Success and Creating Long-Term Value (Max Krakowiak, CFO).
Signals has about $260M of 2026E revenue, 46 of the top 50 pharma and biotech companies as customers and 1M+ users across 4,000+ customers. APV grows from >$130M in 2020 to >$275M in 2026E, ARR from ~$10M to >$100M and SaaS penetration from ~5% to ~35%.
Preliminary 2027 considerations are ~6% organic growth, ~20bps of margin expansion on top of normal operating leverage, net interest of ~$85M, a ~19% tax rate and a flat share count. Formal 2027 guidance is to be provided on the Q4 earnings call.
Yes, the deck can be viewed and downloaded from 2slides as PDF or PPTX and used as a layout and structure reference for your own investor day or earnings presentation. Revvity's logos, photos and data remain Revvity's property, so replace them with your own content.

Create Your Own Slides
Turn your ideas into professional presentations in seconds with 2slides AI.
Reference professional designs, choose your style, and generate slides with perfect text rendering. Powered by Nano Banana—start creating your presentation now.
Your AI Agent for slides. Save time, shine faster with intelligent presentation creation.


© 2026 2slides. All rights reserved.