
Part of Investor presentation examples · Indian investor presentation examples
Power Grid Corporation of India Limited (POWERGRID) Q2 & H1 FY27 Investor Presentation, dated 3 November 2026 and filed with BSE/NSE, covering the quarter and half-year ended 30 September 2026 (FY27 runs April 2026 to March 2027): commissioning, capex and capitalisation, TBCB bid wins, a ~₹2.20 lakh crore order book, consolidated and standalone results in ₹ crore, collections, telecom and consultancy, and ESG.
Uses this deck’s cover as a style reference for slides made from your own content. Or pick any page below to use its layout as the reference.
Quick Navigation
Tags
Share the slides
Power Grid Corporation of India Limited (POWERGRID) Q2 & H1 FY27 Investor Presentation, dated 3 November 2026 and filed with BSE/NSE, covering the quarter and half-year ended 30 September 2026 (FY27 runs April 2026 to March 2027): commissioning, capex and capitalisation, TBCB bid wins, a ~₹2.20 lakh crore order book, consolidated and standalone results in ₹ crore, collections, telecom and consultancy, and ESG.
Detailed view of each slide page, including layout, key content and visual elements.
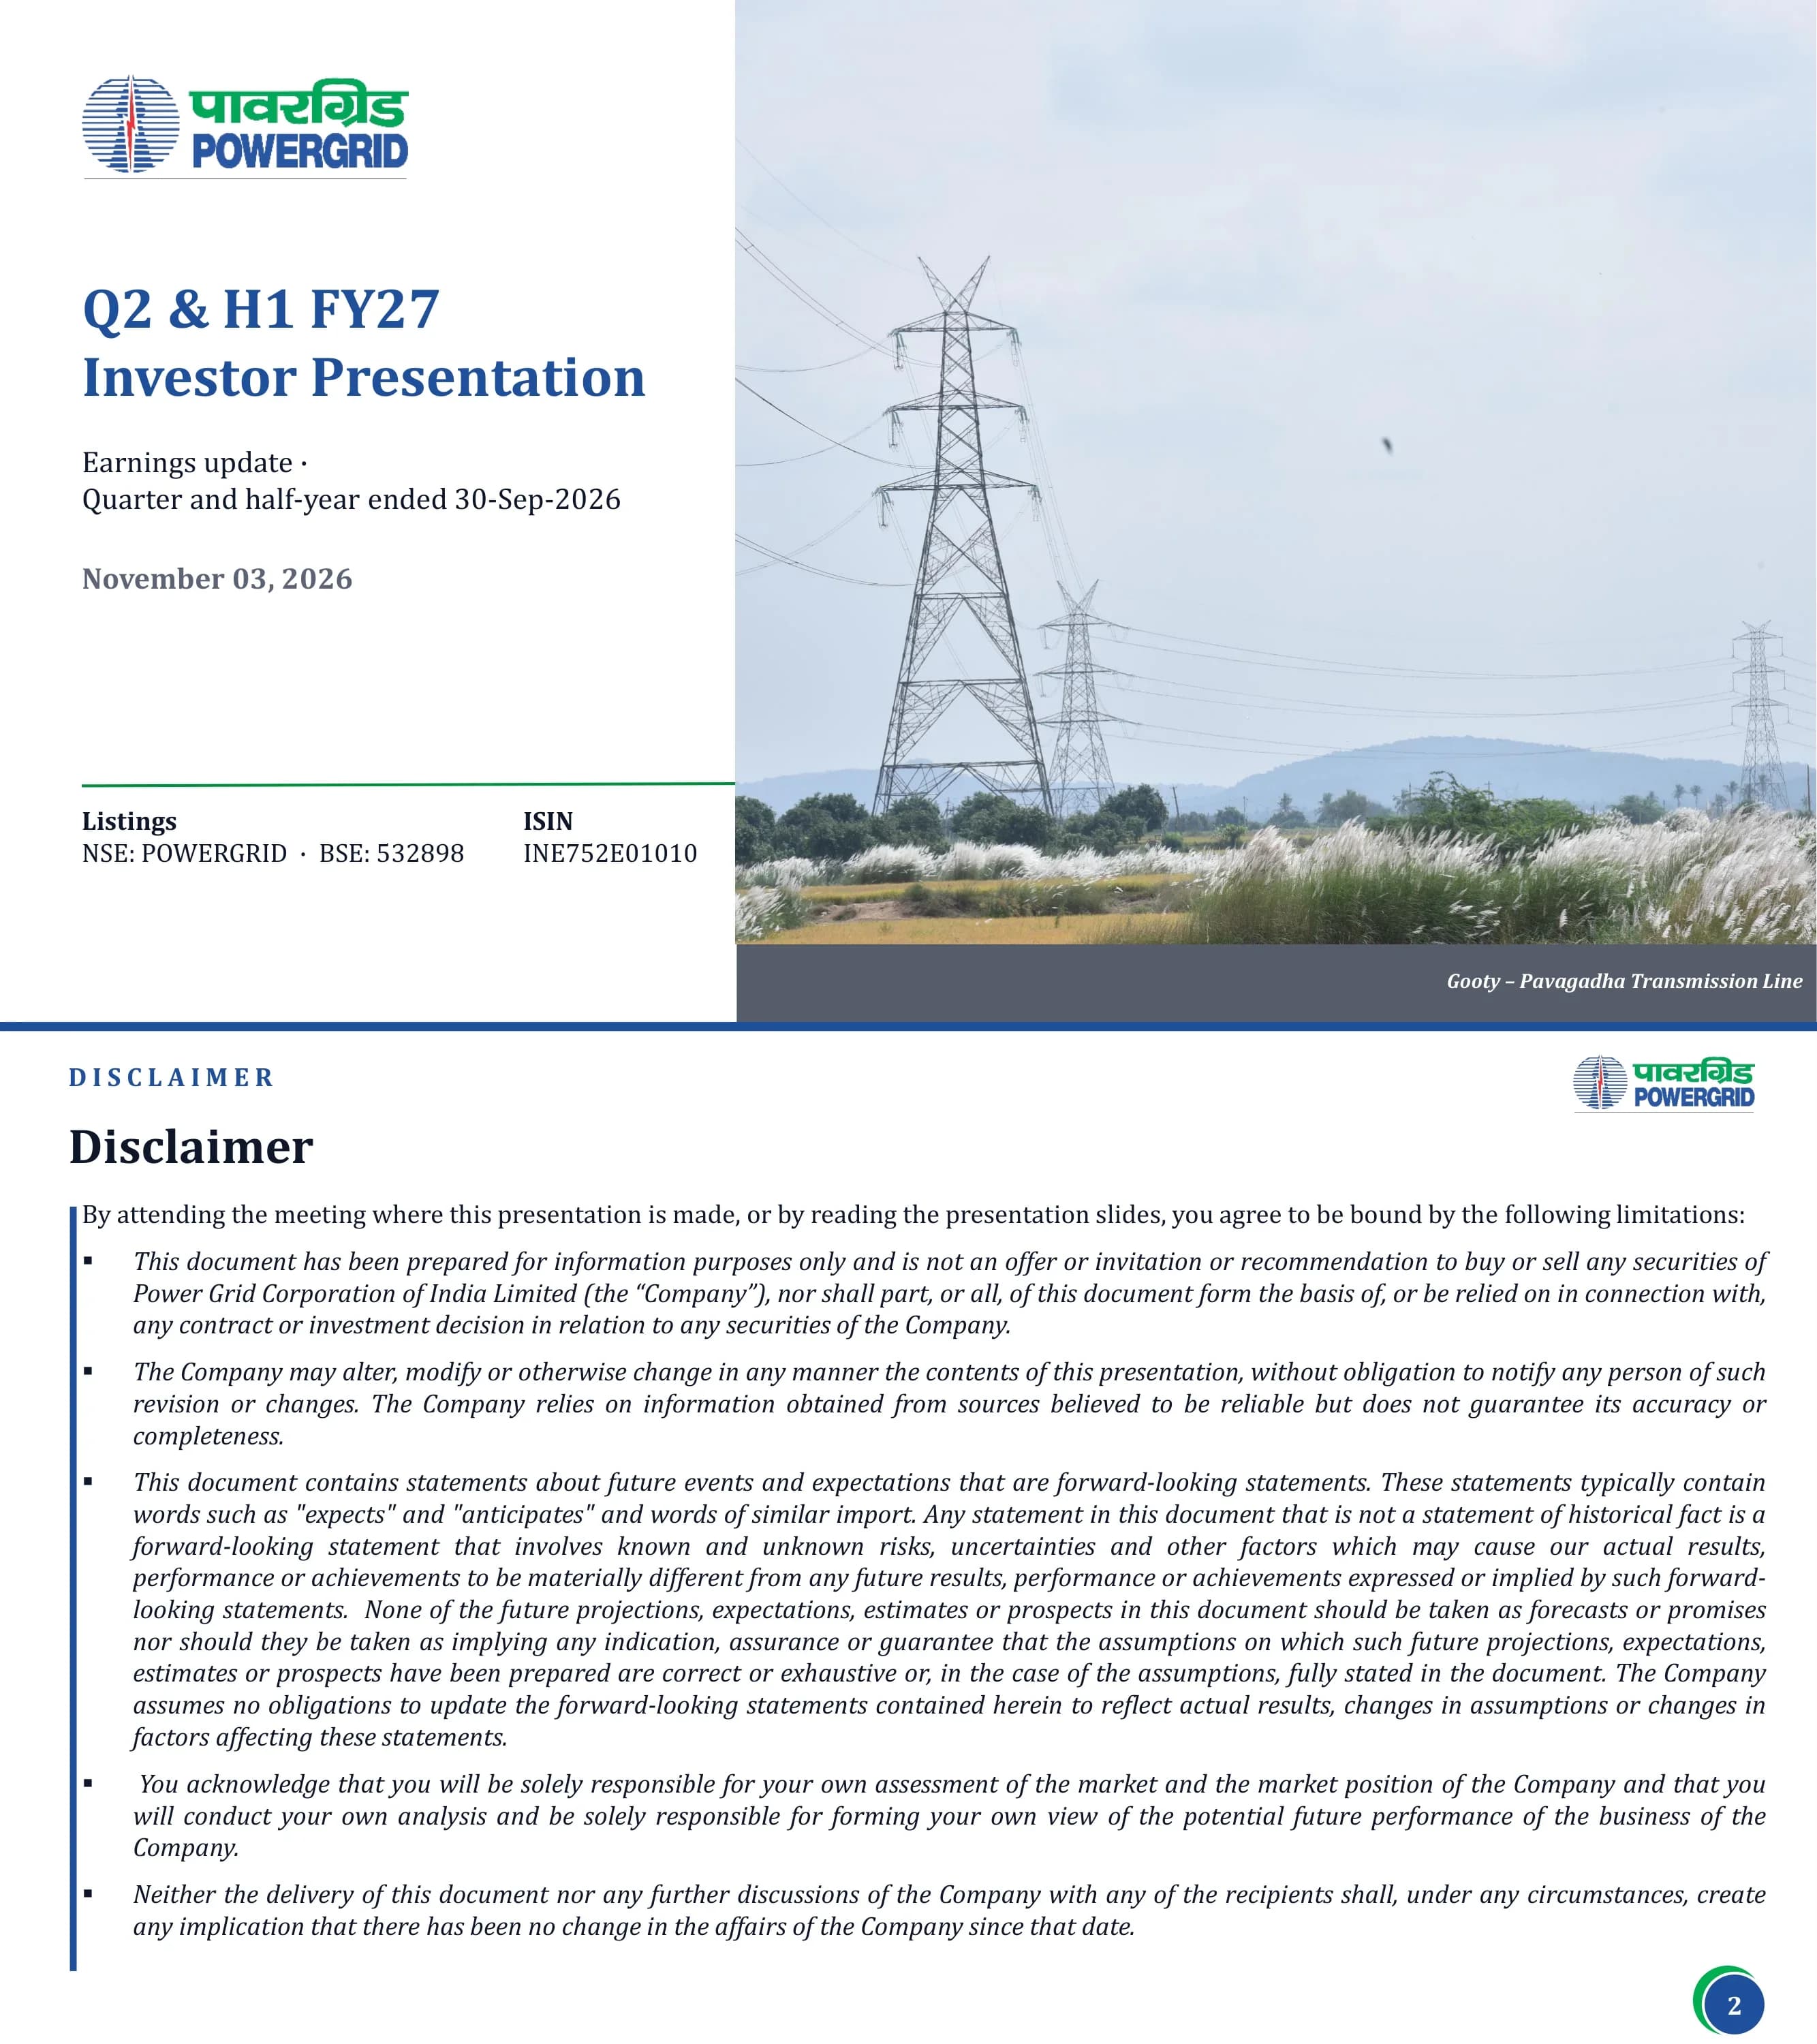
Cover: POWERGRID logo, 'Q2 & H1 FY27 Investor Presentation', earnings update for the quarter and half-year ended 30-Sep-2026, dated November 03, 2026, with listings NSE: POWERGRID and BSE: 532898 and ISIN INE752E01010.
Split cover: white left panel with logo, title, subtitle, date and a listings/ISIN strip; full-height photo on the right of the Gooty-Pavagadha transmission line with a caption bar.
Standard disclaimer: the document is for information only and is not an offer to buy or sell securities of Power Grid Corporation of India Limited; contents may change without notice; forward-looking statements carry risks and uncertainties; readers must form their own view of the company.
Section label and heading at top, then a single text block of five italic bullet paragraphs with a blue vertical accent bar on the left.
Six numbered sections: 01 Highlights & Overview, 02 Execution & Operations, 03 Competition, 04 Order Pipeline & Outlook, 05 Financial Performance, 06 Sustainability & Recognitions.
Two rows of three cards, each with a green top border, large blue section number and section name.
Data as on 30-Sep-2026: gross fixed assets ₹3.29 lakh crore+ (consolidated), 1,87,576 ckm of transmission lines (1,606 lines), 6,49,116 MVA transformation capacity (293 substations), 99.81% system availability in H1 FY27. Shareholding: GoI 51.34%, FII/DII 24.03%/20.91%, market cap ~₹2.42 lakh crore. Credit: domestic AAA from CRISIL, ICRA and CareEdge; international BBB (S&P), BBB- (Fitch), Baa3 (Moody's), at par with sovereign, outlook stable; S&P reaffirmed in Sep-2026, Moody's in Aug-2026. SPV rationalisation: 28 SPVs to be merged into 2 other SPVs (POWERGRID Ghiror Transmission Limited and POWERGRID South Olpad Transmission Limited).
Row of four KPI cards at top; below, a shareholding panel on the left and a credit-profile panel on the right with blue domestic and green international rating headers; SPV note across the bottom.
Q2 FY27 commissioning: 981 ckm of transmission lines and 14,600 MVA of transformation capacity. Lines: 765 kV Koppal-II PS-Raichur, Bidar PS-Maheshwaram, Sikar-II-Khetri; 400 kV Bikaner-II-Bikaner-III. Substations: 765 kV Koppal-II and Bidar. H1 FY27: 2,616 ckm and 25,100 MVA. TBCB projects fully commissioned: Ramgarh-II and Bidar transmission systems. After Sept '26: 765 kV Koppal-II PS-Narendra (New), 400 kV Koppal-II PS-Gadag-II PS, Gadag-II PS substation; TBCB project Koppal Gadag transmission system commissioned.
Top half: two KPI cards with target icons and lists of lines and substations by voltage tag; right column with blue H1 FY27 box and green TBCB box. Bottom: green banner for post-September commissioning with two outlined boxes and a footer strip.
Consolidated, ₹ crore. Capex FY27 guidance ₹37,000-40,000 crore; Q2 capex 9,099 (FY27) vs 8,404 (FY26), H1 16,864 vs 15,385. Capitalisation FY27 guidance ₹25,000-30,000 crore; Q2 4,023 vs 2,205, H1 9,300 vs 3,888. Capitalisation includes assets capitalised as finance lease and excludes FERV.
Two halves split by a vertical rule; each has a guidance header box over a clustered bar chart comparing FY26 (blue) and FY27 (green) for Q2 and H1.
Availability 99.81% in H1 FY27 vs 99.83% in H1 FY26, above the 99.75% level that earns full incentive. Tripping per line 0.17 in H1 FY27, unchanged. NTAMC (National Transmission Asset Management Centre) upgradation completed and I3SOC (Integrated Indigenous Information Security Operation Centre) operationalised. Photo of Srinagar-Drass line restoration on 29 Oct 2026 at 11,800 ft, -10°C.
Left column with bullet metrics over a control-room photo and a highlight box; right column with a tall snow-covered tower photo and caption.
Indigenous 220 kV mobile GIS bay charged, enabling rapid deployment for emergencies and boosting grid resilience and uptime.
Two side-by-side night photos of the trailer-mounted GIS bay and the site team, with a bold heading and two bullets below.
MeitY, MoP and POWERGRID collaboration for indigenous design and development of silicon carbide (SiC) MOSFET-based power modules for VSC HVDC; ~13,000 SiC modules in 3.3 kV, 4.5 kV and 6.5 kV classes to be developed and deployed by 2030-31; pilot is upgrading POWERGRID's 1,000 MW Pusauli back-to-back station to VSC-HVDC.
Large event photo on the left, bold lead line and three bullets on the right.
Insulated Aerial Work Platform (IAWP) deployed, enabling safe maintenance without system outages. Heavy-lift programmable drone with 100 kg payload developed and deployed to carry tower parts, cement bags and insulator strings to hard-to-reach locations.
Two equal photos (truck-mounted platform, heavy-lift drone) separated by a thin divider, each with bullet captions underneath.
TBCB wins till 31 Oct 2026. Nine ISTS projects: Barmer HVDC (Rajasthan REZ Ph-IV, Part 5), Lakadia REZ Phase-II, Jam Khambhaliya Ph-II + Jamnagar (Kalyanpur), Kurnool-V REZ Phase-I, WR-ER network expansion (Part-A), Lakadia/JKZ/Jamnagar common system Part-C, green hydrogen hub Kakinada, SynCon at Fatehgarh-II, augmentation at Bhadla-III, Ramgarh, Kanpur. Callouts beside the ISTS list show ₹8,107 crore and ₹7,664 crore annual tariff. Two InSTS projects (Humnabad, Karnataka; 765 kV GIS Pune West, Maharashtra) with ₹443 crore annual tariff. The slide does not spell out what separates the two ISTS tariff figures.
Table with blue ISTS header and green InSTS header (S No, Project, Type), with tariff callout boxes on the right connected by chevrons.
As on 30.09.2026: TBCB ₹1.95 lakh crore (89%), RTM ₹0.25 lakh crore (11%, excluding Pang-Kaithal HVDC and offshore projects), total ₹2.20 lakh crore including CWIP of ₹55,419 crore. Pang evacuation scheme ₹0.31 lakh crore, being changed to a 3.75 GW EHVAC scheme (discussed at the 44th NCT meeting on 29 Oct 2026). Other businesses ₹0.04 lakh crore: smart metering ₹2,796 Cr, data centre ₹714 Cr, cross-border ₹275 Cr, BESS ₹250 Cr, international ₹220 Cr.
Composition list with bullet dots, value and percentage columns, dashed total rule, then two additional line items below.
As on 31 Oct 2026: under bidding (A) ₹63,086 crore across 28 projects; to be floated (B) ₹4,147 crore across 3 projects; total approved cost ₹67,233 crore. Under-bidding mix: ISTS 10 projects ₹45,620 crore (72%) and InSTS 18 projects ₹17,466 crore (28%). Green Energy Corridor-III (source PIB): total scheme printed as '₹1,86 lakh crore' (₹1,36 lakh crore for InSTS, ₹50,000 crore for BESS, including ₹0.54 lakh crore CFA), target completion FY2032-33, to evacuate 135 GW of RE and deploy 50 GWh of BESS.
Top row of three value cards with an arrow to the total; bottom left donut chart with legend; bottom right blue GEC-III header box with bullets.
Billing H1 FY27 ₹22,327 crore (H1 FY26 ₹18,248 crore); realisation ₹22,806 crore (₹18,737 crore); realisation rate 102.1% (102.7%). Outstanding dues at quarter end (₹ crore, >45 days / <45 days): Q2 FY26 1,512 / 1,387; Q1 FY27 1,458 / 1,005; Q2 FY27 1,285 / 1,141. Receivable days (dues beyond 45 days): 15.16 → 12.11 → 10.54. The slide title reads 'H1 2026' while the data is for H1 FY27.
Three KPI cards at top; stacked horizontal bar chart on the left and a vertical bar chart with a dashed downward trend arrow on the right.
₹ crore, Q2 FY27 vs Q2 FY26: transmission charges 11,191 vs 10,736 (+4%), consultancy 396 vs 492, telecom 229 vs 248, other income 239 vs 194, total income 12,055 vs 11,670 (+3%), opex 1,889 vs 1,790, EBITDA 10,166 vs 9,880, depreciation 3,196, finance cost 2,191, PBT 4,776 vs 4,450 (+7%), tax 909, PAT 3,867 vs 3,566 (+8%). Q1 FY27 PAT 3,598. H1 FY27 vs H1 FY26: total income 23,752 vs 23,115, EBITDA 19,778 vs 19,524, PAT 7,465 vs 7,197 (+4%).
Full-width financial table with eight data columns (Q2 FY27, Q2 FY26, variance, Q1 FY27, variance, H1 FY27, H1 FY26, variance) and shaded subtotal rows.
Operating income bridge (₹ crore): increase in operating income +887 (7.7%; footnote: ₹994 Cr increase in transmission income only), regulatory impact -354 (-3.1%), non-recurring items -193 (-1.7%), net increase 340 (2.9%). PAT bridge: increase in PAT 322 (9.0%), regulatory impact +60 (1.7%), non-recurring items -82 (-2.3%), net 300 (8.4%). The last PAT bar is labelled 'Net Increase in PBT' with a down arrow, which looks like a labelling slip since PAT rose about 8.4%.
Two waterfall charts side by side under blue header bars (Operating Income, PAT), green for increases and light blue for decreases, percentage labels above each bar.
₹ crore, Q2 FY27 vs Q2 FY26: transmission charges 9,843 vs 9,867, consultancy 206 vs 133 (+55%), other income 1,851 vs 1,348 (+37%), total income 11,900 vs 11,348 (+5%), opex 1,605, EBITDA 10,295 vs 9,930, depreciation 2,986, finance cost 2,733, PBT 4,576 vs 4,316, tax 757, PAT 3,819 vs 3,555 (+7%). Q1 FY27 PAT 3,411. H1 FY27 PAT 7,230 vs 7,208 (flat); H1 total income 23,270 vs 22,605.
Same eight-column table format as the consolidated slide with shaded subtotal rows.
As on 30.09.26 vs 30.09.25. Standalone: gross fixed assets ₹2,80,070 vs 2,66,164 crore, CWIP 7,186 vs 13,771, debt 1,51,207 vs 1,35,923, net worth 1,06,090 vs 98,497, H1 EPS ₹7.77 vs 7.75, book value per share ₹114.07 vs 105.90. Consolidated: GFA 3,29,852 vs 2,95,148, CWIP 55,419 vs 47,782, debt 1,51,207 vs 1,35,923, net worth 1,06,748 vs 98,932, H1 EPS ₹8.03 vs 7.74, BVPS ₹114.78 vs 106.37. Debt:equity 59:41 vs 58:42; return on net worth H1 6.81% vs 7.32% (standalone) and 6.99% vs 7.27% (consolidated), not annualised.
Table with grouped Standalone and Consolidated header columns and a shaded Key Financial Ratios sub-section.
₹ crore (Q2 FY27 / Q2 FY26 / Q1 FY27): interest from subsidiaries and JVs 1,201 / 794 / 1,089; incentive (consolidated) 98 / 159 / 123; dividend from JVs 60 / 24 / 17; dividend from subsidiaries 345 / 300 / 254; CSR 82 / 67 / 118; FERV (gross block) 162 / 491 / 47; equity in TBCB operational 10,684 / 4,956 / 9,965; equity in TBCB under construction 4,642 / 3,448 / 3,408; short-term loan 400 / 2,209 / 1,600. Funds tied up in H1 FY27: JBIC green loan JPY 80 billion, SBI term loan/line of credit ₹10,000 crore, UBI ₹5,000 crore, bonds ₹2,000 crore.
Four-column table on the left; green 'Funds Tied Up during H1 FY27' panel with bullets on the right.
POWERGRID Teleservices Limited (PowerTel): telecom revenue ₹283 crore in Q2 FY27 (Q2 FY26 ₹291 crore), 100% backbone availability, ~₹132 crore of orders and 13 new customers in the quarter, >6.4 Tbps links for a hyperscaler, second ILD customer for Bhutan, 200+ links for a GoI strategic entity. Consultancy: revenue ₹396 crore (₹492 crore); smart-meter business at PESL contributed ₹202 crore (UGVCL 20.4 of 36.5 lakh meters, MGVCL 16.4 of 33.6 lakh installed); 40 domestic orders and 2 international orders/extensions; 26-country footprint with Saudi Arabia added in the quarter.
Two side-by-side panels with green and blue left accent bars, each with icon, spaced-letter heading, large figures, sub-metrics and a diamond-icon footer note.
Salient features: 100% Indian-owned infrastructure, 7-layer security, capacity of 1,000 racks and 14 MW, Tier-III certified, expected commissioning in FY2027, MeitY empanelled cloud service provider, sovereign cloud.
Rendering of the data centre building on the left; green 'Salient Features' header with a bullet list on the right.
Four ESG targets: 50% power from RE by 2025, achieved by Dec-25; zero waste to landfill by 2030, >90% of waste diverted; net water positive by 2030, >50% of withdrawal replenished; net zero by 2047, ~20% year-on-year reduction in emissions intensity. CRISIL ESG score rose from 58 (2025-26) to 66 (2026-27), rated 'Strong' in Sep-2026; NSE Sustainability rating 70 (Dec-2025), both on a 0-100 scale.
Row of four target cards with icons and status pills; bottom left horizontal bar chart of CRISIL scores with explanation; bottom right ESG ratings table.
Selected as a finalist in three categories of the S&P Global (Platts) Global Energy Awards 2026: Power - Excellence in Energy; Infrastructure Project of the Year; Targeted Program - Corporate Impact Award. Also received the TERI-UNDP 5th Water Sustainability Award (award ceremony photo).
Awards logo top left with numbered list top right; italic award caption bottom left beside a ceremony photo.
Closing slide with 'Thank you', Investor Relations contact www.powergrid.in and a photo of the 765 kV Nizamabad-Wardha transmission system.
Full-bleed landscape photo of transmission towers with logo, closing text and IR contact overlaid on the left.
Common questions about this slide and the underlying presentation content.
It is the 24-slide 'Q2 & H1 FY27 Investor Presentation' from Power Grid Corporation of India Limited (POWERGRID), dated 3 November 2026 and filed with BSE and NSE. It covers the quarter and half-year ended 30 September 2026.
Indian companies use an April-March fiscal year, so FY27 runs from April 2026 to March 2027. Q2 FY27 is July-September 2026, and H1 FY27 is April-September 2026.
On a consolidated basis, total income was ₹12,055 crore (up 3% year on year), EBITDA was ₹10,166 crore and profit after tax was ₹3,867 crore, up 8% from ₹3,566 crore in Q2 FY26. H1 FY27 PAT was ₹7,465 crore.
The deck shows about ₹2.20 lakh crore of transmission works in hand as of 30 September 2026 (89% TBCB, 11% RTM, including CWIP of ₹55,419 crore), plus a TBCB bidding pipeline of ₹67,233 crore across 31 projects as of 31 October 2026.
The deck uses Indian numbering, as in the original filing. One crore is 10 million, and one lakh crore is 1 trillion rupees. Digits are also grouped the Indian way, for example 1,87,576 ckm.
Yes. You can view every slide and download the PDF from this page. The layout is a useful model for utility or infrastructure results decks: KPI cards, clustered bar charts, waterfall bridges and full consolidated and standalone tables. The data belongs to POWERGRID, so cite the company if you quote it.
POWERGRID filed it with the BSE and the National Stock Exchange of India as part of its Q2 FY27 results disclosure, and it is available through the investor relations section at powergrid.in. The exchange cover letter is not included in this copy.
There are a few small ones. The collections slide is titled 'H1 2026' although its data is for H1 FY27. The last bar of the PAT waterfall is labelled 'Net Increase in PBT' with a down arrow, although PAT rose about 8.4%. The GEC-III amounts are printed with a comma ('₹1,86 lakh crore'), apparently meaning ₹1.86 lakh crore.
Company website with investor presentations and financial results

Create Your Own Slides
Turn your ideas into professional presentations in seconds with 2slides AI.
Reference professional designs, choose your style, and generate slides with perfect text rendering. Powered by Nano Banana—start creating your presentation now.
Your AI Agent for slides. Save time, shine faster with intelligent presentation creation.


© 2026 2slides. All rights reserved.