
Part of Investor presentation examples
POSCO Holdings Q3 2026 Earnings Presentation — the South Korean steel and materials group's third-quarter 2026 results deck, filed with the SEC as an exhibit to Form 6-K on November 2, 2026. Figures are in Korean won (KRW, mostly KRW billion). Consolidated operating profit rose 15% QoQ and 48% YoY to KRW 945 billion on revenue of KRW 19,141 billion, driven by improved steel profitability.
Uses this deck’s cover as a style reference for slides made from your own content. Or pick any page below to use its layout as the reference.
Quick Navigation
Tags
Share the slides
POSCO Holdings Q3 2026 Earnings Presentation — the South Korean steel and materials group's third-quarter 2026 results deck, filed with the SEC as an exhibit to Form 6-K on November 2, 2026. Figures are in Korean won (KRW, mostly KRW billion). Consolidated operating profit rose 15% QoQ and 48% YoY to KRW 945 billion on revenue of KRW 19,141 billion, driven by improved steel profitability.
Detailed view of each slide page, including layout, key content and visual elements.
Standard legal disclaimer stating the deck was prepared to inform shareholders and investors about business outcomes and financial performance, that figures are based on data available at preparation time and may change with audit adjustments, that forward-looking statements are uncertain and subject to risk, and that the company does not guarantee accuracy or completeness. The assembled 6-K slide images begin here; no separate cover slide is included (the first numbered slide is page 3).
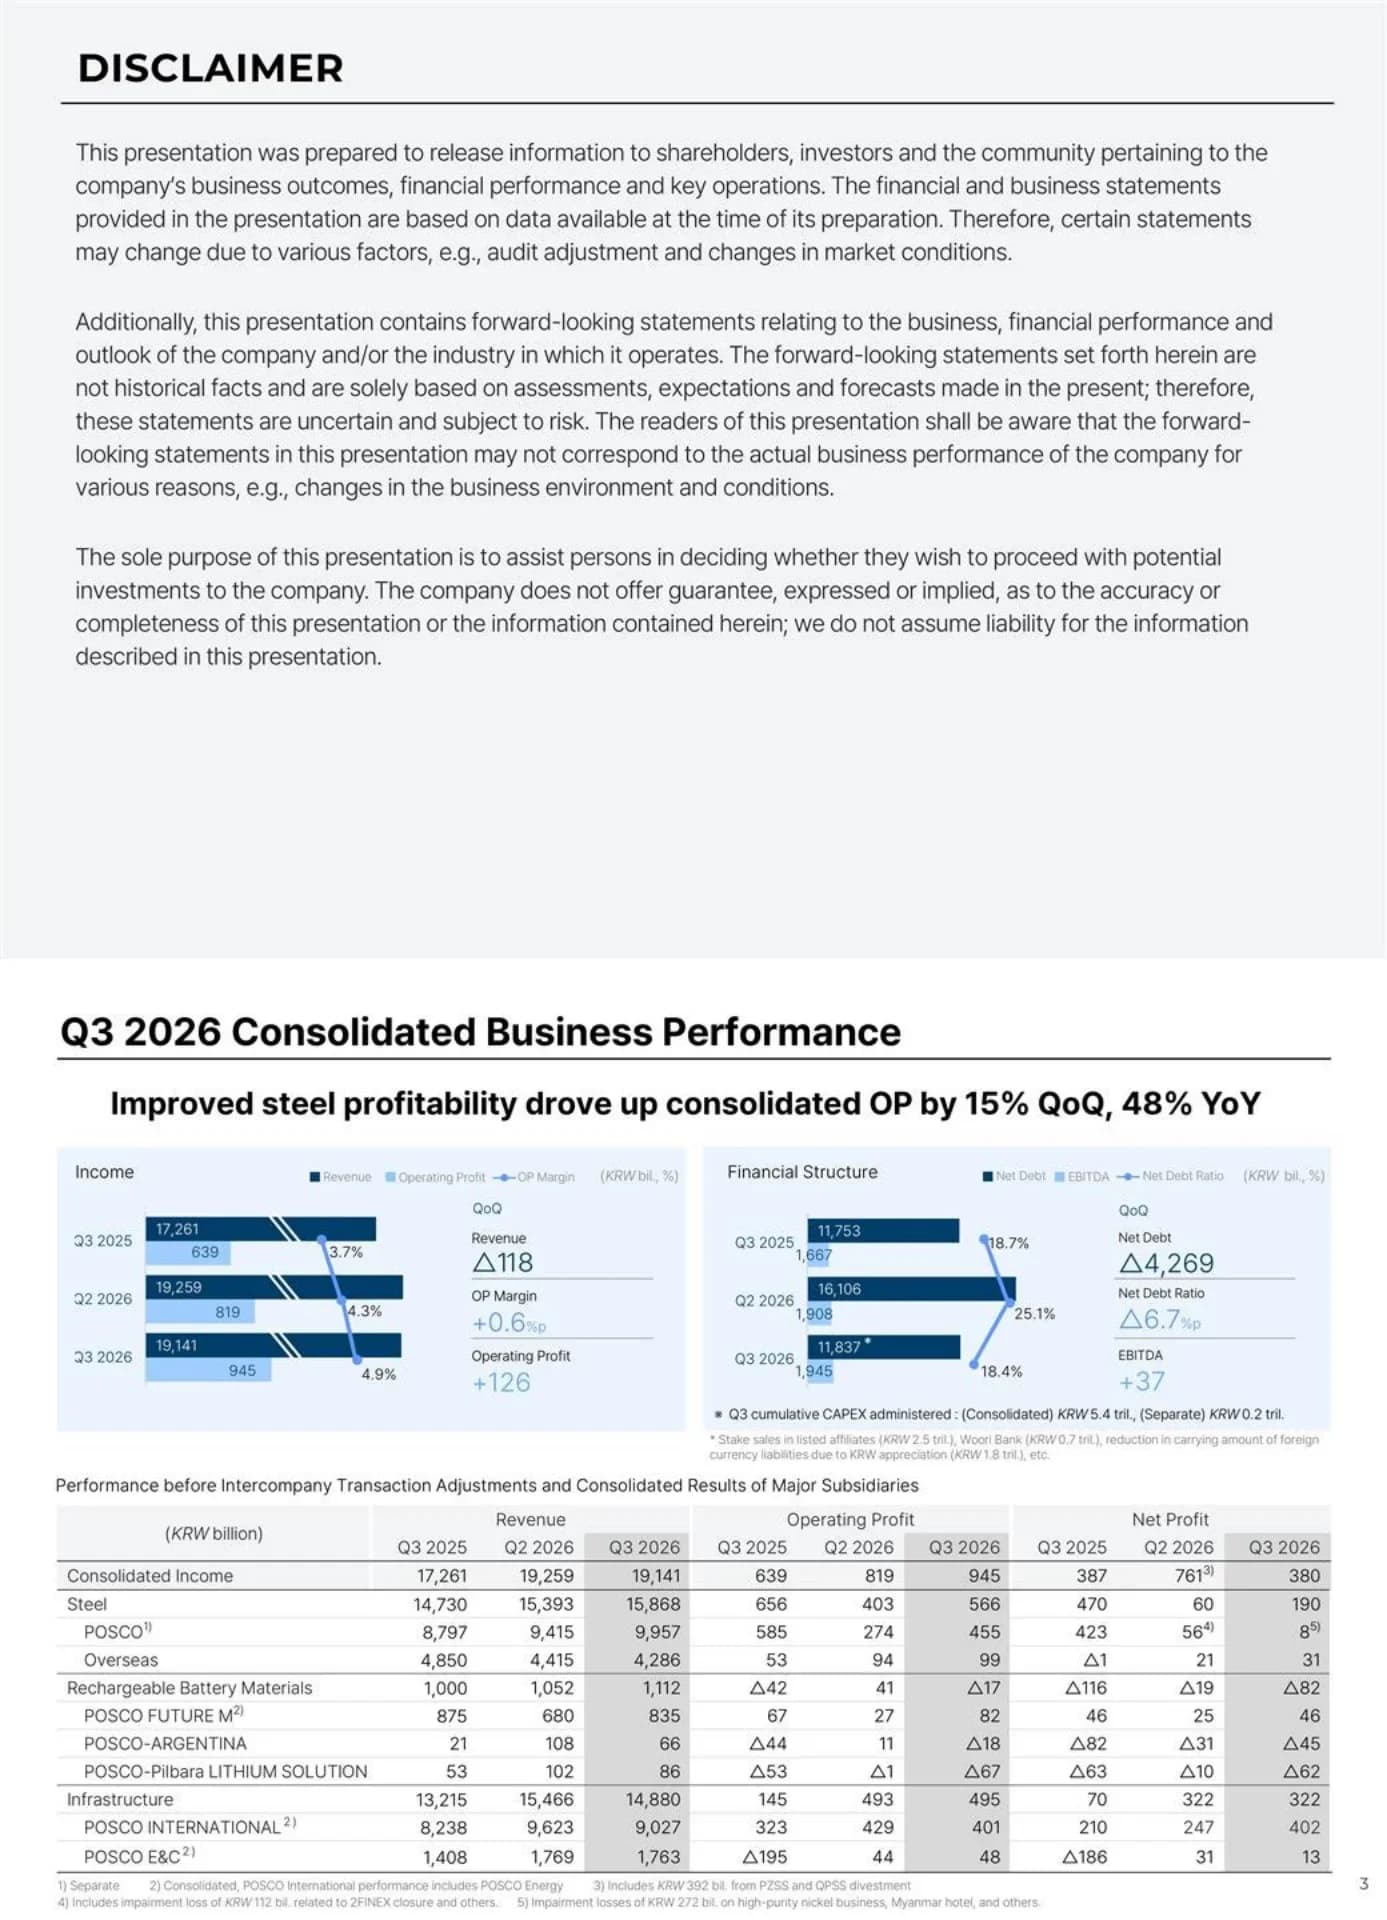
Single text page with bold uppercase title, horizontal rule and three justified paragraphs on a light grey background.
Headline: improved steel profitability drove consolidated operating profit up 15% QoQ and 48% YoY. Consolidated revenue was KRW 19,141 billion in Q3 2026 (Q2 2026: 19,259; Q3 2025: 17,261), down KRW 118 billion QoQ; operating profit KRW 945 billion (Q2: 819; Q3 2025: 639), up KRW 126 billion; OP margin 4.9% (+0.6%p). Net debt fell KRW 4,269 billion QoQ to KRW 11,837 billion, the net debt ratio dropped 6.7%p to 18.4%, and EBITDA rose KRW 37 billion to KRW 1,945 billion. Q3 cumulative CAPEX was KRW 5.4 trillion consolidated and KRW 0.2 trillion separate; the net debt reduction reflects stake sales in listed affiliates (KRW 2.5 trillion), Woori Bank (KRW 0.7 trillion) and lower foreign-currency liabilities from KRW appreciation (KRW 1.8 trillion). A table gives revenue, OP and net profit by major subsidiary: Steel revenue KRW 15,868 billion and OP 566; POSCO (separate) revenue 9,957, OP 455, net profit 8; Overseas steel OP 99; Rechargeable Battery Materials revenue 1,112 and an operating loss of 17; POSCO FUTURE M OP 82; POSCO-ARGENTINA operating loss 18; POSCO-Pilbara LITHIUM SOLUTION operating loss 67; Infrastructure revenue 14,880 and OP 495; POSCO INTERNATIONAL OP 401; POSCO E&C OP 48. Consolidated net profit was KRW 380 billion vs 761 in Q2 (Q2 included KRW 392 billion from the PZSS and QPSS divestment). Footnotes note a KRW 112 billion impairment related to the 2FINEX closure and KRW 272 billion of impairment losses on the high-purity nickel business, a Myanmar hotel and others.
Title and bold headline, two side-by-side light-blue panels (Income bar chart with OP margin line and QoQ callouts; Financial Structure bar chart with net debt ratio line and QoQ callouts), followed by a full-width subsidiary results table with three column groups (Revenue, Operating Profit, Net Profit) and small footnotes.
Three growth initiatives. POSCO: 8CGL groundbreaking (Sept. 8) — a KRW 480 billion investment in Gwangyang for a new 450Ktpa automotive galvanizing line due for completion in 2028, producing 1,900mm extra-wide ultra-high-strength steel for larger SUVs and RVs, with EAF-linked low-carbon automotive steel. POSCO INTERNATIONAL: acquisition of 100% of Chord's shale gas assets in the Marcellus Basin, Pennsylvania (Sept. 17), securing 1 Mtpa of LNG capacity — a USD 550 million investment equivalent to 1.3 Tcf of gas reserves, with immediate cash flow from producing assets and year-end equity participation by POSCO under discussion. POSCO FUTURE M: launch of an LFP cathode business — select NCM lines at Pohang 2-2 converted to produce 50Ktpa of LFP cathodes by early 2027, plus long-term agreements with three Korean battery makers including Samsung SDI (KRW 6 trillion for LFP cathodes and related materials over 6 years) and SK On (KRW 1.1 trillion of LFP cathodes, 3+2 years).
Title, centered bold headline with a two-line subheading, then three equal columns each with a blue label, bullet text and a photo or diagram at the bottom.
POSCO Argentina phase 2 was completed on Oct. 6, 2026, lifting lithium output capacity to 50Ktpa, eight years after the Hombre Muerto mining rights were acquired in 2018 (48Ktpa in Argentina plus downstream processing in Korea). Phase 2 plant sits 4,000m above sea level with 23Ktpa of lithium carbonate capacity (USD 950 million investment, equivalent to 25Ktpa lithium hydroxide), operating alongside Phase 1 (25Ktpa, 2024); Argentine lithium carbonate will be converted to lithium hydroxide in Korea from 2027. RIGI (Argentina's Incentive Regime for Large Investments) approval in July lowers corporate tax and grants customs duty exemptions. The roadmap targets 100Ktpa by 2033 and a global top-5 lithium supplier position, with permits fast-tracked through MOUs with the Salta and Catamarca provincial governments and Phases 3 & 4 (50Ktpa) planned using existing mining rights and infrastructure. Expansion chart: 25Ktpa ('24), 50 ('26), 50 hydroxide + 25 carbonate ('30f), 50 + 50 ('33f).
Title and two-line centered headline; left column with labeled rows (Overview, Capacity, Production, Integration), right column with a grey Progress box; bottom band with Policy/Financial Support text and a stacked bar Expansion Plan chart.
POSCO (separate steel company) results. Crude steel production 9,117Kt and sales volume 8,559Kt in Q3 2026 (Q2: 8,884 / 8,357; Q3 2025: 8,791 / 8,241), up 233Kt and 202Kt QoQ; utilization rate 90.9% (+1.4%p); strategic products (carbon-reduced products such as Hyper NO) 27.7% of sales (+0.2%p). Revenue KRW 9,957 billion (+542 QoQ), operating profit KRW 455 billion (+181), OP margin 4.6% (+1.7%p). OP improved on higher selling prices and higher crude steel output despite rising coking coal costs: carbon steel selling price rose from KRW 962K/t to KRW 982K/t (+20K/t), the key raw materials cost index rose from 100 to 104.4 (+4.4%), and logistics and other expenses declined. The OP bridge from KRW 274 billion to 455 billion shows +56 from higher production/sales volume, +180 from higher selling price, −214 from higher raw material unit price and +159 from lower expenses.
Two top panels (Production/Sales vertical bar chart with utilization line; Income horizontal bar chart with OP margin line), each with QoQ callouts, above a bordered box pairing a three-row driver table with an operating-profit waterfall chart.
Results of three overseas steel subsidiaries (KRW billion). PT. Krakatau POSCO (Indonesia): revenue 734 (+28 QoQ), operating profit 49 (+34). POSCO Maharashtra (India): revenue 512 (−31), operating profit 9 (−19). PY VINA (Vietnam): revenue 138 (+18), operating profit 7 (+3). Overall OP improved on higher domestic and export sales volume despite rising raw material costs: PT.KP gained from higher Southeast Asia and North America sales and lower depreciation after revised useful lives, despite weak FX; P-MH declined due to the rainy season and margin squeeze from lower prices; PY VINA rose on expanded exports to Australia and higher selling prices.
Three equal panels separated by dotted lines, each with a horizontal bar chart (three periods) and QoQ revenue and OP callouts, above a bordered commentary box with three bullets.
Battery materials subsidiary results. Revenue KRW 835 billion (+155 QoQ; Q2 680, Q3 2025 875), operating profit KRW 82 billion (+55), OP margin 9.8% (+5.9%p). Energy Material revenue 460 (+132) and OP 52 (+49); Base Material revenue 375 (+23) and OP 30 (+6). Energy Material recovered on higher QoQ sales volumes of cathodes and anodes: cathode (CAM) OP rose on higher selling prices after the first-half lithium price increase, resumed sales to existing customers and recognition of customer compensation; anode (AAM) prices were held back by falling raw material prices, but overseas customers drove higher volume. Base Material improved on higher chemical prices from strong oil prices and increased lime product sales.
Left light-blue Income panel with horizontal bars, OP margin line and QoQ callouts; right Revenue & OP by Segment table (Q3 2025, Q2 2026, Q3 2026, QoQ); bottom bordered commentary box.
Three lithium-related subsidiaries posted losses due to harsh winter weather in Argentina, lower lithium and metal prices and weak FX (KRW 29 billion inventory loss). POSCO-Argentina (P-ARG): revenue KRW 66 billion (−42 QoQ), operating loss 18 (OP down 29 QoQ) after temporary cold-weather production cuts, maintenance and a lithium price drop. POSCO-Pilbara LITHIUM SOLUTION (P-PLS): revenue 86 (−16), operating loss 67 (OP down 66) as ore costs rose relative to selling prices; the company is developing fine-ore processing technology. POSCO-HY Clean Metal (P-HYCM): revenue 46 (−10), operating loss 7 (OP down 10) on lower metal prices, unfavorable FX and raw material costs pushed up by U.S. black mass export restrictions.
Three equal panels with diverging horizontal bar charts (losses extend left) and QoQ callouts, above a bordered commentary box with three bullets.
Trading and energy subsidiary results. Revenue KRW 9,027 billion (−596 QoQ; Q2 9,623, Q3 2025 8,238), operating profit KRW 401 billion (−28 QoQ), OP margin 4.4% (−0.02%p as printed). Energy segment (E&P gas fields, LNG power and terminal) revenue 1,472 (+164) and OP 239 (+13); Steel materials etc. (steel, raw materials, food/palm, industrial materials and consolidation adjustments) revenue 7,555 (−760) and OP 162 (−41). OP grew 24% YoY on higher production at SENEX and Indonesian palm operations: Myanmar gas OP declined on the Q2 cost-recovery base effect and FX (QoQ −KRW 50 billion, YoY +8 billion); SENEX ramp-up and higher supply to LNG liquefaction plants (QoQ +22 billion, YoY +28 billion); palm oil OP rose on lower unit costs from higher PT.PAR production and commercial start of the refining subsidiary (QoQ +7 billion, YoY +69 billion).
Left Income panel with horizontal bars and margin line; right Revenue & OP by Segment table with two footnotes; bottom bordered commentary box with three bullets.
Engineering and construction subsidiary results. Revenue KRW 1,763 billion (−6 QoQ; Q2 1,769, Q3 2025 1,408), operating profit KRW 48 billion (+4 QoQ; Q3 2025 was a loss of 195), OP margin 2.7% (+0.2%p). By segment: Plant revenue 566 (+73) and OP 3 (+53, from a loss of 50); Construction revenue 1,156 (−79) and OP 48 (−48); the Infrastructure segment was folded into Plant in Q4 2025. OP improved by focusing on profitable projects despite fewer working days in extreme summer heat, with reduced liquidated damages on the Poland incinerator project. Q3 orders totaled KRW 4.4 trillion, including Gochang offshore wind and group-wide projects (KRW 0.6 trillion) and KRW 3.8 trillion of mixed-use complex (Dongtan) and urban redevelopment projects (Gwangmyeong, Bundang).
Left Income panel with horizontal bars and margin line; right segment table (Plant, Infrastructure, Construction, Consolidated Accounts); bottom bordered commentary box with order-intake summary.
Consolidated income statement in KRW billion for Q3 2025, Q2 2026 and Q3 2026 with QoQ change. Q3 2026: revenue 19,141 (−118), gross profit 1,771 (+112), gross margin 9.2% (+0.6%p), SG&A 826 (−14), operating profit 945 (+126), operating margin 4.9% (+0.6%p), profit before tax 508 (−403), net profit 380 (−381), net profit attributable to controlling interest 242 (−443), EBITDA 1,945 (+37), EBITDA margin 10.2% (+0.3%p), EPS KRW 3,193 (−5,862), and 79,242 thousand outstanding shares (Q3 2025: 80,933 thousand).
Full-width financial table with category column, three period columns and a QoQ column; unit label at top right.
Consolidated balance sheet in KRW billion. Q3 2026: current assets 45,533 (+309 QoQ) including cash balance 15,431 (+1,133), accounts receivable 12,285 (−1,048) and inventories 13,642 (−326); non-current assets 60,560 (−3,929) including tangible assets 41,376, intangible assets 5,684 and other long-term financial assets 2,211 (−1,439); total assets 106,093 (−3,620). Liabilities 41,588 (−3,962), of which current 21,735 and non-current 19,853; total interest-bearing debt 27,268 (−3,136). Shareholders' equity 64,505 (+342), controlling interest 56,158 (−1,308). Net debt 11,837 (−4,269) and net debt to equity 18.4% (−6.7%p). Cash balance includes cash equivalents and short-term financial instruments.
Full-width two-level table (category and sub-item) with three period columns and a QoQ column, plus a footnote.
Closing slide with the tagline 'National Supplier of Critical Resources' above the POSCO Holdings logo.
Centered tagline and logo on a white background with generous whitespace.
Common questions about this slide and the underlying presentation content.
It covers POSCO Holdings' third-quarter 2026 results: consolidated revenue of KRW 19,141 billion and operating profit of KRW 945 billion (up 15% QoQ and 48% YoY), results for POSCO's steel business, overseas steel mills, POSCO FUTURE M, the lithium subsidiaries, POSCO INTERNATIONAL and POSCO E&C, key strategic projects, and summarized income statement and balance sheet.
POSCO Holdings filed it with the U.S. SEC as an exhibit to Form 6-K on November 2, 2026, as a foreign private issuer whose ADRs trade in the U.S. The slides in the filing are rasterized images, which is how this 13-page PDF was assembled; the separate cover slide is not part of it.
All amounts are in Korean won (KRW), mostly in KRW billion, with some figures in KRW trillion or USD for overseas investments. Following Korean reporting convention, △ marks a negative number or a decrease, so '△118' means a decline of KRW 118 billion.
The deck highlights the KRW 480 billion 8CGL automotive galvanizing line in Gwangyang, POSCO INTERNATIONAL's USD 550 million acquisition of Chord's Marcellus shale gas assets, POSCO FUTURE M's entry into LFP cathodes with long-term contracts from Samsung SDI (KRW 6 trillion) and SK On (KRW 1.1 trillion), and completion of POSCO Argentina's phase 2, bringing lithium capacity to 50Ktpa with a 100Ktpa target by 2033.
Operating profit rose to KRW 945 billion, but profit before tax fell to KRW 508 billion and net profit to KRW 380 billion. Footnotes cite KRW 272 billion of impairment losses on the high-purity nickel business, a Myanmar hotel and others, and Q2 net profit had been lifted by KRW 392 billion from the PZSS and QPSS divestment.
Yes. It is a good reference for a compact quarterly results deck: a consolidated summary page, strategy highlight pages, one page per segment or subsidiary with a bar chart, table and commentary box, and summarized financial statements at the end. Download the PDF to study the layout and adapt the structure to your own numbers.
The main charts and tables are clearly legible. The smallest footnotes, such as those under the consolidated subsidiary table on page 2, are readable but small, so check the original Form 6-K exhibit on SEC EDGAR when citing exact footnote amounts.
Original 6-K filing containing the Q3 2026 earnings presentation slides

Create Your Own Slides
Turn your ideas into professional presentations in seconds with 2slides AI.
Reference professional designs, choose your style, and generate slides with perfect text rendering. Powered by Nano Banana—start creating your presentation now.
Your AI Agent for slides. Save time, shine faster with intelligent presentation creation.


© 2026 2slides. All rights reserved.