
2Slides Logo
Preview

PORSCHE 2025 Q3 PPT: Investor Deck, Press and Analyst

58 slides

Part of Investor presentation examples

Porsche AG Q3 2025 Investor Update & Strategic Realignment

134 likes
0 downloads

Quick Navigation

Tags

Porsche AG
Investor Relations
Q3 2025
Automotive Strategy
Luxury Vehicles

Share the slides

Description

Main Topic

Porsche AG Q3 2025 Investor Update & Strategic Realignment

Key Benefits

  • •Detailed overview of Porsche's strategic shift to extend ICE and PHEV lifecycles into the 2030s
  • •Financial analysis of Q3 2025 results, including the impact of extraordinary one-off expenses
  • •Insights into the 'Sonderwunsch' (Special Request) program and high-end individualization strategy
  • •Market performance breakdown comparing North America, Europe, and China
  • •Previews of upcoming product launches including the Cayenne BEV, 718 BEV, and 911 Spirit 70

Target Audience

  • •Institutional and Private Investors
  • •Financial Analysts
  • •Automotive Industry Journalists
  • •Corporate Strategy Professionals
  • •Porsche Stakeholders and Partners

Use Cases

  • •Quarterly financial performance review
  • •Analysis of luxury automotive market trends
  • •Strategic planning for automotive electrification transitions
  • •Assessment of geopolitical impacts (tariffs) on global supply chains
  • •Brand equity and customer loyalty studies

Unique Value Propositions

  • •Transparent breakdown of a €3.2bn extraordinary expense impact on operating profit
  • •Exclusive data on 'Sonderwunsch' wait times (up to 8 years for One-Offs)
  • •Concrete roadmap for balancing combustion and electric drivetrains amidst slowing BEV adoption
  • •Specifics on the restructuring of the Chinese market footprint

Slide Pages (58)

Detailed view of each slide page, including layout, key content and visual elements.

Page 1
Title Slide

Title Slide

Content

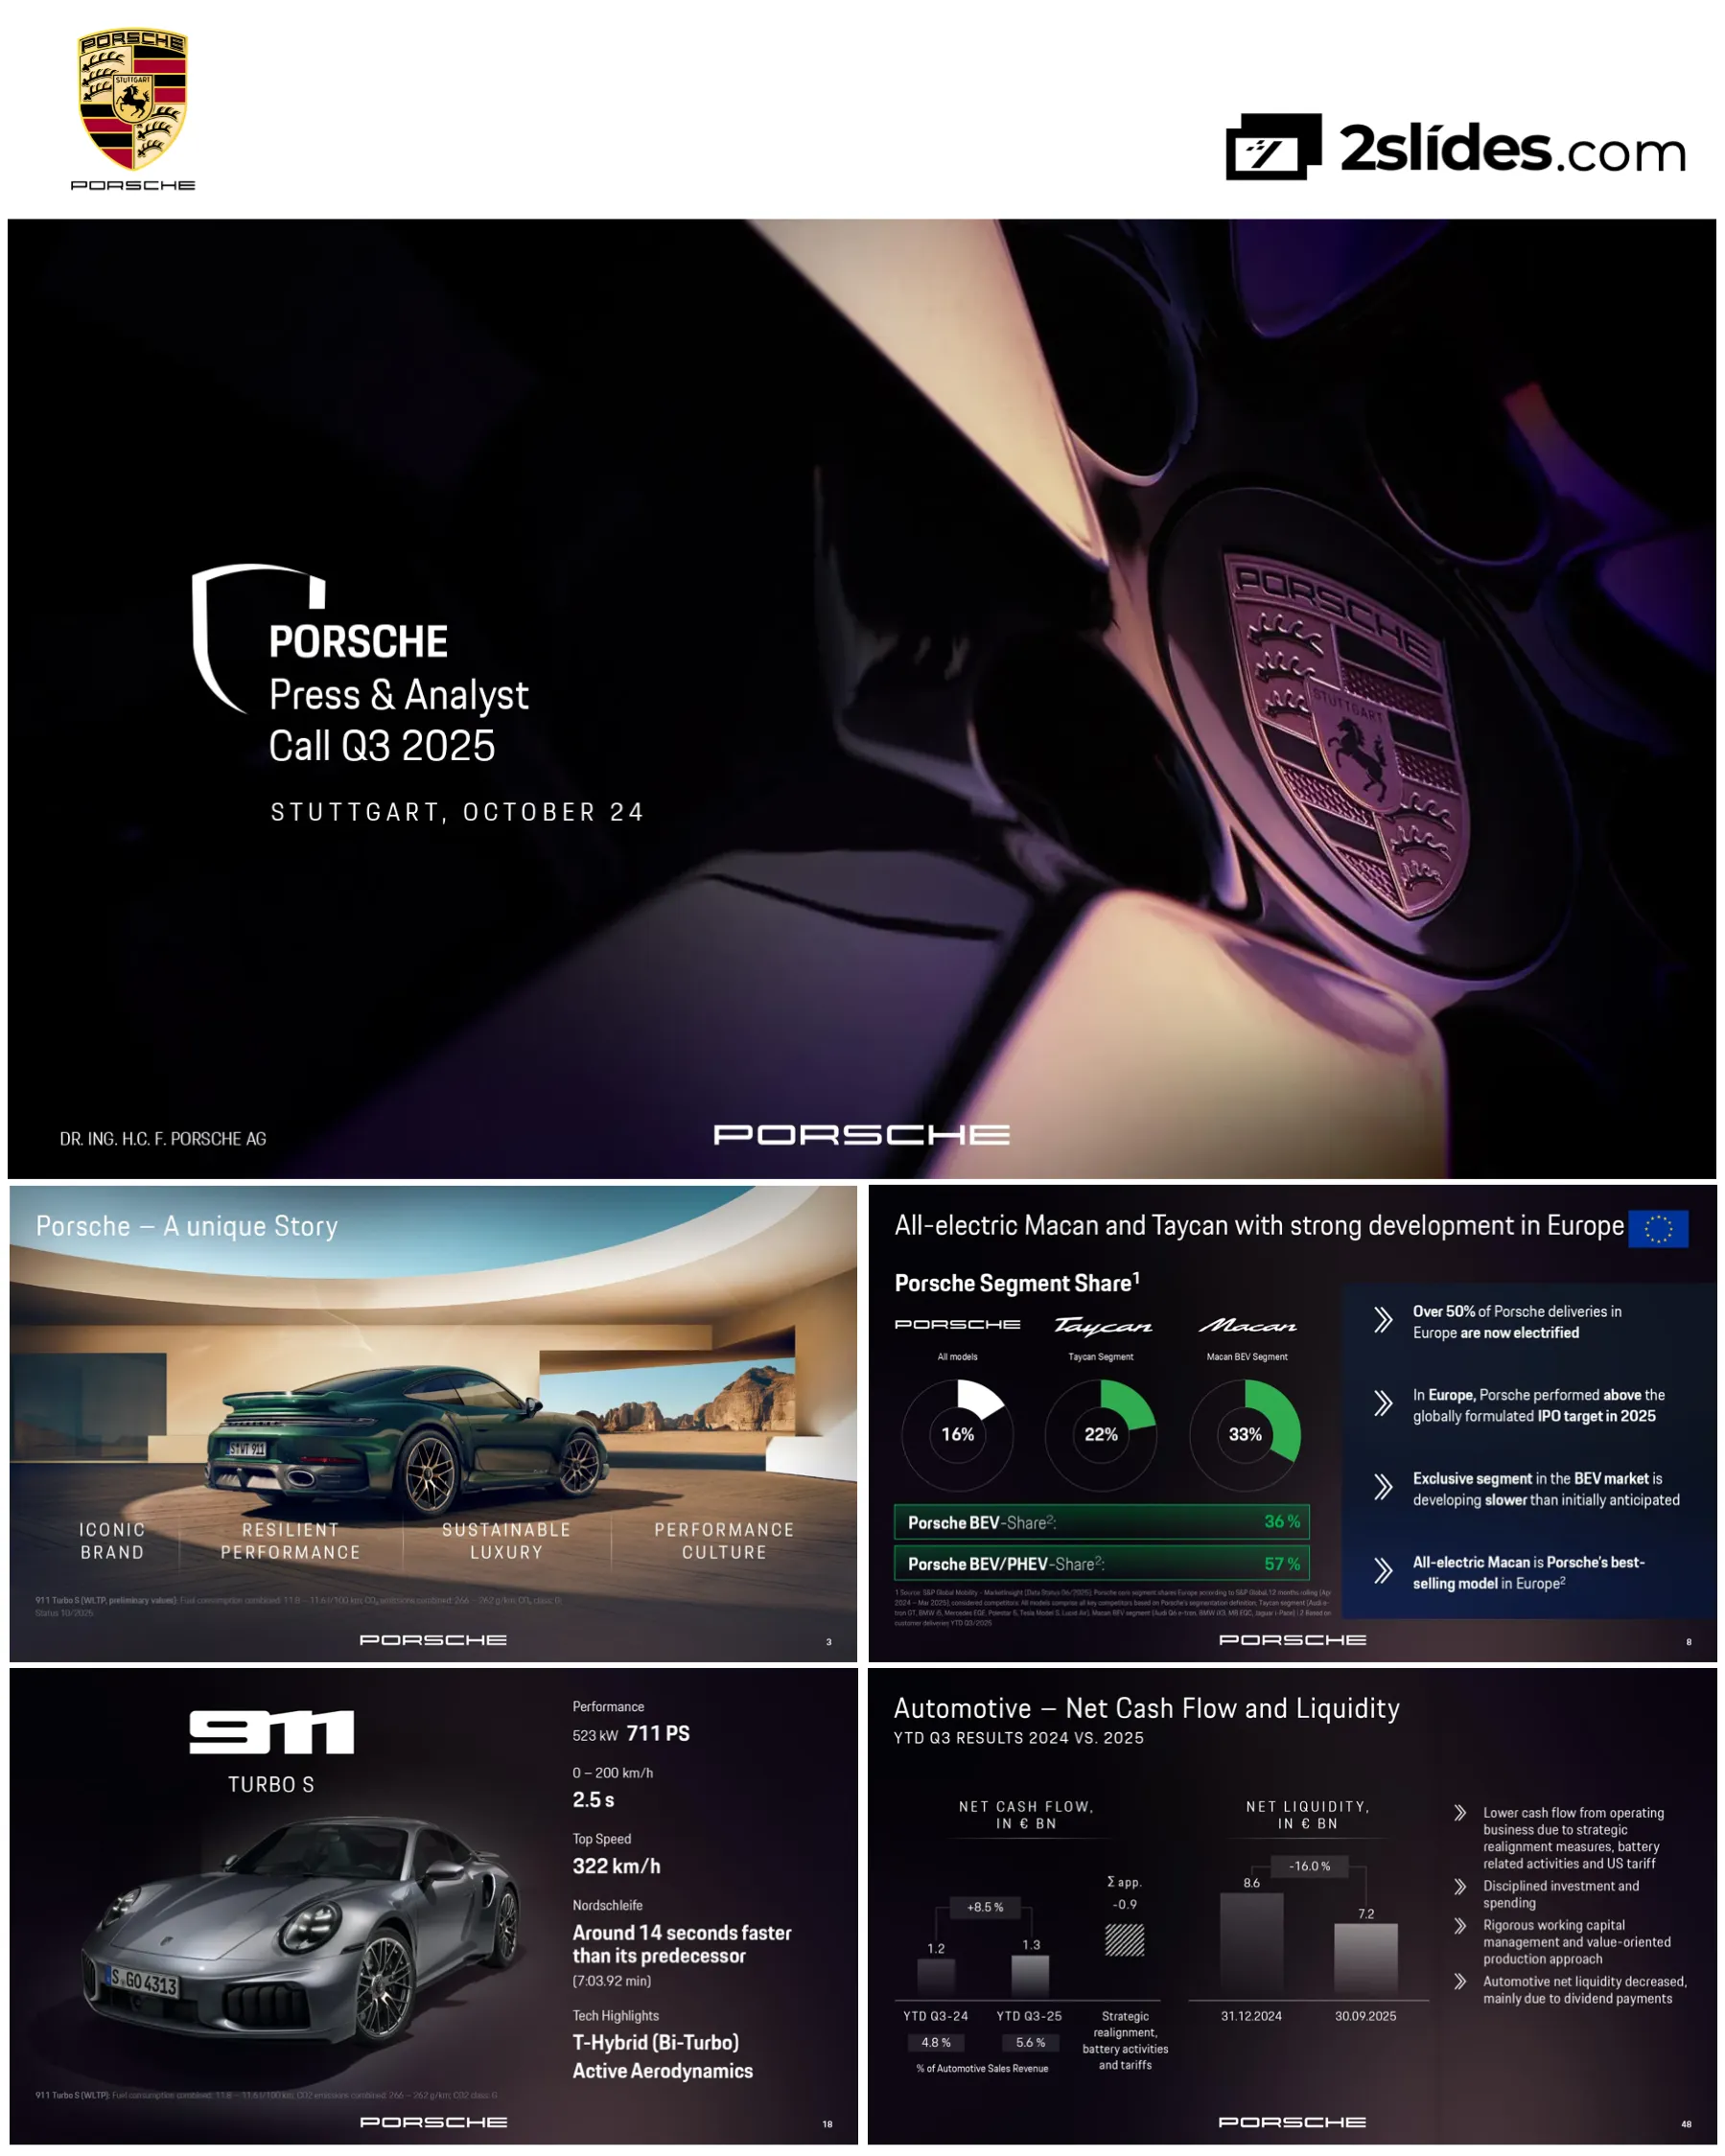
Porsche Press & Analyst Call Q3 2025 title card with date (October 24, Stuttgart) and logo.

Layout Structure

Minimalist black background with high-contrast white typography and Porsche crest outline.

Key Visual Elements

  • •Porsche Crest outline
  • •Large typography
  • •Date and Location
Page 2
Legal/Disclaimer

Disclaimer

Content

Standard legal disclaimer regarding forward-looking statements, risks, and uncertainties.

Layout Structure

Text-heavy legal slide.

Key Visual Elements

  • •Heading
  • •Block text
Page 3
Brand Overview

Brand Pillars

Content

Overview of brand attributes: Iconic Brand, Resilient Performance, Sustainable Luxury, Performance Culture.

Layout Structure

Grid layout with four quadrants featuring imagery and keywords.

Key Visual Elements

  • •911 Turbo S image
  • •Key brand pillars text
Page 4
Market Position

Customer & Brand Foundation

Content

Highlighting strong customer base, unique community, and exceptional loyalty alongside desirable products.

Layout Structure

Vertical split with imagery of customers/events and associated text overlays.

Key Visual Elements

  • •Community event photos
  • •Overlay text emphasizing loyalty
Page 5
Product Portfolio

Porsche Product Lineup

Content

Visual lineup of the current vehicle portfolio (Macan, Taycan, 718, Cayenne, Panamera, 911) labeled as 'NEW'.

Layout Structure

Horizontal panoramic image of all car models.

Key Visual Elements

  • •Vehicle lineup photography
  • •Model names
Page 6
Regional Performance

North America Performance

Content

Delivery statistics for North America (up 4.8%) and J.D. Power award recognition.

Layout Structure

Data points on left, awards graphics on right.

Key Visual Elements

  • •Delivery numbers comparison
  • •J.D. Power badge
Page 7
Data Visualization

BEV/PHEV Market Performance

Content

Comparison of Porsche's BEV/PHEV share against the total automotive market, showing significantly higher electrification rates.

Layout Structure

Bar charts comparing market averages vs. Porsche performance.

Key Visual Elements

  • •Percentage bar charts
  • •Comparative data
Page 8
Data Visualization

Macan and Taycan Europe Performance

Content

Market share data for Macan and Taycan in Europe, highlighting electrification success (57% BEV/PHEV share).

Layout Structure

Donut charts displaying segment shares.

Key Visual Elements

  • •Donut charts
  • •Percentage statistics
Page 9
Strategy

Strategy 2030 Adaptation

Content

Strategic pivot responding to 'New Situation' (BEV adoption, Geopolitics, Supply Chain).

Layout Structure

Flowchart style connecting external factors to strategy pillars.

Key Visual Elements

  • •Container ship image
  • •Charging station image
  • •Strategic pillars diagram
Page 10
Strategic Plan

Financial Resilience Measures

Content

Overview of strategic realignment regarding China, Product Portfolio, and structural costs to ensure long-term resilience.

Layout Structure

Two-column layout: Environment factors vs. Strategic Reaction.

Key Visual Elements

  • •China flag icon
  • •US flag icon
  • •Battery icon
Page 11
Market Analysis

Market Expectation Adjustment

Content

Visual representation of the gap between previous BEV planning and current market expectations.

Layout Structure

Abstract graphical representation of diverging paths/expectations.

Key Visual Elements

  • •Diverging line graphics
  • •12.7% metric
Page 12
Product Strategy

Drivetrain Strategy

Content

Announcement of balanced offering (ICE, PHEV, BEV) well into the 2030s.

Layout Structure

Split image showing internal mechanics vs. exterior design.

Key Visual Elements

  • •Split vehicle image (Half X-ray/Half Real)
  • •Text overlay
Page 13
Roadmap

Product Strategy Roadmap

Content

Four-point plan: Strengthening Brand Core, Higher Flexibility ICE/PHEV, Successful BEV entry, Future BEV portfolio.

Layout Structure

Numbered list with timeline implications.

Key Visual Elements

  • •Model silhouettes
  • •Numbered strategic points
Page 14
Brand Imagery

Brand Core Strength

Content

Visual of the 911 Dakar emphasizing heritage and brand strength.

Layout Structure

Full-bleed image with overlaid text.

Key Visual Elements

  • •911 Dakar photo
  • •Fuel consumption disclaimer
Page 15
Marketing/Brand

Holistic Brand Experience

Content

Statement: 'It's not what you buy, it's what you buy into.'

Layout Structure

Conceptual graphic with an infinity loop track and Porsche crest.

Key Visual Elements

  • •Infinity loop track render
  • •Porsche Crest
Page 16
Strategy

HALO Strategy

Content

Categories of brand core strengthening: Ultimate Performance, Cosmopolitan Design, Outdoor/Adventure, Heritage.

Layout Structure

Grid of four images representing different lifestyle segments.

Key Visual Elements

  • •Lifestyle photography
  • •Segment labels
Page 17
Product Launch

Product Reveal: Spirit 70

Content

Introduction of the 911 Spirit 70 limited edition model (1,500 examples).

Layout Structure

Event photo of the car reveal.

Key Visual Elements

  • •Car reveal photo
  • •Pricing and quantity text
Page 18
Product Specs

911 Turbo S Highlights

Content

Performance specs of the new 911 Turbo S (T-Hybrid): 711 PS, 0-200 km/h in 8.5s.

Layout Structure

Car image with surrounding data points.

Key Visual Elements

  • •911 Turbo S image
  • •Performance metrics
Page 19
Brand Strategy

Desirability & Individualization

Content

Focus on 'Elevating Individualization Experience' and special editions.

Layout Structure

Collage of lifestyle and detail shots.

Key Visual Elements

  • •Lifestyle photography
  • •Spirit 70 badge close-up
Page 20
Data/Operations

Sonderwunsch Demand

Content

Wait times for special request products (One-offs: ~8 years, Restoration: ~2 years).

Layout Structure

List of services with associated wait times alongside vehicle images.

Key Visual Elements

  • •Custom vehicle images
  • •Timeline metrics
Page 21
Strategy Roadmap

Individualization Strategy Evolution

Content

Roadmap moving from 'Scaling' to 'Full Potential' in individualization and classic services.

Layout Structure

Timeline/Step chart (1.0, 2.0, 3.0).

Key Visual Elements

  • •Sonderwunsch logo
  • •Exclusive Manufaktur logo
Page 22
Operations/Facilities

Home of Individualization

Content

Visuals of the facilities dedicated to individualization and classic restoration.

Layout Structure

Photos of factory/workshop buildings.

Key Visual Elements

  • •Building photography
Page 23
Product Action

Higher Flexibility ICE/PHEV

Content

Visual of 911 GT3 RS on track, symbolizing the commitment to combustion engines.

Layout Structure

Action shot of vehicles on a racetrack.

Key Visual Elements

  • •911 GT3 RS on track
Page 24
Product Portfolio

ICE and PHEV Updates

Content

New models: 911 GTS, Panamera GTS, Cayenne GTS.

Layout Structure

Three vehicle front-view images arranged horizontally.

Key Visual Elements

  • •Vehicle front-ends
  • •Model names
Page 25
Roadmap

Future ICE/PHEV Offerings

Content

Roadmap additions: New B-SUV, Top ICE derivatives for 718, New D-SUV.

Layout Structure

Silhouette graphics of future models.

Key Visual Elements

  • •Car silhouettes under covers
Page 26
Product Portfolio

Luxury BEV Race

Content

Lineup of electric vehicles: Taycan (2019) and Macan BEV (2024).

Layout Structure

Group shot of electric models under a bridge.

Key Visual Elements

  • •EV lineup photo
  • •Launch years
Page 27
Future Product

New BEV Product Highlights

Content

Teaser for upcoming Cayenne BEV and 718 BEV.

Layout Structure

Two car silhouettes under covers.

Key Visual Elements

  • •Covered vehicle graphics
  • •Model names
Page 28
Tech Specs

Cayenne BEV Tech Highlights

Content

Technical specs for Cayenne BEV: 400 kW charging, >600km range, >1000 PS.

Layout Structure

Side profile of camouflaged prototype with overlaid specs.

Key Visual Elements

  • •Camouflaged prototype image
  • •Performance statistics
Page 29
Technology Innovation

Porsche Wireless Charging

Content

Introduction of wireless charging technology for future BEVs.

Layout Structure

Graphic of a charging pad and vehicle wheel.

Key Visual Elements

  • •Charging pad render
  • •Feature list
Page 30
Technology Strategy

In-Car Tech Update

Content

Strategy for AI, OTA capabilities, and China-specific infotainment.

Layout Structure

Text listing three key tech pillars.

Key Visual Elements

  • •Text blocks
Page 31
Product Strategy

Portfolio Flexibility

Content

Overview of Sports Cars, Limousines, and SUVs with flexible drivetrain options.

Layout Structure

Categorized columns for vehicle types.

Key Visual Elements

  • •Category headers
Page 32
Corporate Strategy

Strategic Performance Program

Content

Six areas of action to target profit contributions, including personnel costs and China rightsizing.

Layout Structure

Text and icon layout explaining the program.

Key Visual Elements

  • •Bullet points
  • •Icons
Page 33
HR/Operations

Personnel Cost Measures

Content

Immediate measures for socially responsible staff reductions.

Layout Structure

Three pillars: Structure, Quantity, Costs.

Key Visual Elements

  • •Pillar graphics
Page 34
HR Strategy

Corporate Structure Optimization

Content

Details on restrictive hiring and phased retirement programs (Sonder-ATZ).

Layout Structure

Timeline/Trend graph showing demographic utilization.

Key Visual Elements

  • •Trend graph
  • •Action points
Page 35
Regional Strategy

China Strategy Focus

Content

Three focus areas: Product & Services, Customer & Brand, Organization & Efficiency.

Layout Structure

Three-column text layout.

Key Visual Elements

  • •Strategy headers
Page 36
Data/Restructuring

China Footprint Recalibration

Content

Reduction of Point of Sales (POS) and internal reorganization numbers.

Layout Structure

Data charts showing reduction in numbers from 2024 to 2025/26.

Key Visual Elements

  • •Comparison numbers
  • •Timelines
Page 37
Executive Summary

Q3 2025 Key Developments

Content

Summary of strategic rescaling, extraordinary expenses (€3.1bn total), and product highlights.

Layout Structure

Text-heavy summary slide.

Key Visual Elements

  • •Key message blocks
Page 38
Financial KPIs

Financial Performance Overview (1/2)

Content

Group sales revenue down 6%, Operating profit down 99% (due to one-offs).

Layout Structure

KPI grid with arrow indicators.

Key Visual Elements

  • •KPI boxes
  • •Trend arrows
Page 39
Financial KPIs

Financial Performance Overview (2/2)

Content

Automotive operating profit and liquidity metrics.

Layout Structure

KPI grid continuation.

Key Visual Elements

  • •KPI boxes
  • •Trend arrows
Page 40
Financial Analysis

Group Results YTD Q3

Content

Revenue and Operating Profit bridge. Profit heavily impacted by €3.2bn extraordinary expenses.

Layout Structure

Bar charts comparing 2024 vs 2025.

Key Visual Elements

  • •Comparison charts
  • •Explanation text
Page 41
Financial Bridge

Operating Profit Development Bridge

Content

Waterfall chart showing how strategic realignment expenses reduced EBIT.

Layout Structure

Waterfall chart.

Key Visual Elements

  • •Waterfall graphic
  • •Cost buckets
Page 42
Sales Data

Automotive Sales & Deliveries

Content

Revenue per delivery is up, but total volume is down.

Layout Structure

Side-by-side comparison charts.

Key Visual Elements

  • •Bar charts
  • •Percentage changes
Page 43
Sales Data

Deliveries by Model

Content

Macan sales up 18% (electric ramp-up), 911 and 718 down due to transitions.

Layout Structure

Bar chart comparisons by model line.

Key Visual Elements

  • •Horizontal bar charts
Page 44
Regional Analysis

Deliveries by Region

Content

North America remains largest market; China share shrinking.

Layout Structure

Donut charts comparing regional distribution.

Key Visual Elements

  • •Donut charts
  • •Regional data
Page 45
Financial Metrics

Deep Dive on Vehicle Sales

Content

Revenue per vehicle sold increased to €120k.

Layout Structure

Data table and KPI highlight.

Key Visual Elements

  • •KPI highlight
  • •Regional table
Page 46
Financial Analysis

Automotive Operating Profit

Content

Detailed breakdown of the drop in automotive profit margins.

Layout Structure

Comparison chart.

Key Visual Elements

  • •Bar chart
  • •Margin metrics
Page 47
Financial Services

Financial Services Profit

Content

Financial services profit increased to €0.24bn.

Layout Structure

KPI comparison.

Key Visual Elements

  • •KPI display
Page 48
Cash Flow

Net Cash Flow and Liquidity

Content

Net cash flow at €1.2bn, liquidity down due to dividends.

Layout Structure

Comparison charts.

Key Visual Elements

  • •Bar charts
Page 49
Financial Outlook

Group Return on Sales Outlook

Content

Bridge showing adjustment of outlook from 14% down to ~2% due to tariffs and realignment.

Layout Structure

Waterfall/Bridge chart.

Key Visual Elements

  • •Waterfall chart
Page 50
Forecast

Adjusted Financial Outlook 2025

Content

Detailed table of adjusted forecasts for Revenue, RoS, and Margins.

Layout Structure

Data table comparing 2024 actuals to 2025 outlook.

Key Visual Elements

  • •Data table
Page 51
Corporate Governance

Capital Allocation Policy

Content

Policies on Dividends, Capex, Ventures, Pensions, and Liquidity.

Layout Structure

List of policy points.

Key Visual Elements

  • •Text blocks
Page 52
Conclusion

Key Takeaways

Content

Summary: Solid cash flow, recovery expected in 2026, balanced drivetrain from 2028.

Layout Structure

Summary text.

Key Visual Elements

  • •Bullet points
Page 53
Announcement

IR Website Relaunch

Content

Announcement of new investor relations website design.

Layout Structure

Screenshot of website on laptop/mobile.

Key Visual Elements

  • •Device mockups
Page 54
Closing

Closing Quote

Content

Ferry Porsche quote regarding building dreams.

Layout Structure

Quote on simple background.

Key Visual Elements

  • •Quote text
Page 55
Appendix/Data

Appendix: Income Statement

Content

Condensed Consolidated Income Statement data.

Layout Structure

Financial table.

Key Visual Elements

  • •Table
Page 56
Appendix/Data

Appendix: R&D

Content

Research & Development cost breakdown.

Layout Structure

Financial table.

Key Visual Elements

  • •Table
Page 57
Appendix/Data

Appendix: Balance Sheet (Assets)

Content

Statement of Financial Position - Assets.

Layout Structure

Financial table.

Key Visual Elements

  • •Table
Page 58
Appendix/Data

Appendix: Balance Sheet (Equity/Liabilities)

Content

Statement of Financial Position - Equity and Liabilities.

Layout Structure

Financial table.

Key Visual Elements

  • •Table

Frequently Asked Questions

Common questions about this slide and the underlying presentation content.

Why has Porsche's operating profit dropped so drastically in Q3 2025?

The drop of nearly 99% in operating profit is primarily due to extraordinary one-off expenses totaling approximately €3.1 billion. These costs are associated with the strategic realignment of the product portfolio, battery-related activities, and provisions for US tariffs.

What is Porsche's new product strategy regarding electric vehicles vs. combustion engines?

Porsche has adapted its strategy to extend the lifecycle of ICE (Internal Combustion Engine) and PHEV (Plug-in Hybrid) models well into the 2030s. This is in response to a slower-than-anticipated global transition to BEVs (Battery Electric Vehicles), providing greater flexibility alongside their electric lineup.

How long are the wait times for Porsche's 'Sonderwunsch' (Special Request) cars?

The demand for high-end individualization is very strong. Currently, the wait time for 'One-Off' models is approximately 8 years, while factory 'Re-Commission' projects take about 2 years.

What is the status of the Chinese market for Porsche?

The Chinese market remains challenging, particularly in the luxury segment where there is a shift toward value-oriented sales. Porsche is responding by rightsizing its organization and recalibrating its dealer network, which includes reducing the number of Point of Sales locations.

What are the key specs for the upcoming electric Cayenne?

The upcoming Cayenne BEV is highlighted to feature 400 kW DC charging, a range of over 600 km (WLTP), and a power output exceeding 735 kW (over 1000 PS).

2slides

Create Your Own Slides

Turn your ideas into professional presentations in seconds with 2slides AI.

Create World-Class Slides in Seconds

Reference professional designs, choose your style, and generate slides with perfect text rendering. Powered by Nano Banana—start creating your presentation now.

© 2026 2slides. All rights reserved.


