
Part of Investor presentation examples
Palo Alto Networks Q1 FY27 Earnings Presentation, dated November 18, 2026, is the 34-slide earnings call deck for the first quarter of fiscal year 2027 (fiscal year ends July 31). It reports Q1'27 total revenue of $3.44B (+39% y/y), Next-Generation Security ARR of $9.73B (+66% y/y) and RPO of $21.0B (+35% y/y), then covers platformization momentum, the Prisma AIRS AI security business, the proposed $4.5B all-stock Applied Compute acquisition, Q2 and FY27 guidance, and GAAP to non-GAAP reconciliations.
Uses this deck’s cover as a style reference for slides made from your own content. Or pick any page below to use its layout as the reference.
Quick Navigation
Tags
Share the slides
Palo Alto Networks Q1 FY27 Earnings Presentation, dated November 18, 2026, is the 34-slide earnings call deck for the first quarter of fiscal year 2027 (fiscal year ends July 31). It reports Q1'27 total revenue of $3.44B (+39% y/y), Next-Generation Security ARR of $9.73B (+66% y/y) and RPO of $21.0B (+35% y/y), then covers platformization momentum, the Prisma AIRS AI security business, the proposed $4.5B all-stock Applied Compute acquisition, Q2 and FY27 guidance, and GAAP to non-GAAP reconciliations.
Detailed view of each slide page, including layout, key content and visual elements.
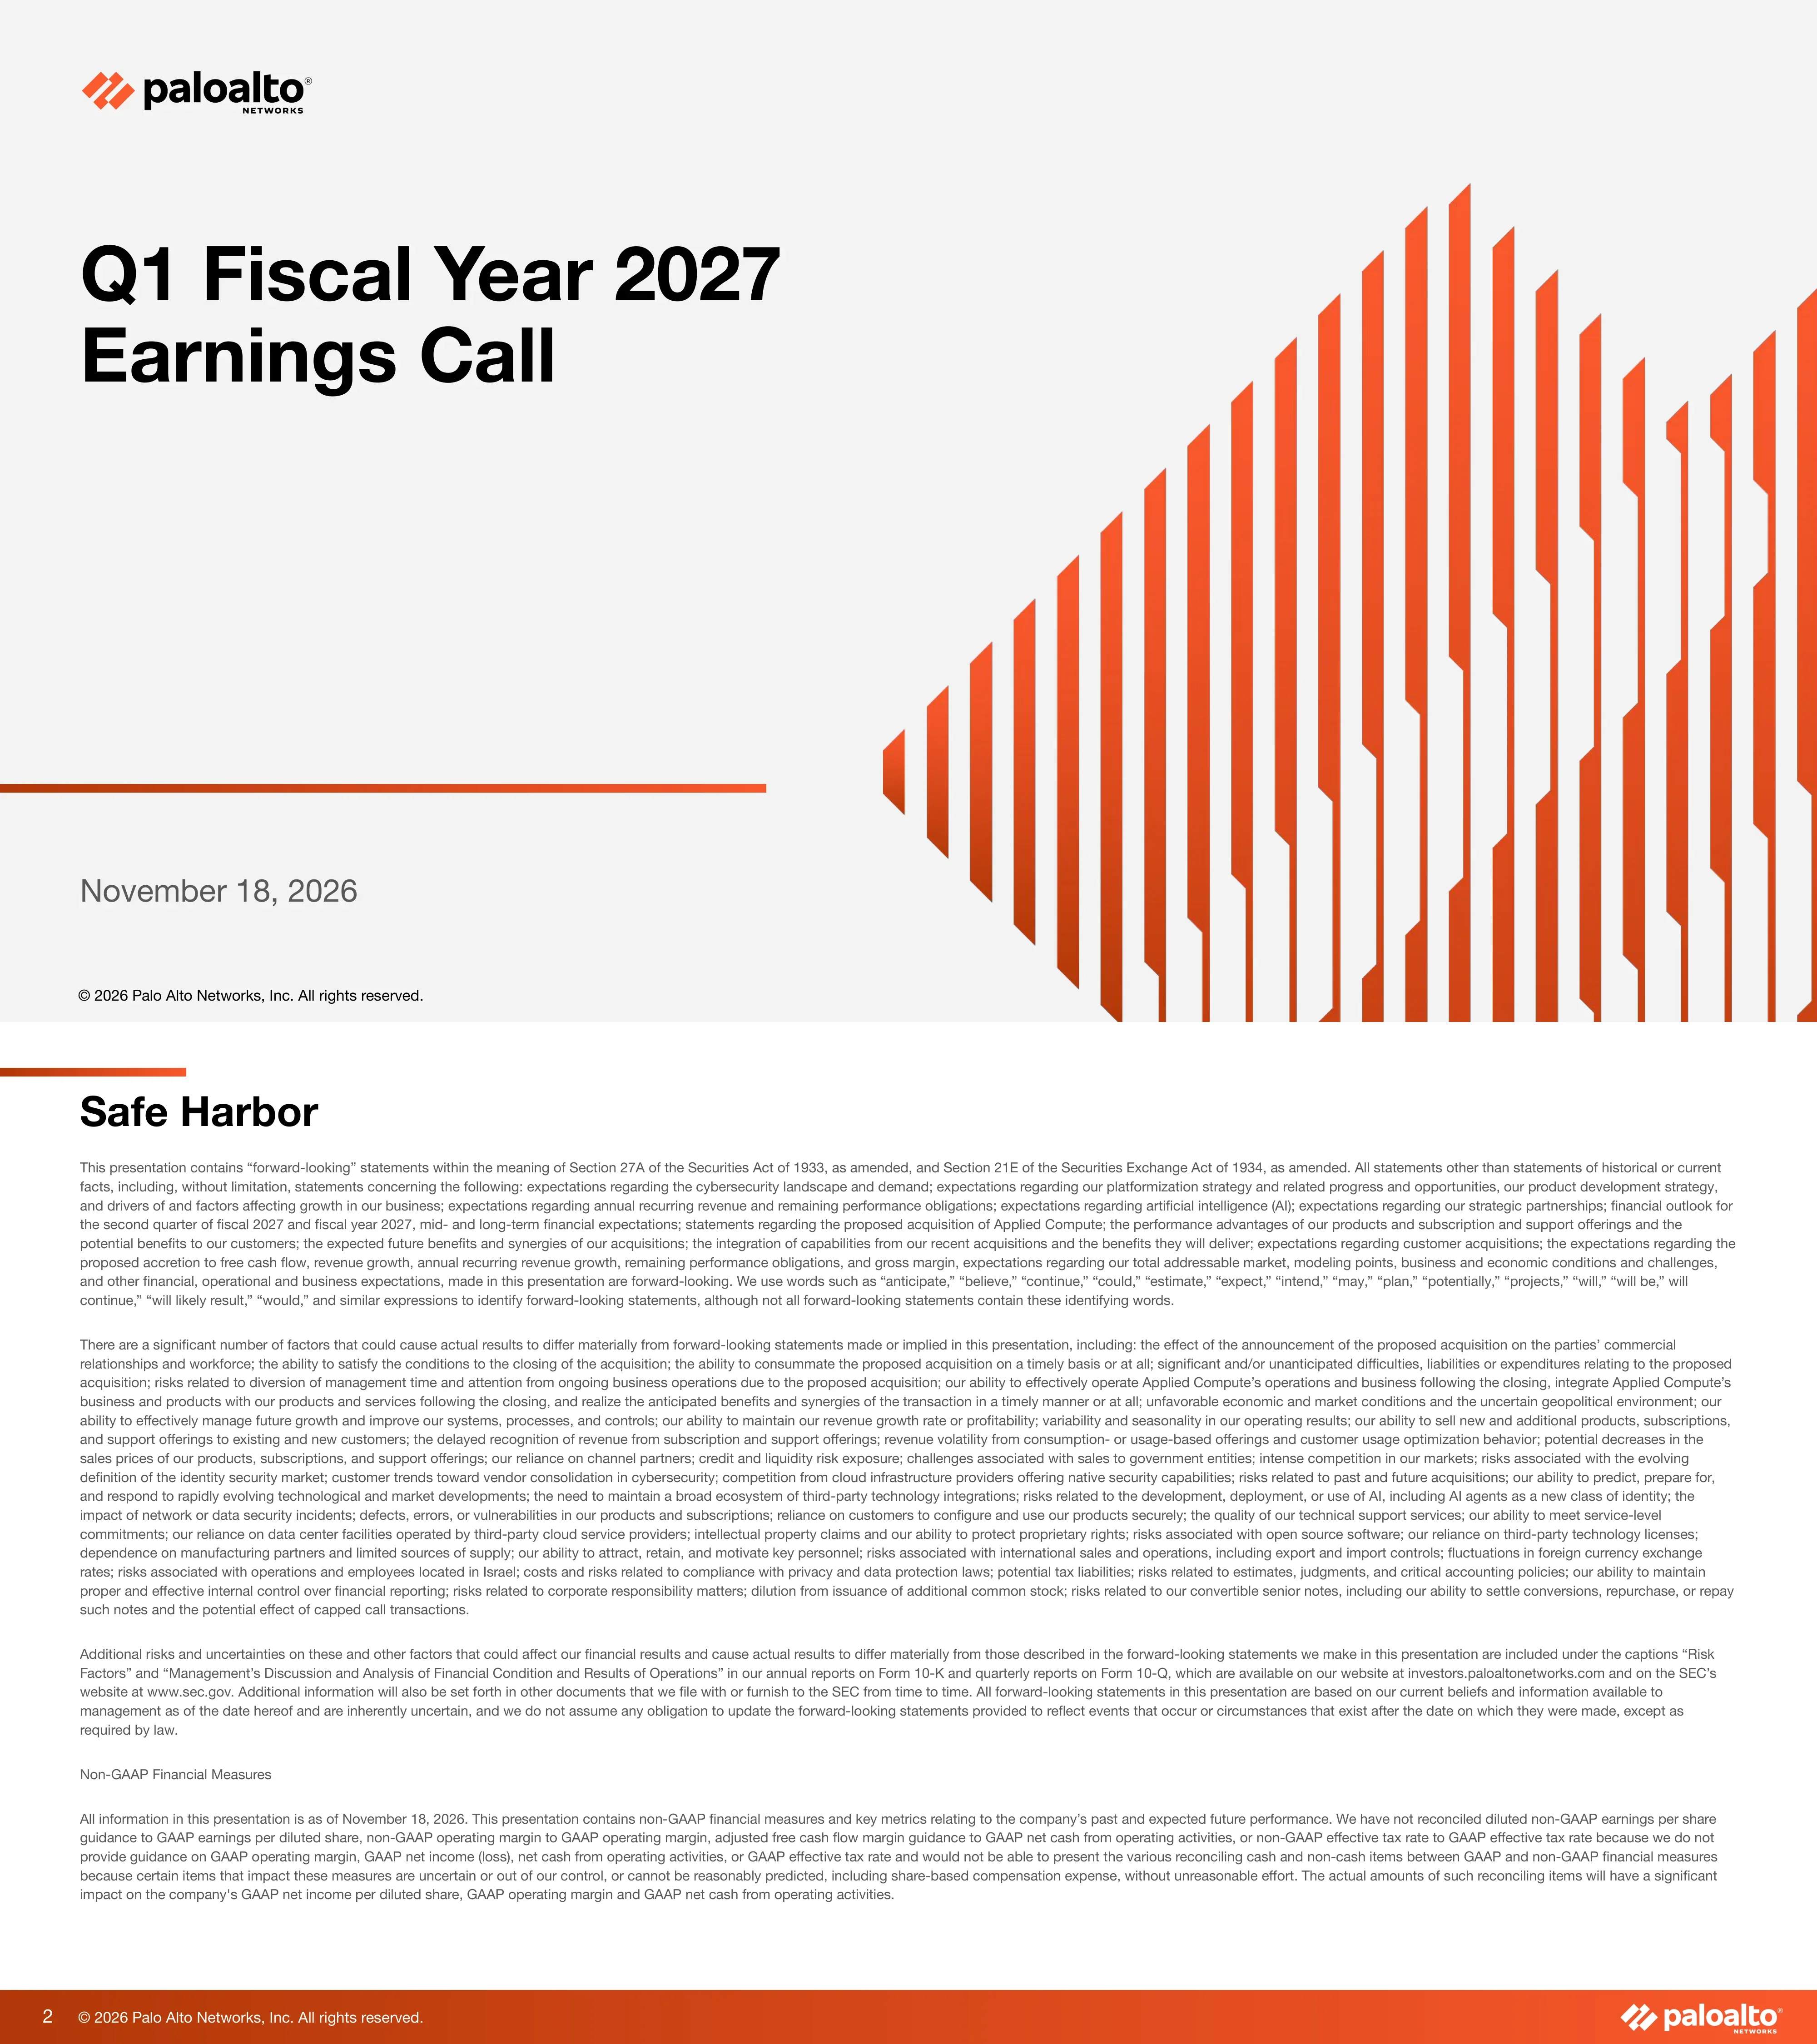
Title slide for the Palo Alto Networks Q1 Fiscal Year 2027 Earnings Call, dated November 18, 2026. Shows the paloalto NETWORKS logo and a copyright line for 2026.
Left-aligned large black title with logo at top left and date at bottom left; a gradient orange rule runs across the lower left; a large orange vertical-stripe graphic rising to the right fills the right half.
Forward-looking statement disclaimer under Section 27A of the Securities Act of 1933 and Section 21E of the Exchange Act. States that all information is as of November 18, 2026, and explains that diluted non-GAAP EPS guidance, non-GAAP operating margin, adjusted free cash flow margin and non-GAAP effective tax rate guidance are not reconciled to GAAP. Mentions the proposed acquisition of Applied Compute among the forward-looking topics.
Heading at top left with an orange accent bar; four dense full-width paragraphs of small gray text; orange footer band with page number 2, copyright and logo.
Speaker introduction slide naming Nikesh Arora as CEO & Chairman, with his portrait and the paloalto NETWORKS logo.
Name in large black type and orange role title at the left, logo below, a large cut-out portrait on the right over faded orange vertical bars.
Q1'27 Total RPO is $21.0B (+35% y/y), NGS ARR is $9.73B (+66% y/y) and total revenue is $3.44B (+39% y/y). Net new NGS ARR is $0.63B (+130% y/y) and net new platformizations are about 170 (up more than 2.5x y/y). Non-GAAP operating margin is 30.7% (+50 bps y/y), TTM adjusted FCF margin is 37.3% ($4.64B TTM adjusted FCF, +24% y/y) and non-GAAP EPS is $1.05 (+13% y/y).
Three horizontal rows, each with an orange headline on the left and rounded KPI cards on the right (three, two, three cards); footnote defining NGS ARR at the bottom.
Network & AI Security revenue rose from $1.90B to $2.28B (+20% y/y), Cortex from $0.42B to $0.65B (+53% y/y) and Idira from $0.29B to $0.35B (+23% y/y, pro forma). KPI callouts include TTM firewall bookings growth of 28%, SASE ARR growth of 30%, XSIAM ARR growth of more than 65%, observability ARR of about 4x, secrets and AI bookings of more than 2x and more than 100 net new Idira logos from the PANW installed base; agentic traffic is up about 9x.
Three tinted rounded columns (red, green, blue), each with a two-bar Q1'26 vs Q1'27 chart and growth arrow, two KPI cards and a dashed callout; footnotes state graphs are not to scale.
Total platformizations grew from about 1,450 (Q1'26) to about 2,160 (Q2'26, pro forma), 2,280, 2,500 and about 2,670 (Q1'27). Callouts: about 170 record Q1 net new platformizations (up more than 2.5x y/y), more than 120% net retention among platformized customers and two-thirds of NGS ARR from platformized customers. Deal examples: $83M (global financial institution), $46M (global consulting firm), $39M (U.S. defense organization) and $20M (global IT services).
Left panel with a five-bar chart and three stat cards beneath; right side a 2x2 grid of deal cards with product tags (NetSec, Idira, Cortex, AIRS, Cloud Security); detailed definitions in footnotes.
Section divider reading AI's Impact on Cybersecurity.
Full-bleed orange gradient with vertical stripe pattern; centered white title; copyright and logo at the bottom.
A line chart of critical and high CVEs per month across 21 major vendors (2022 to 2026) shows a sharp spike, annotated as 7x the 2025 monthly average; the chart has no y-axis values. Six news-style cards dated Nov 12 to Nov 17 cite incidents such as an NSA network disrupted during patching, Microsoft emergency patches and an FAA system glitch. Source: Epoch AI (July 2026).
Left half a line chart with large orange 7x callout; right half six taped paper-note cards in a 2x3 arrangement; source footnote at the bottom.
Three statements: heavy patching volume is expected over the next 18 months with customers more selective about when and what they patch; virtual patching will become necessary across industries; and enterprises face growing urgency to upgrade $1T of legacy cyber and IT infrastructure.
Three stacked full-width white cards with centered bold orange text under a two-line title.
Section divider reading Securing The AI Inflection.
Full-bleed orange gradient with vertical stripe pattern; centered white title.
AI token revenue is shown rising from $20B (2025) to $105B (2026E), $300B (2027E), $700B (2028E) and $1T+ (2029E) to justify capex (source: Altimeter Capital). About 90% of enterprises are not securing their AI implementations; 77% lack core data and AI security practices and 80% are not confident they can secure gen AI models (Accenture). Banner: management believes deployed AI infrastructure will also begin showing vulnerabilities.
Left card with a five-bar chart; right card with a large ~90% stat and two progress bars; full-width gray banner beneath; footnotes for sources.
Prisma AIRS spans Visibility (AI Security Posture Mgmt, AI Red Teaming) and Enforcement (AI Gateway, AI Runtime Security). Q1'27 ARR is about $170M (about 45% growth q/q), customers are more than 1,100 (more than 40% growth q/q), and AI Gateway processed up to 3.8T tokens daily in October. Side message: models are getting smarter and AI security must have frontier-level reasoning to fight AI with AI.
Left side chevron headers for Visibility and Enforcement with product tiles, a Prisma AIRS metrics strip with three cards below; right side a pink arrow panel with two statements and icons.
Framework progressing from Today (ML with Embedded AI): Visibility (What AI do I have?) and Enforcement (What is AI allowed to do?) to Future (AI First): Trust (Can I trust the AI model?), with Secure Advanced Reasoning as the new offering. Banner: trusting LLMs requires verifying, explaining and auditing implementations using an independently trained model.
Three chevron columns, with the third in dark red as the future state, product tiles beneath each, and a full-width gray banner at the bottom.
An area chart of open-weight share of token traffic from 10/1/2025 to 10/1/2026 rises from under 5% to over 60% (only these two values are annotated). Banner: management believes open-weight adoption will power a hundreds-of-billions enterprise AI opportunity requiring security, sovereignty and trust. Source: Vercel AI Gateway; Morgan Stanley Research (October 26, 2026).
Orange header bar above a large area chart with percentage y-axis and two callouts; gray conclusion banner below; source footnote.
Applied Compute is described as a team of frontier AI researchers expected to have 100 AI researchers by fiscal year end and $100M in annualized revenue within 18 months of founding. The joint mission includes 35+ models in training, an ambition of 100-plus MW of global inference capacity in 3 to 5 years with under $3B capex between FY'27-30, and targeting $1 billion of incremental NGS ARR by FY'29. Subject to closing of the proposed acquisition.
Two side-by-side cards: left with Applied Compute logo and four icon bullets; right headed Our Joint Mission with four icon bullets; footnotes at the bottom.
Three closing strategic statements: Q1 was an inflection point for cybersecurity with AI-driven attacks increasing urgency to modernize one trillion dollars of legacy security infrastructure; AI security must evolve from visibility and enforcement to trust in the model itself; and the company intends to enable secure adoption of open weight models.
Three stacked full-width white cards with centered orange bold text under a two-line title.
Speaker introduction slide naming Dipak Golechha as Chief Financial Officer, with his portrait and the paloalto NETWORKS logo.
Name in large black type and orange role title at the left, logo below, a large portrait on the right over faded orange vertical bars.
RPO: $15.5B, $16.0B, $18.4B, $21.2B, $21.0B (Q1'26 to Q1'27) with y/y growth of 24%, 23%, 36%, 34%, 35%. NGS ARR: $5.85B, $6.33B, $8.13B, $9.10B, $9.73B with growth of 29%, 33%, 60%, 63%, 66%. Revenue: $2.47B, $2.59B, $3.00B, $3.41B, $3.44B with growth of 16%, 15%, 31%, 34%, 39%.
Three rounded cards (green, orange, yellow), each with five bars and a growth line with dot markers above; legends at the bottom.
Network & AI Security revenue: $1.90B, $2.02B, $2.09B, $2.33B, $2.28B (+20% y/y). Cortex: $0.42B, $0.43B, $0.48B, $0.59B, $0.65B (+53% y/y). Idira: $0.28B, $0.34B, $0.35B for Q3'26 to Q1'27 (+23% y/y, pro forma); Q1'26 and Q2'26 bars are blank.
Three tinted rounded columns, each with five quarterly bars, a gray dot and y/y label above Q1'27, and a legend.
Non-GAAP gross margin: 76.9%, 76.1%, 75.8%, 74.8%, 75.2%. Non-GAAP operating margin: 30.2%, 30.3%, 27.1%, 29.6%, 30.7%. TTM adjusted FCF margin: 39.3%, 37.9%, 38.5%, 38.4%, 37.3% (Q1'26 to Q1'27).
Three white cards each containing a labeled line chart with five data points and a legend; reconciliation footnote.
Transaction is $4.5 billion all stock, subject to adjustments, including about $500M of cash and pre-paid compute commitments. Anticipated to close in fiscal Q3 2027 subject to customary conditions including regulatory clearance. The company achieved about $100M in annualized revenue within 18 months of founding, has about 70 employees all US-based, and will add $1B to NGS ARR by FY'29.
Four horizontal rows with dark orange gradient label blocks on the left (Transaction Considerations, Anticipated Transaction Close, Company Profile, Expected Top-Line Impact) and bullet text on the right.
Cumulative capex from FY'27-FY'30 is expected to be less than $3 billion. Assuming a Q3'27 close, FY27 and FY'28 operating margin will be up to 100 bps and 200 bps lower, respectively, and return to the current 29-30% range in FY'29. The company is targeting 38%+ adjusted free cash flow margin, excluding data center capex, for FY'28.
Left white card with five bullets under an orange top bar; right dark orange card with a large 38%+ figure and caption.
Table of Q1'27 guidance (as of 9/1/26) versus actual: total revenue $3.30B-$3.31B vs $3.44B (39% y/y); RPO $20.8B-$20.9B vs $21.0B (35% y/y); NGS ARR $9.54B-$9.56B vs $9.73B (66% y/y); non-GAAP diluted EPS $0.96-$0.98 vs $1.05. Other actuals: product revenue $595M, non-GAAP gross margin 75.2%, non-GAAP operating income $1,059M, operating margin 30.7%, GAAP diluted EPS $0.57, adjusted FCF $1,937M.
Table with metric rows, a gray Guidance column and an orange Actual column, with green check marks on rows that met guidance; footnotes below.
Q2'27 guidance (as of 11/18/26): NGS ARR $10.20B-$10.22B (61% y/y), RPO $21.5B-$21.6B (34%-35% y/y), revenue $3.530B-$3.550B (36%-37% y/y), non-GAAP EPS $1.01-$1.03. FY'27 guidance: NGS ARR $11.475B-$11.525B (26%-27% y/y), RPO $25.3B-$25.5B (19%-20% y/y), revenue $14.52B-$14.57B (26%-27% y/y), non-GAAP operating margin 29.5% (+30 bps y/y), non-GAAP EPS $4.26-$4.30, adjusted FCF margin 38.0%.
Table with two orange header columns (Q2'27 and FY'27) and six metric rows; some Q2 cells are empty.
Divider slide reading Q&A for the question-and-answer portion of the call.
Full-bleed orange gradient with vertical stripe pattern and a centered white title.
Divider slide reading Appendix, introducing the modeling points, reconciliations and definitions.
Full-bleed orange gradient with vertical stripe pattern and a centered white title.
Q2'27 and FY'27 non-GAAP effective tax rate of 22%; Q2'27 net interest and other income of $80M-$90M; Q2'27 diluted shares outstanding of 837-842 million; FY'27 diluted shares outstanding of 844-847 million. A footnote explains the long-term 22% non-GAAP tax rate.
Four large bullet lines at the top with mostly empty space below and a small footnote at the bottom.
Reconciles gross profit from GAAP to non-GAAP over Q1'26 to Q1'27. Q1'27 GAAP gross profit is $2,342M (68.0%); adjustments are share-based compensation $60M, acquisition-related costs $1M, amortization of acquired intangibles $184M and litigation-related charges $2M, giving non-GAAP gross profit of $2,589M (75.2%). Non-GAAP gross margin across the five quarters is 76.9%, 76.1%, 75.8%, 74.8%, 75.2%.
Table with orange header, dollar and percent columns for five quarters, indented adjustment rows and a bold total line; footnotes below.
Q1'27 GAAP operating income is $96M (2.8%); adjustments are share-based compensation $622M, acquisition-related costs $55M, amortization $282M and litigation-related charges $4M, giving non-GAAP operating income of $1,059M (30.7%). Q3'26 shows a GAAP operating loss of ($183M), -6.1%.
Same table format as the prior reconciliation, with five quarters of dollar and percent columns and footnotes.
Q1'27 GAAP diluted EPS of $0.57 bridges to non-GAAP diluted EPS of $1.05 (Q1'26: $0.47 to $0.93). Q1'27 adjustments: share-based compensation $0.74, acquisition-related costs $0.07, amortization $0.34, litigation $0.00, change in fair value of convertible notes and capped calls $0.17 and income tax and other adjustments ($0.84).
Two-column table (Q1'26, Q1'27) with orange header, indented adjustment rows and four footnotes.
Q1'27 net cash from operating activities is $1,929M; less purchases of $87M gives free cash flow of $1,842M; adding $95M of acquisition-related payments gives adjusted FCF of $1,937M (56.2% margin). TTM Q1'27 adjusted FCF is $4,638M (37.3% margin), versus $3,754M (39.3%) for TTM Q1'26.
Table with a Q1'27 column and five TTM columns, orange header and footnotes on capex, acquisition and litigation items.
Segment revenue in $ millions for Q1'27: Network & AI Security $2,282, Cortex $647, Idira $353, Corporate & Other $163, total $3,445. Q1'26 was $1,904, $422, no Idira and $148, totaling $2,474. Corporate & Other consists primarily of professional services and financing income.
Simple table with orange header, four segment rows, a bold total row and a footnote.
Compares two ARR definitions. PANW NGS ARR is the total contract value allocated to products and services with revenue recognized (per ASC 606) on the final day of the period, excluding hardware, legacy attached subscriptions, support offerings and professional services. The previous CYBR subscription ARR was based on annualized contract bookings independent of revenue recognition and excluded perpetual-license maintenance.
Two side-by-side bordered boxes, orange for PANW and cyan for the previous Idira definition, each with a headline and definition paragraphs.
Closing slide reading Thank You, with a copyright and proprietary and confidential information notice.
Full-bleed orange gradient with vertical stripe pattern, centered white title, footer text and logo.
Common questions about this slide and the underlying presentation content.
According to the deck dated November 18, 2026, Q1'27 total revenue was $3.44B (+39% y/y), NGS ARR was $9.73B (+66% y/y) and total RPO was $21.0B (+35% y/y). Non-GAAP operating margin was 30.7% and non-GAAP diluted EPS was $1.05 (+13% y/y). TTM adjusted free cash flow was $4.64B, a 37.3% margin.
Slide 24 gives Q2'27 guidance of revenue $3.530B-$3.550B, NGS ARR $10.20B-$10.22B, RPO $21.5B-$21.6B and non-GAAP EPS $1.01-$1.03. FY'27 guidance is revenue $14.52B-$14.57B, NGS ARR $11.475B-$11.525B, RPO $25.3B-$25.5B, non-GAAP operating margin 29.5%, non-GAAP EPS $4.26-$4.30 and adjusted FCF margin 38.0%.
Slide 23 compares actuals with guidance as of 9/1/26. Revenue was $3.44B versus guidance of $3.30B-$3.31B, RPO was $21.0B versus $20.8B-$20.9B, NGS ARR was $9.73B versus $9.54B-$9.56B and non-GAAP EPS was $1.05 versus $0.96-$0.98.
The deck describes a proposed $4.5 billion all-stock acquisition, subject to adjustments and including about $500M of cash and pre-paid compute commitments. It is anticipated to close in fiscal Q3 2027 subject to regulatory clearance. Management says it will add $1B to NGS ARR by FY'29, with cumulative capex under $3B from FY'27-FY'30 and operating margin up to 100 bps (FY27) and 200 bps (FY'28) lower assuming a Q3'27 close.
Slide 6 shows total platformizations rising from about 1,450 in Q1'26 to about 2,670 in Q1'27, with about 170 record net new platformizations in Q1 (up more than 2.5x y/y). It also reports more than 120% net retention among platformized customers and that two-thirds of NGS ARR comes from them. The detailed definition is in the slide's footnotes.
Slides 7 to 16 lay out an AI security narrative: a spike in critical and high vulnerabilities (7x the 2025 monthly average), AI deployments that mostly remain unsecured, and the move from visibility and enforcement to trust in the model itself. Prisma AIRS is highlighted with about $170M ARR, more than 1,100 customers and up to 3.8T tokens processed daily through AI Gateway in October.
This deck was published on Palo Alto Networks' investor relations site (investors.paloaltonetworks.com). On this page you can view all 34 slides and download the PDF; an editable PPTX may also be offered where available.
Yes. It uses a consistent orange brand palette, KPI cards with large numbers, labeled multi-quarter charts, guidance-versus-actual tables with check marks, bold section dividers and a full appendix of reconciliation tables. Founders and designers can study how it balances financial density with a clear headline on each slide.

Create Your Own Slides
Turn your ideas into professional presentations in seconds with 2slides AI.
Reference professional designs, choose your style, and generate slides with perfect text rendering. Powered by Nano Banana—start creating your presentation now.
Your AI Agent for slides. Save time, shine faster with intelligent presentation creation.


© 2026 2slides. All rights reserved.