
Part of Investor presentation examples · Japanese investor presentation examples
OMRON H1 FY2026 Earnings Presentation: a 31-page Japanese-language investor deck (決算説明資料) from OMRON Corporation covering the first half (April–September 2026) of the fiscal year ending March 2027, dated November 10, 2026. The original was published on TDnet (Tokyo Stock Exchange timely disclosure). FY2026 = fiscal year ending March 2027; H1 = April–September 2026. Figures are in ¥100 million (億円) under IFRS.
Uses this deck’s cover as a style reference for slides made from your own content. Or pick any page below to use its layout as the reference.
Quick Navigation
Tags
Share the slides
OMRON H1 FY2026 Earnings Presentation: a 31-page Japanese-language investor deck (決算説明資料) from OMRON Corporation covering the first half (April–September 2026) of the fiscal year ending March 2027, dated November 10, 2026. The original was published on TDnet (Tokyo Stock Exchange timely disclosure). FY2026 = fiscal year ending March 2027; H1 = April–September 2026. Figures are in ¥100 million (億円) under IFRS.
Detailed view of each slide page, including layout, key content and visual elements.
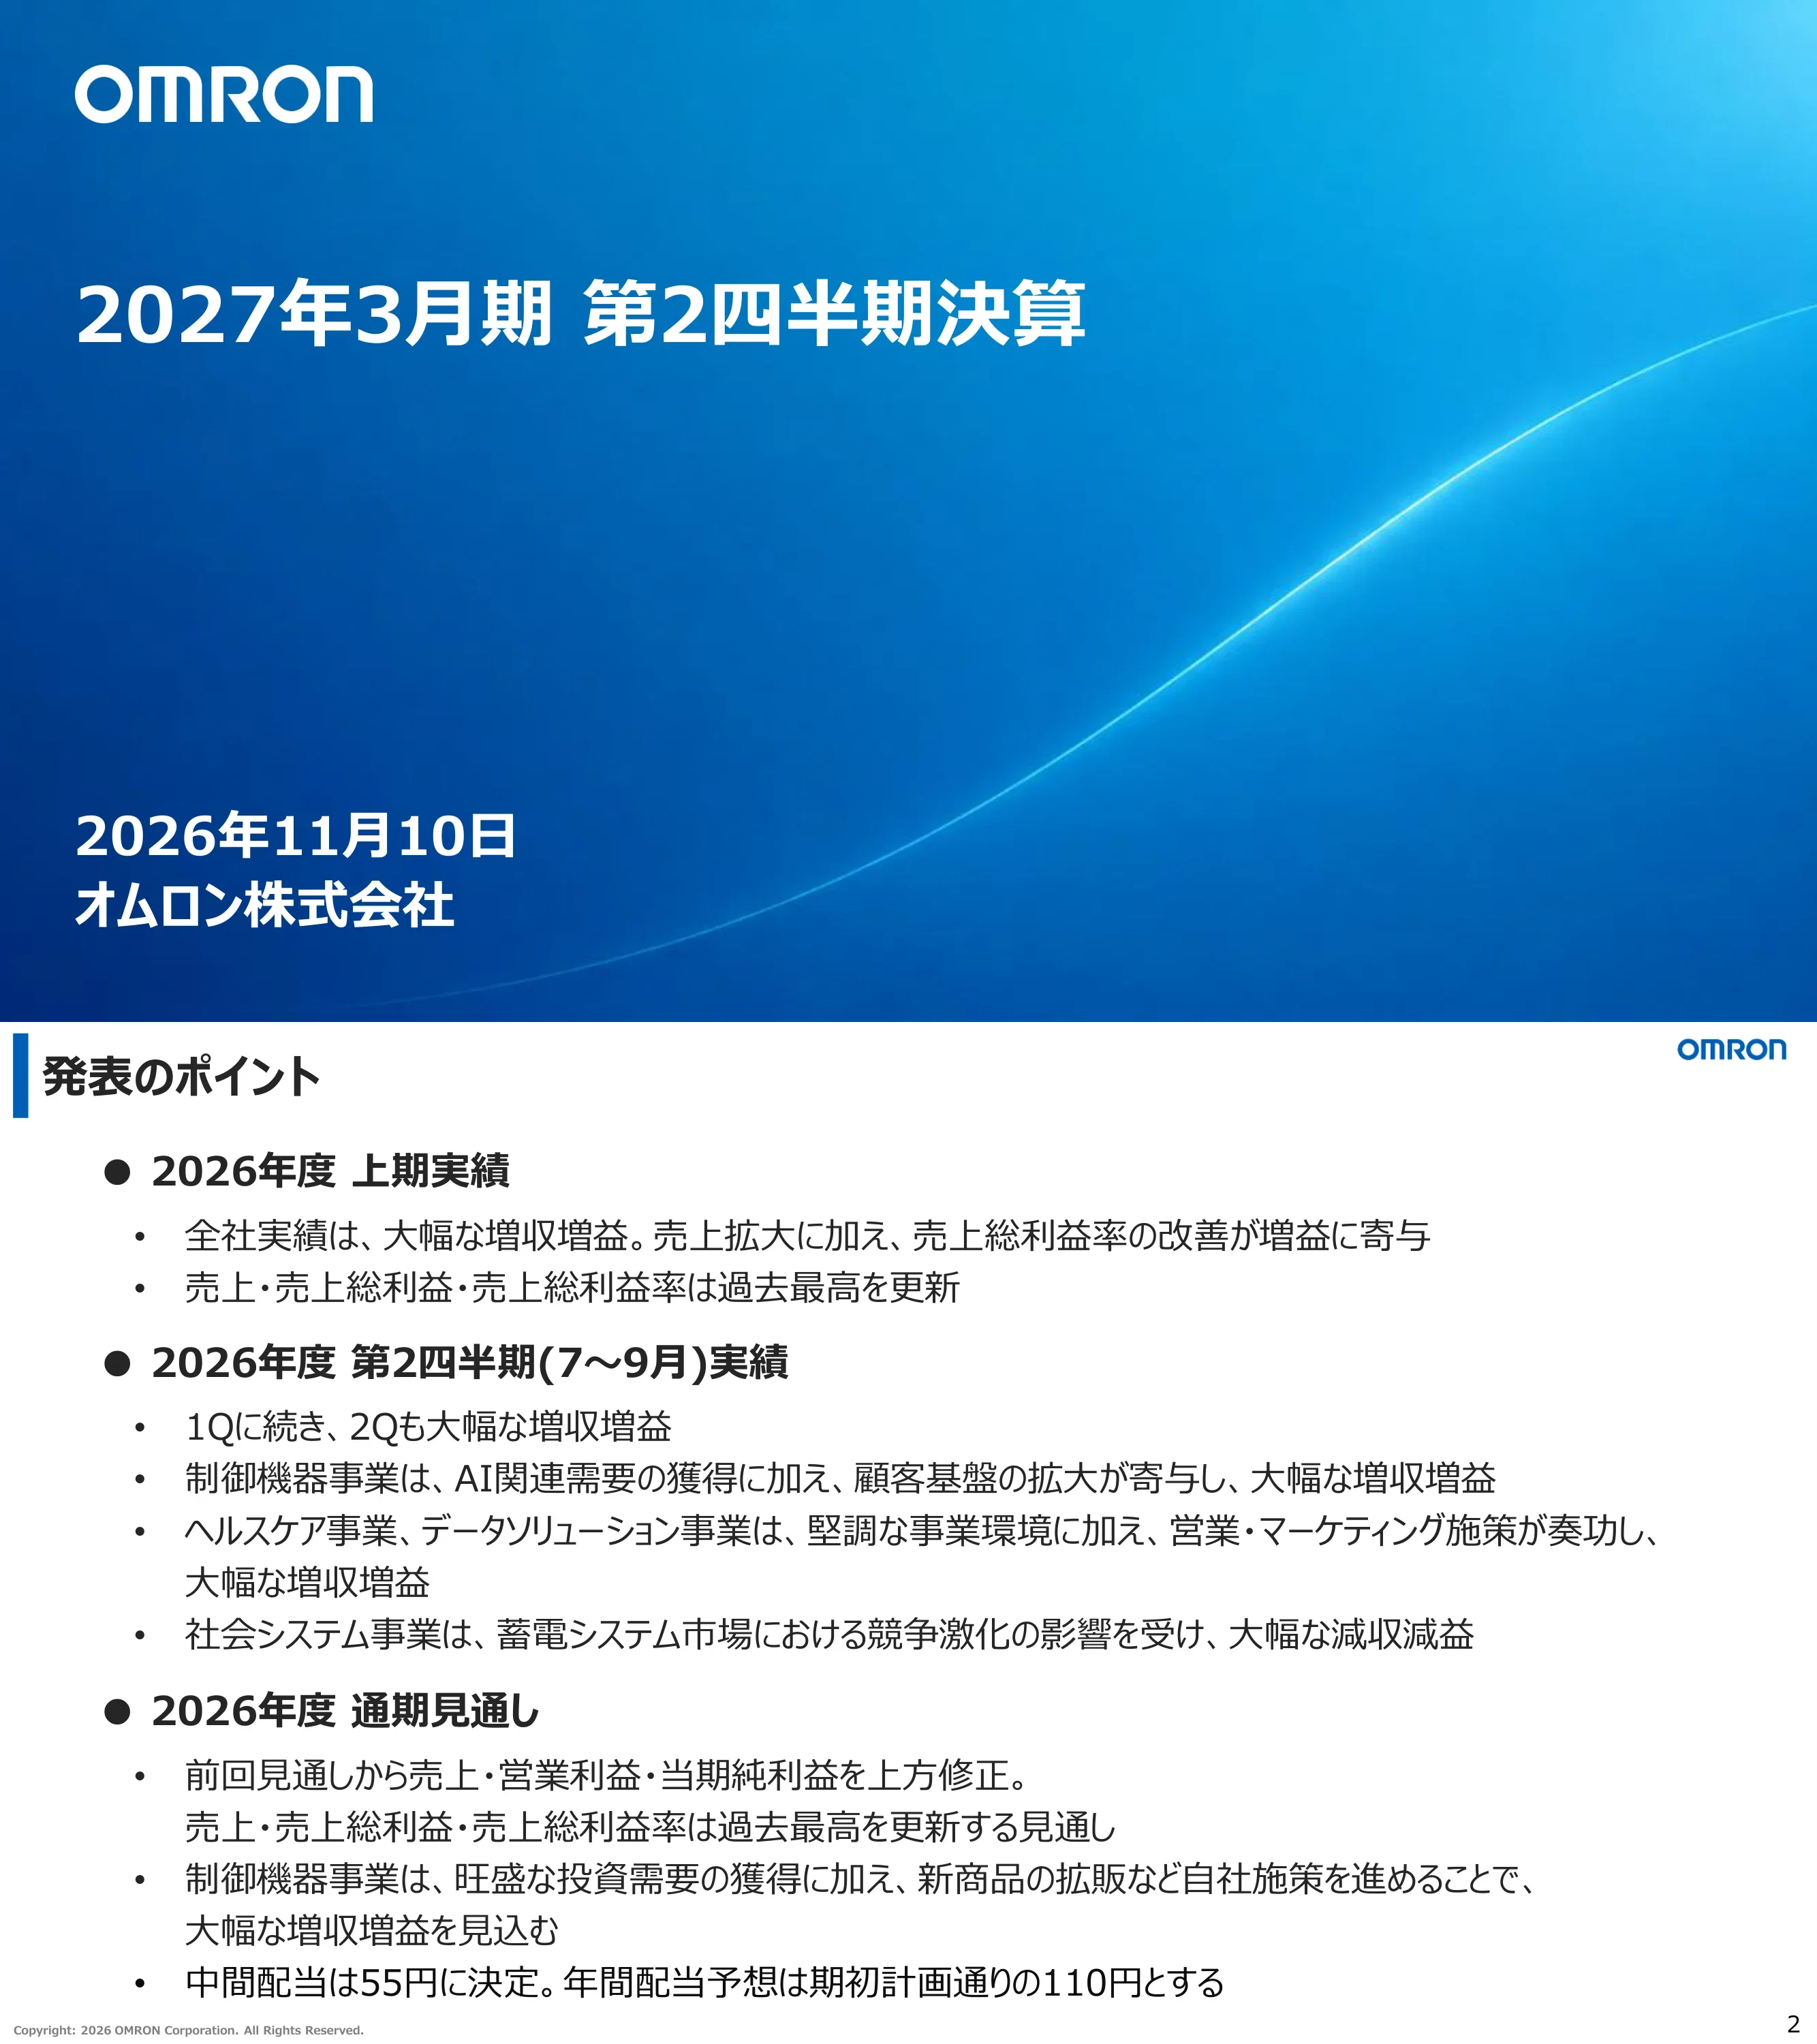
Cover reading 2027年3月期 第2四半期決算 (second-quarter results for the fiscal year ending March 2027), dated November 10, 2026, issued by OMRON Corporation (オムロン株式会社).
Full-bleed blue gradient background with a light swoosh, white OMRON logo top left, large title in the middle left and date plus company name at bottom left.
Summarizes H1 FY2026 (record sales, gross profit and gross margin, large increases in revenue and profit), Q2 (July–September) with strong growth in Control Equipment on AI-related demand, Healthcare and Data Solution up, Social Systems down on tougher energy storage competition, and the full-year outlook raised for sales, operating profit and net profit. Interim dividend set at ¥55 with the annual dividend forecast unchanged at ¥110.
Text-only slide with three bold bullet headings (H1 results, Q2 results, full-year outlook), each followed by indented sub-bullets.
Two sections: 1. FY2026 H1 and Q2 (July–September) results on pages 4–8, and 2. FY2026 full-year outlook on pages 9–18.
Sparse slide with two large numbered agenda lines on the left and page ranges aligned on the right.
Section divider for H1 and Q2 (July–September) results. A footnote states that OMRON has voluntarily adopted IFRS from FY2026 and that FY2025 and FY2026 figures in this deck are prepared under IFRS.
Large section title centered-left with a blue gradient rule beneath it and a two-line footnote at the bottom.
H1 FY2026 net sales were ¥425.3 billion (4,253 x ¥100 million), +22.9% YoY; gross profit 2,030 (47.7% margin, +2.1pt); operating profit 406 (9.5%, +161.5%); net profit from continuing operations 305 (+242.5%); profit attributable to owners 274 (+491.2%). Average rates: ¥160.3 per USD, ¥185.3 per EUR, ¥23.6 per RMB.
Single large table with FY2025 H1, FY2026 H1 (highlighted blue column) and YoY change columns, plus a smaller FX-rate block beneath and a footnote on continuing operations.
Q2 FY2026 net sales were 2,154 (+20.0% YoY); gross profit 1,055 (49.0%, +3.3pt); operating profit 217 (10.1%, +123.1%); continuing-operations net profit 162 (+321.5%); profit attributable to owners 168 versus 0 a year earlier. Average rates: ¥161.0 per USD, ¥185.3 per EUR, ¥23.8 per RMB.
Same table layout as the H1 page: prior-year Q2, current Q2 (blue highlight), YoY change, and an FX block at the bottom.
Q2 sales: IAB 1,290 (+35.2%), HCB 410 (+15.5%), SSB 246 (-24.1%), DSB 154 (+25.9%, of which JMDC 150), total 2,154. Q2 operating profit: IAB 195 (15.1% margin), HCB 64 (15.5%), SSB 7 (3.0%), DSB 12 (7.5%), HQ and other -60, total 217 (10.1%). Footnotes explain the transfer of part of HQ and other into SSB.
Two side-by-side tables, net sales on the left and operating profit on the right, with segment names in dark navy cells and highlighted current-quarter columns; three footnotes below.
Operating profit rose ¥12.0 billion (+120) from 97 to 217. Drivers: FX +30, gross profit from higher sales +111, gross margin improvement +60 (mix +36, pricing +42, value added -24, inventory valuation +3, variable cost -20, fixed manufacturing cost +10, other +12), SG&A and R&D increases -76 and other costs -5. A reference box lists sales changes by business: IAB +253, HCB +22, SSB -78, DSB +34.
Waterfall (bridge) chart running left to right from the prior-year bar to the current bar, with numbered callouts and small breakdown lists under each step, and a reference box lower left.
Section divider titled 2. 2026年度 通期見通し (FY2026 full-year outlook). No figures on this page.
Large heading with a blue gradient underline on an otherwise empty white slide.
Overall conditions are expected to be as previously assumed. Control Equipment stays strong on AI demand, mainly in semiconductors. Healthcare: blood pressure monitor market is solid globally with a gradual recovery in China, nebulizers are weak. Social Systems: residential renewable energy remains competitive while railway investment is solid. Data Solution: JMDC is solid in health big data, with rising competition.
Four horizontal rows, each with a navy label box on the left (business name) and a bold headline plus supporting bullet lines on the right, separated by dotted rules.
Forecast raised to net sales 9,200 (+4.5% vs prior forecast of 8,800; +19.8% YoY), gross profit 4,300 (46.7%), operating profit 880 (9.6%, +10.0% vs prior forecast, +55.9% YoY), continuing net profit 605 and profit attributable to owners 430 (prior 405). ROE about 7.5%, ROIC about 5.5%, EPS ¥307.68. FX assumptions: ¥157.7 per USD, ¥182.7 per EUR, ¥23.3 per RMB.
Wide table with columns for prior forecast, new forecast (highlighted), change versus prior forecast, FY2025 actual and YoY change; KPI rows (ROE, ROIC, EPS) and FX rows below.
Sales and operating profit raised for IAB (5,400, operating profit 720 at 13.3%) and HCB (1,650, operating profit 180 at 10.9%). SSB unchanged at sales 1,480 and operating profit 195; DSB unchanged at 620 and 50 (JMDC 605 and 115). HQ and other loss widens to -265. Total 9,200 and 880.
Two side-by-side tables (net sales and operating profit) with prior forecast, new forecast, change versus prior forecast and YoY columns, segment names in navy cells and three footnotes.
Operating profit forecast rises ¥8.0 billion (+80) from 800 to 880. Steps: FX and other +28, gross profit from higher sales +108, margin improvement +2, SG&A -27, R&D +0, other costs -11 (IAB base strengthening -27, other +16), OnLogic consolidation +0 and one-time M&A costs -20. Sales changes by business: IAB +152, HCB +85, SSB +0, DSB +0.
Waterfall chart from the previous forecast bar to the new forecast bar with numbered callouts, small breakdown lists and a reference box.
Semiconductor and AXI (X-ray board inspection): capital investment keeps expanding on AI demand, with China helped by localization investment, and data-center demand supports AXI. EV and secondary batteries: EV investment is weak while data-center ESS investment in China pauses and Japan and Korea hold steady. Other industries: a gradual recovery is expected excluding Europe.
Two-column table with an industry icon and name on the left and bullet-point assessments on the right, three rows separated by dotted lines.
Order level index (FY22 4Q = 1.00, constant FX) rose from about 1.00 in FY25 2Q to 1.20, 1.41 and 1.67 (FY26 1Q), and 1.42 in FY26 2Q. Excluding pull-forward effects the dotted line shows 1.53 in 1Q and 1.56 in 2Q. Drivers: AI-related capex orders (advanced semiconductors, data-center batteries, board inspection) and an expanding customer base.
Line chart on the left with labelled data points and a dotted adjusted series; right panel with two numbered points and sub-bullets.
H1 sales growth YoY: focus industries (about 20% of sales) semiconductors +63% and secondary batteries +63%; other industries (about 80% of sales) +12%; AXI +185% on AI server and PCB X-ray inspection needs; new products +168% (37 models cumulative since FY24).
Left two-thirds shows two donut charts (20% and 80% sales mix) with large growth percentages beneath; right column lists product KPIs separated by a dashed vertical divider.
IAB operating margin falls from 15.3% in H1 (sales 2,663, operating profit 408) to 11.4% in H2 (sales 2,737, operating profit 312). The decline is mainly due to about 3 points of one-time costs (business base strengthening, M&A-related); other changes about -1 point; improvement effect +0.1 point from pricing offsetting parts-price increases.
Margin bridge between an H1 bar and an H2 bar with sales and operating profit columns, floating blocks for improvement, one-time costs and other effects, and a footnote on reorganization.
The interim dividend is decided at ¥55 per share and the annual dividend forecast stays at ¥110, as planned at the start of the year.
Two large centered figures side by side (interim decided, annual forecast), each with a heading and navy underline.
Divider page titled CEOメッセージ (CEO message). No content or figures on this page; the following page is not a message but a control equipment slide.
Large heading with a blue gradient underline on a white slide.
IAB sales and operating profit: FY23 3,936 and 215 (5.5%), FY24 3,647 and 363 (9.9%), FY25 4,185 and 397 (9.5%, 10.3% excluding one-time costs), FY26 forecast 5,400 and 720 (13.3%, 15% or more excluding one-time costs). One-time costs cover business-base strengthening and the OnLogic acquisition. FY23 and FY24 are US-GAAP.
Combined chart over four fiscal years with light-blue sales bars, blue operating profit bars and two margin lines (reported grey, adjusted dashed blue), with footnotes at the bottom.
Closing slide showing only the large blue OMRON logo, page number 21. No other content.
Centered logo on a plain white background.
Divider page titled 参考資料 (reference materials) that opens the appendix. No figures.
Large heading with a blue gradient underline on a white slide.
From FY2026 Q3, the results of OMI (P.T. OMRON Manufacturing of Indonesia), previously in HQ and other, move into IAB. H1 and Q2 results (pages 4–8) keep OMI in HQ and other, while the full-year forecast (pages 9–18) restates H1 retroactively with OMI in IAB.
Left panel shows a From and To diagram of the move; right panel shows box diagrams for H1 results versus full-year forecast; a highlighted banner at the bottom points to the next page.
After the reorganization, IAB sales are H1 2,663, H2 forecast 2,737 and full year 5,400 (operating profit 408, 312, 720); HCB 774, 876, 1,650 (88, 92, 180); SSB 493, 987, 1,480 (8, 187, 195); DSB 285, 335, 620 (14, 36, 50). Totals are sales 4,253, 4,947 and 9,200 and operating profit 406, 474 and 880. FY2025 comparisons and YoY changes are shown. Small text is dense but legible.
Two wide tables (sales and operating profit), each with FY2025 H1, H2, full-year columns, FY2026 H1 actual, H2 forecast, full-year forecast and YoY columns; dashed boxes mark the H1 columns, with four footnotes.
H1 sales: IAB 2,602 (+36.2%), HCB 774 (+16.0%), SSB 493 (-14.4%), DSB 285 (+24.5%, JMDC 276), HQ and other 98, total 4,253 (+22.9%). H1 operating profit: IAB 407 (15.6%), HCB 88 (11.3%), SSB 8 (1.6%), DSB 14 (4.9%), HQ and other -111, total 406 (9.5%).
Paired sales and operating profit tables with FY2025 H1, FY2026 H1 (highlighted) and YoY columns, navy segment cells and three footnotes.
Operating profit forecast rises ¥31.6 billion (+316) from FY2025's 564 to 880. Steps: FX and other +65, gross profit from higher sales +523, margin improvement +52, SG&A -188, R&D -86, other costs -31, OnLogic consolidation +0 and M&A one-time costs -20. Sales changes by business: IAB +933, HCB +133, SSB +39, DSB +108.
Waterfall chart from the FY2025 bar to the FY2026 forecast bar with numbered callouts, itemized sub-lists and a reference box for sales by business.
Total assets were 13,768 at end of September 2026 versus 13,634 at end of March 2026 (+134). Current assets 6,903, including cash 1,717 and inventories 1,722. Liabilities 5,078, net assets 8,690, and equity ratio 60.8% (+0.5pt).
One summary table with columns for March 2026, September 2026 (highlighted) and the change versus prior year-end; subtotal rows separated by solid rules and the equity ratio set apart at the bottom.
H1 FY2026 operating cash flow was 946 (+590 YoY), investing cash flow -432, free cash flow 515 (+433), financing cash flow -242 and ending cash 1,712. Capital expenditure was 224 and depreciation 235.
Table with FY2025 H1, FY2026 H1 (highlighted) and difference columns; a separate lower block for capex and depreciation.
Full-year impact of a ¥1 move (¥0.1 for RMB): USD about ¥1.1 billion on sales and about 0 on operating profit; EUR about ¥0.6 billion and ¥0.3 billion; RMB about ¥0.6 billion and ¥0.1 billion. H2 FX assumptions: ¥155.0 per USD, ¥180.0 per EUR, ¥23.0 per RMB.
Grid with currencies as blue row headers, sensitivity columns for sales and operating profit, and a separate assumptions column on the right; one footnote below.
ROIC = (after-tax operating profit + equity-method investment gains and losses) divided by invested capital. Invested capital = borrowings + shareholders' equity + non-controlling interests, averaged from the prior year-end and each quarter's actual or forecast.
Centered fraction-style formula with a footnote line defining invested capital and a smaller explanatory note below.
Notes: from FY2026 OMRON voluntarily applies IFRS instead of US-GAAP, so FY2025 and FY2026 consolidated results are IFRS; forecasts rely on currently available information and may differ from actual results. A box lists the IR department (Global Strategy HQ IR) contact, an email address and the Japanese website www.omron.com/jp/ja/.
Numbered cautionary notes in the upper area and a bordered contact box centered at the bottom.
Common questions about this slide and the underlying presentation content.
It covers the first half (H1, April–September 2026) and the second quarter (July–September 2026) of OMRON's FY2026, which is the fiscal year ending March 2027. The deck is dated November 10, 2026 and also gives the full-year forecast.
Yes. It is a Japanese-language deck (決算説明資料) whose original was published on TDnet, the Tokyo Stock Exchange's timely disclosure system. This gallery page describes every page in English.
H1 FY2026 net sales were ¥425.3 billion (+22.9% YoY) and operating profit ¥40.6 billion (+161.5%). The full-year forecast was raised to net sales ¥920.0 billion and operating profit ¥88.0 billion, and the interim dividend is ¥55 with an annual forecast of ¥110.
Industrial Automation (control equipment, IAB), Healthcare (HCB), Social Systems (SSB) and Data Solution (DSB, including JMDC). Segment tables, outlooks and an operating profit bridge are included, plus an appendix explaining the move of OMI from HQ and other into IAB.
OMRON voluntarily adopted IFRS from FY2026, so FY2025 and FY2026 figures are IFRS. Amounts are in ¥100 million (億円) unless stated; FY2023 and FY2024 control equipment figures on one page are US-GAAP.
Yes. The appendix has a consolidated balance sheet (equity ratio 60.8% at end of September 2026), a cash flow statement (H1 operating cash flow ¥94.6 billion), FX sensitivity and the ROIC formula.
The 2slides gallery page offers the deck for download in the formats it provides, typically PPTX and PDF. The original company document remains available from OMRON's investor relations site and TDnet.
Download the deck and replace the text and numbers. Useful patterns include the summary page, comparison tables with a highlighted current-period column, waterfall profit bridges, an order-level line chart and appendix tables. Keep the blue title bar and navy segment labels for a similar look.

Create Your Own Slides
Turn your ideas into professional presentations in seconds with 2slides AI.
Reference professional designs, choose your style, and generate slides with perfect text rendering. Powered by Nano Banana—start creating your presentation now.
Your AI Agent for slides. Save time, shine faster with intelligent presentation creation.


© 2026 2slides. All rights reserved.