
Part of Investor presentation examples · Japanese investor presentation examples
Nichirei H1 FY2026 Earnings Presentation: a 30-page Japanese-language Q2 results briefing (決算説明会資料) from Nichirei Corporation, dated November 10, 2026. The original was published on TDnet (Tokyo Stock Exchange timely disclosure) under the title 2026年12月期 第2四半期決算説明会資料. Nichirei has moved its fiscal year-end from March to December, so FY2026 is a transitional period: Japanese operations are consolidated for 9 months (April–December 2026) while overseas operations are consolidated for 12 months (January–December 2026). The Q2 cumulative results cover Japan April–September 2026 and overseas January–September 2026. The deck reports Q2 consolidated sales of ¥188.3 billion (1,883 in ¥100 million (億円) units, +5% YoY), Q2 operating profit of ¥10.0 billion (+¥0.8 billion), and a full-year plan of ¥618.5 billion in sales, ¥30.0 billion operating profit and ¥21.4 billion net profit (raised by ¥1.0 billion), plus a plan to sell part of non-core assets (¥30 billion or more) and a new-president management agenda built around the N-FIT2035 growth strategy.
Uses this deck’s cover as a style reference for slides made from your own content. Or pick any page below to use its layout as the reference.
Quick Navigation
Tags
Share the slides
Nichirei H1 FY2026 Earnings Presentation: a 30-page Japanese-language Q2 results briefing (決算説明会資料) from Nichirei Corporation, dated November 10, 2026. The original was published on TDnet (Tokyo Stock Exchange timely disclosure) under the title 2026年12月期 第2四半期決算説明会資料. Nichirei has moved its fiscal year-end from March to December, so FY2026 is a transitional period: Japanese operations are consolidated for 9 months (April–December 2026) while overseas operations are consolidated for 12 months (January–December 2026). The Q2 cumulative results cover Japan April–September 2026 and overseas January–September 2026. The deck reports Q2 consolidated sales of ¥188.3 billion (1,883 in ¥100 million (億円) units, +5% YoY), Q2 operating profit of ¥10.0 billion (+¥0.8 billion), and a full-year plan of ¥618.5 billion in sales, ¥30.0 billion operating profit and ¥21.4 billion net profit (raised by ¥1.0 billion), plus a plan to sell part of non-core assets (¥30 billion or more) and a new-president management agenda built around the N-FIT2035 growth strategy.
Detailed view of each slide page, including layout, key content and visual elements.
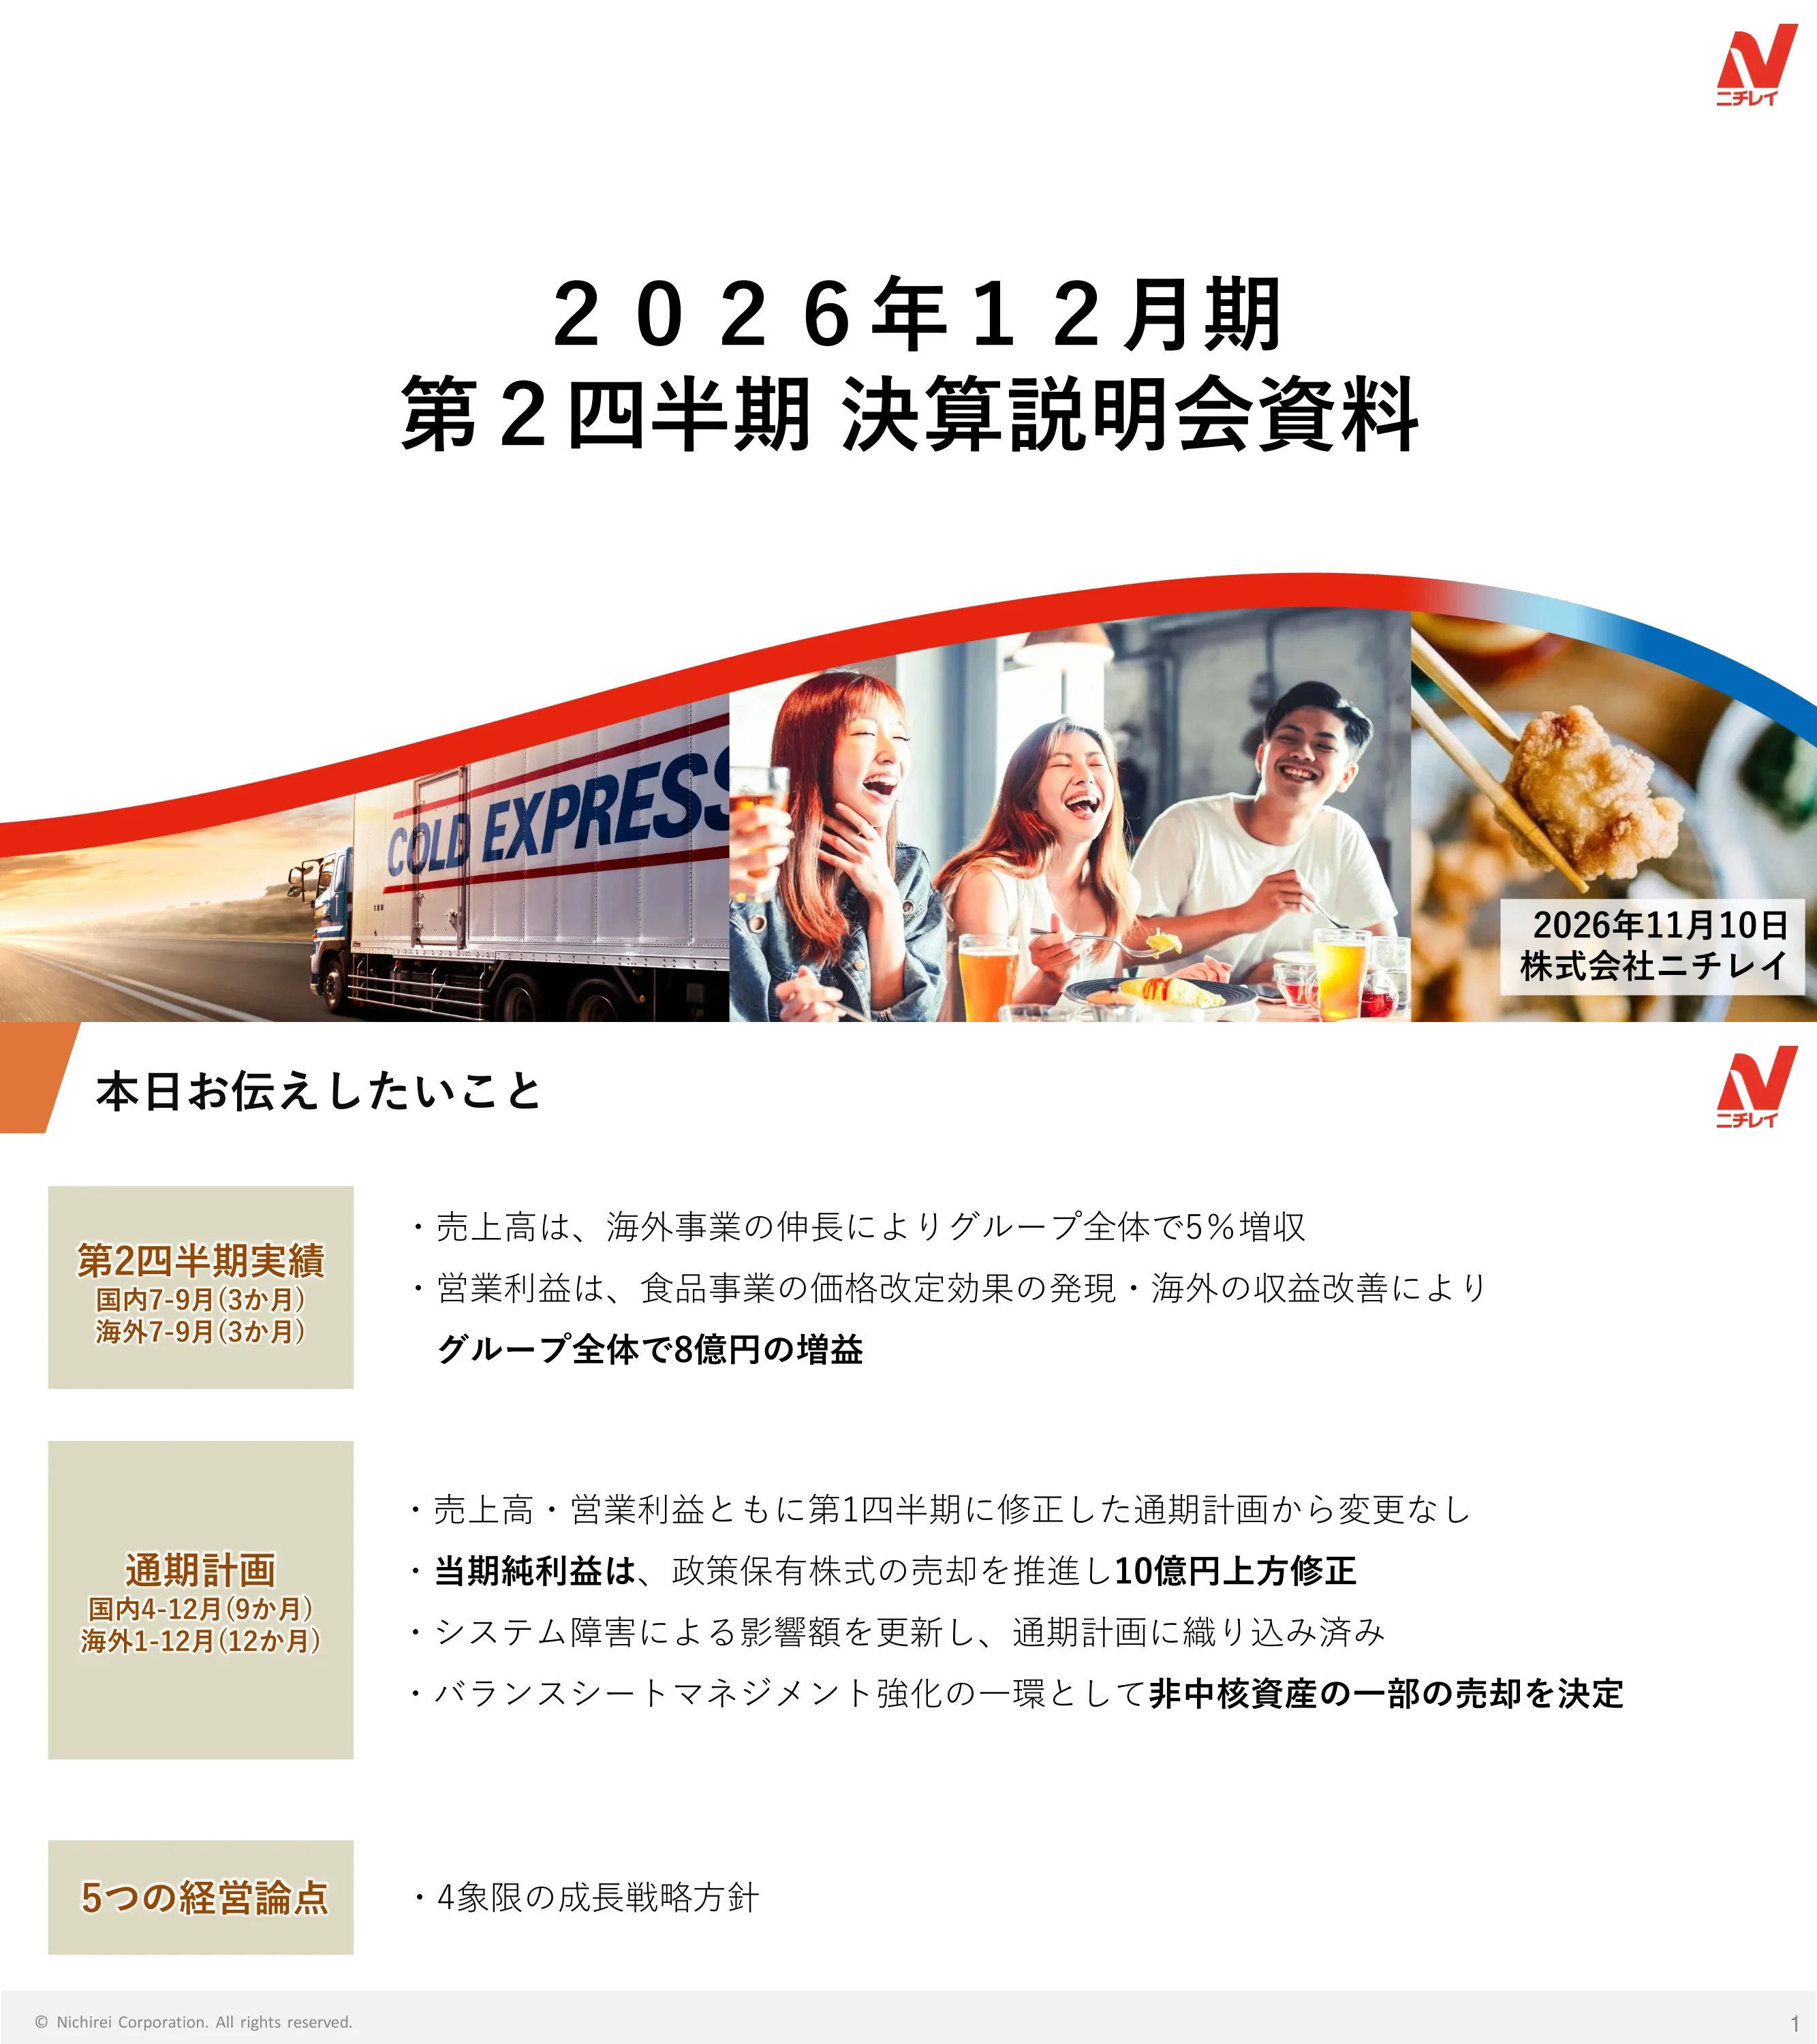
Title slide reading 2026年12月期 第2四半期 決算説明会資料 (FY December 2026, Q2 earnings presentation), dated November 10, 2026, issued by Nichirei Corporation.
Centred two-line Japanese title on a white field, Nichirei logo top right, a wavy red-to-blue ribbon along the bottom with a photo strip, and the date and company name in a small box at bottom right.
Three blocks: Q2 results (domestic July–September, overseas July–September; sales up 5% on overseas growth, operating profit up ¥0.8 billion group-wide on food price revisions and overseas improvement); full-year plan (sales and operating profit unchanged from the plan revised at Q1, net profit revised up by ¥1.0 billion through sales of cross-held shares, system outage impact reflected, decision to sell part of non-core assets); and the five management issues (four-pillar growth strategy policy).
Three left-hand label boxes in beige with period notes, each paired with bullet statements on the right; key phrases in bold.
Four sections: 1) FY2026 Q2 results (pp. 3–6), 2) FY2026 full-year plan (pp. 7–15), 3) five management issues (pp. 16–18), 4) Appendix (pp. 19–28). A note says figures in tables are rounded to the displayed unit, with some rounding up or down to adjust totals.
Four large numbered lines stacked vertically with page ranges; a small note at the bottom.
Section divider titled 1. 2026年12月期 第2四半期実績 (FY December 2026 Q2 results). No data on the page.
Left-aligned title in the middle of a white and pale-blue split background, with a red-to-blue wave line at the bottom and the logo at top right.
Q2 sales were ¥188.3 billion (1,883 in ¥100 million units, +88, +5%) with overseas sales of ¥53.8 billion (+21%); operating profit was ¥10.0 billion (+¥0.8 billion, +8%, margin 5.3%) and net profit attributable to owners was ¥6.6 billion (-¥1.7 billion, -20%). Cumulative sales were ¥417.4 billion (+7%) and cumulative operating profit ¥18.2 billion (-¥2.2 billion, -11%). Commentary credits food price revision effects, notes restructuring costs in adjustments and a ¥1.7 billion net profit decline from the system outage.
Wide results table on the left (Q2 and Q2 cumulative, with YoY change, rate and operating margin by Food, Low-Temperature Logistics, Real Estate, Other and Adjustments), commentary on sales, operating profit and net profit on the right, and a small exchange-rate table below it.
Food Q2 sales were ¥107.4 billion (+4%) and operating profit ¥5.1 billion (+¥1.3 billion, +35%, margin 4.7%); cumulative sales ¥232.0 billion (+3%) and operating profit ¥8.9 billion (-12%). Domestic household frozen food was flat and commercial-use frozen food +2%; overseas sales rose 21% on strong North America, and overseas operating profit rose ¥0.9 billion as Thai export conditions eased. A price/volume breakdown table is included.
Results table with domestic/overseas breakdown on the left, domestic and overseas commentary on the right, and two small tables (price/volume breakdown and exchange rates) at the bottom.
Low-Temperature Logistics Q2 sales were ¥85.7 billion (+8%) and operating profit ¥5.2 billion (flat, margin 6.1%); cumulative sales ¥193.5 billion (+13%) and operating profit ¥10.4 billion. Domestic sales +4% (storage, retail, 3PL), domestic operating profit down ¥0.2 billion from the system outage and higher power costs; overseas sales +29% on European customs-brokerage and transport growth and a weaker yen, with overseas operating profit up ¥0.1 billion.
Results table (domestic, storage, transport, retail, 3PL, overseas, other) on the left with commentary at right and a small exchange rate table at lower left.
Section divider titled 2. 2026年12月期 通期計画 (FY December 2026 full-year plan). No data on the page.
Left-aligned title on a white and pale-blue split background with red and blue wave line at the bottom.
Full-year plan: sales ¥618.5 billion (+¥36.0 billion, +6%), operating profit ¥30.0 billion (-¥2.4 billion, -8%, margin 4.9%), ordinary profit ¥30.9 billion, net profit attributable to owners ¥21.4 billion (-7%, raised ¥1.0 billion from the prior plan of ¥20.4 billion), EPS ¥85.4, EBITDA ¥50.9 billion, ROIC 5.3% and ROE 7.4%. Overseas sales are planned at ¥204.9 billion (+19%). A table of system outage impact (group sales -¥4.0 billion, operating profit -¥0.9 billion, extraordinary loss -¥1.6 billion) and assumed exchange rates (USD 159.00, EUR 184.00, THB 4.70) is shown.
Large forecast table on the left with YoY and change-versus-prior-plan columns, two tables at the right (assumed exchange rates; system outage negative impact by segment) and a two-bullet headline at the top.
Food plan: sales ¥350.1 billion (+3%) and operating profit ¥14.5 billion (-9%, margin 4.1%), unchanged from the prior plan. Domestic sales ¥272.4 billion (+2%) with household frozen food -1% and commercial-use frozen food +4%; overseas sales ¥129.2 billion (+14%). Domestic operating profit is down 7% on volume decline after price revisions, and overseas operating profit down 11% as the Thai earnings decline outweighs North American gains.
Forecast table with YoY and prior-plan columns on the left, domestic and overseas commentary on the right, price/volume and exchange rate tables underneath.
Bridge from prior-year operating profit of ¥16.0 billion to ¥14.5 billion, by quarter (Q1 actual 3.8, Q2 actual 5.1, Q3 forecast 5.6 in ¥ billion). Price revision effect +¥10.3 billion, volume effect +¥0.3 billion (-¥1.7 billion versus plan), raw material and procurement cost -¥4.1 billion excluding FX, FX-driven cost increase -¥0.7 billion, Middle East situation -¥3.5 billion, overhead increase -¥2.6 billion and system outage -¥0.3 billion.
Quarterly bridge table on the left with positive and negative factor rows and a total column, and a red 'main content' panel on the right explaining each key factor.
Domestic: volume declines after price revisions are being countered with measures including TV-commercial-linked in-store promotion in October–November (expected +20–30% store unit sales), spec changes to raise turnover (one example showed -5% unit price and +15% volume) and a push on 91 new and renewed autumn products. Thailand: by-product value-adding is expected to grow +20% in volume share in the 2026 plan and by-product market conditions are improving, with the USD/THB rate also favourable.
Left half covers domestic issues (volume data table, focus items for Q3 and beyond, price-tier product policy); right half covers Thailand with a callout figure (+20%) and a line chart of unit selling price by month for 2025 versus 2026.
Plan: sales ¥279.0 billion (+12%) and operating profit ¥16.6 billion (+4%, margin 5.9%), both unchanged from the prior plan. Domestic sales ¥159.0 billion (+5%, operating profit ¥14.9 billion, +2%) and overseas sales ¥114.8 billion (+24%, operating profit ¥3.7 billion, +22%). Commentary cites peak-season cargo intake, surcharge collection and a focus on cargo acquisition toward year-end.
Forecast table with breakdown by storage, transport, retail and 3PL on the left, domestic and overseas commentary on the right, and an exchange rate table underneath.
Bridge from prior-year operating profit of ¥16.0 billion to ¥16.6 billion by quarter (51, 52 actual; 66 Q3 forecast in ¥100 million). Profit-increasing factors total ¥2.9 billion (proper fee collection +¥1.2 billion, overseas +¥0.7 billion, domestic volume +¥1.0 billion); decreasing factors total ¥2.3 billion (Middle East situation -¥0.3 billion, system outage -¥0.4 billion, outsourcing costs -¥0.9 billion, energy -¥0.3 billion).
Quarterly bridge table on the left and a blue 'main content' panel with four bullets on the right.
Strategy to accelerate overseas growth through new warehouses and post-M&A ramp-up. Europe (Poland): Q2 average occupancy 83% rising to 93% in the Q3 forecast; ASEAN (Malaysia): 49% to 63%; Indonesia on plan. Mid-to-long term aims are stable volume and integrated regional operation. A bar chart shows overseas operating profit trend (FY3/23 to FY12/27P, rising towards the ¥4 billion range) and a pie chart shows EU chicken imports for January–June 2026 (Brazil largest) with Brazilian chicken import resumption expected.
Left area split into short-term and mid-long-term arrow banners with Europe and ASEAN rows and small occupancy charts; right column holds the bar chart and the pie chart; a network diagram shows Thailand, Vietnam, Malaysia and Indonesia functions.
Nichirei is strengthening balance sheet management and has decided to sell part of its non-core assets (fixed assets) to improve capital efficiency. Sale size is expected to be ¥30 billion or more (300億円以上); buyers, amounts and timing are undecided; sales will proceed from fiscal 2027 onward and details and earnings impact will be disclosed once finalised.
Two bullet headlines above a two-row bordered table with labels (target assets, overview) on the left and check-marked statements on the right.
Section divider titled 3. 5つの経営論点 (five management issues). No data on the page.
Left-aligned title on a white and pale-blue split background with a wave line at the bottom.
Re-run of the March 2026 year-end briefing: the new president aims to maximise shareholder value by addressing five issues: 1) redefine the top management target (the top KPI for N-FIT2035), 2) build a business portfolio strategy, 3) identify growth drivers, 4) change the way of competing, 5) core strengths and value to polish. Issues 2 to 4 are reported today. A timeline shows May (FY25 results, issues presented), August (Q1), November (Q2, today) and February 2027 (FY26 results, answers to the issues).
Numbered issue table with a red frame around issues 2–4 and a 'today's report' tag, and a horizontal timeline with milestone boxes beneath.
Matrix by the four pillars: domestic food (strengthen earnings base through product development and brand strength, concentration on categories and withdrawal from low-growth, low-profit categories), overseas food (strengthen North America via a vertically integrated model and adjacent categories and channels), domestic logistics (strengthen and expand the platform, value-added services, frozen-food platform and SCM) and overseas logistics (Europe group-wide operation and cross-selling; ASEAN business base). A right column lists open issues up to the year-end results.
Three-column layout: portfolio labels with coloured pill tags on the left, competitive-position explanation in the middle (key phrases coloured), and remaining issues in the right column.
Section divider titled 4. Appendix. No data on the page.
Left-aligned title on a white and pale-blue split background with a wave line at the bottom.
Total assets rose from ¥557.2 billion (March 2026) to ¥590.6 billion (+¥33.4 billion); liabilities rose ¥30.9 billion to ¥283.7 billion; net assets ¥307.0 billion (+¥2.5 billion). Interest-bearing debt rose ¥30.4 billion to ¥155.2 billion. Main drivers: cash +¥12.1 billion, intangibles +¥7.9 billion (goodwill ¥6.3 billion), short-term borrowings +¥24.4 billion, long-term borrowings +¥6.8 billion. Capex for Q2 cumulative was ¥21.2 billion, including a ¥3.5 billion Lekkham cold store expansion in the UK; depreciation was ¥14.1 billion.
Balance sheet table and capex table stacked on the left with numbered markers, factor list and an aerial photo of the warehouse on the right.
Overseas food sales, after inter-regional eliminations, were ¥22.3 billion in Q2 (+11%) and ¥63.9 billion cumulative (+8%); the full-year plan is ¥86.4 billion (+8%), with North America ¥46.0 billion (+9%). The Innovation (Innovasian) business shows Q2 sales of ¥10.2 billion (+9%) and operating profit of about ¥0.5 billion, with a full-year plan of ¥39.7 billion in sales and ¥2.1 billion operating profit. Small text in the tables is only partly legible at this resolution.
Two stacked wide tables (overseas sales by North America, GFPT Nichirei, Other; Innovasian sales and operating profit in both yen and USD) with a note box on aggregation periods at the top.
A table of household prepared frozen food purchase amount per 100 people versus the prior year (SCI data): overall market 101% in Q2 FY12/26, with livestock fries 101%, pilaf and rice 92%, rice balls 102%, snacks 101% and hamburgers 97%. Also shows new and renewed autumn 2026 products (stir-fried rice, Torikara, a noodle-and-rice one-plate series, chicken katsu, shrimp and vegetable fritters) and a monthly USD/THB chart for 2024–2026.
Top: market data table with source note; bottom left: product photo gallery with captions and a release link; bottom right: line chart of the baht rate by year.
Overseas sales were ¥31.5 billion in Q2 (+29%) and ¥87.9 billion cumulative (+30%), with a full-year plan of ¥114.8 billion (+24%): Europe ¥100.3 billion (+20%), East Asia ¥5.7 billion and Southeast Asia ¥8.8 billion (+151%). A second table gives European sales in yen and in euros (full-year plan ¥100.3 billion, or EUR 545 million, +10%).
Two stacked blue-header tables (overseas sales by region; Europe by storage and customs/transport, in yen and euros) with a note box on aggregation periods.
Left: industry cold-store operating conditions (12 major cities): cumulative inbound volume of 3,251 / 3,182 / 3,215 / 2,913 / 3,194 thousand tons across FY25 Q1 to FY26 Q1, with occupancy rates in the low 30% range (about 34% in the Tokyo area, about 31% in Kansai). Right: Nichirei's own 12-city stock volume indexed to April 2024 = 100, comparing FY2024, FY2025 and FY2026. A note says Q2 data for the current year is not reflected due to a member company's system outage; the source is the Japan Cold Storage Warehouse Association.
Left: combined bar and line chart with legend; right: multi-line chart with a large curved arrow; source notes at the bottom left.
A large reference table by quarter (Q1 actual, Q2 actual, Q3 plan, full-year plan) with YoY change for every segment line: Q1 sales ¥229.0 billion, Q2 ¥188.3 billion, Q3 plan ¥201.1 billion and full year ¥618.5 billion; operating profit Q1 ¥8.2 billion, Q2 ¥10.0 billion, Q3 plan ¥11.8 billion and full year ¥30.0 billion; net profit Q1 ¥6.9 billion, Q2 ¥6.6 billion, Q3 plan ¥7.9 billion and full year ¥21.4 billion. The page is almost entirely a dense table.
Full-width table with grey header, indented row groups for Food, Low-Temperature Logistics, Real Estate, Other and Adjustments, the Q2 column tinted and a unit note at the right top.
Q2 cumulative period is Japan April–September 2026 and overseas January–September 2026. Total sales ¥417.4 billion (Japan ¥266.8 billion, outside Japan ¥184.3 billion) and operating profit ¥18.2 billion (margin 4.4%, -0.8 pt; Japan 4.7%, outside Japan 3.8%). Food sales ¥232.0 billion with operating profit ¥8.9 billion (3.8%); Low-Temperature Logistics sales ¥193.5 billion with operating profit ¥10.4 billion (5.4%). YoY changes are shown in brackets under each figure.
Wide matrix table with sales columns (Japan, outside Japan split by North America, Europe, Southeast Asia, East Asia, Other, eliminations, total) and operating profit columns including margins; each segment has a main row and a bracketed YoY row.
Reference numbers recast on a 12-month basis for both domestic and overseas operations (Q1A January–March, Q1B April–June, Q2 July–September, Q3 October–December). The full-year reference plan is ¥752.2 billion in sales (+¥42.7 billion, +6%) and ¥36.6 billion in operating profit (+¥0.2 billion, +1%), versus the ¥618.5 billion and ¥30.0 billion on the 9-month domestic basis. Overseas sales are ¥204.9 billion (+18%).
Very dense table with four quarter column groups and a red-highlighted full-year plan column; rows are sales, overseas sales and operating profit by segment.
Group ROIC history from FY3/18 (8.1%) through FY3/26 (7.3%) to 5.3% in the 12/26 estimate, with NOPAT margin (3.7% estimate), invested capital turnover (1.4) and WACC (4.5%). Food simplified ROIC for 12/26E is 5.8%; Low-Temperature Logistics 5.2% (down from 6.7% in FY3/26); former segments (processed foods, marine, livestock) are shown until FY3/26. The footnote says the 26/12E figure is a 9-month domestic plus 12-month overseas basis.
Single large table with ten year columns (the latest one highlighted) and coloured segment header bands for Food, former segments and Low-Temperature Logistics, with footnotes below.
Standard forward-looking statements disclaimer: plans and strategies that are not historical fact are forecasts that may differ materially from actual results. Listed risks include economic and industry conditions, USD and EUR exchange rate movements, quality assurance, new product and service development, growth strategy and low-cost structure, alliance effects and contingent events. The document is to deepen understanding of Nichirei and is not a solicitation to invest.
Full-page justified text paragraph with a numbered list of seven risk factors; header with logo and footer.
Common questions about this slide and the underlying presentation content.
It is a 30-page Q2 results briefing (決算説明会資料) covering consolidated and segment results for Food and Low-Temperature Logistics, the full-year plan, operating profit bridges, a capital policy page on asset sales, the five management issues and N-FIT2035 growth strategy, and an appendix of balance sheet, regional data, reference figures and ROIC.
The title is 2026年12月期 第2四半期. Nichirei has changed its fiscal year-end from March to December, so FY2026 is a transitional irregular period: Japanese operations are consolidated for 9 months (April–December 2026) and overseas operations for 12 months (January–December 2026). The Q2 quarter is July–September 2026 and the Q2 cumulative period is Japan April–September and overseas January–September 2026.
Q2 sales were ¥188.3 billion (+5%), Q2 operating profit ¥10.0 billion (+¥0.8 billion) and Q2 net profit ¥6.6 billion (-¥1.7 billion). The full-year plan is sales ¥618.5 billion, operating profit ¥30.0 billion and net profit ¥21.4 billion, with net profit raised ¥1.0 billion from the prior plan. Amounts are in ¥100 million (億円) units on the slides.
The deck is in Japanese. The original was published on TDnet, the Tokyo Stock Exchange timely disclosure service, as 2026年12月期 第2四半期決算説明会資料. This gallery page provides an English page-by-page analysis of the Japanese original.
Page 16 says Nichirei has decided to sell part of its non-core fixed assets to improve capital efficiency. The expected scale is ¥30 billion or more, the buyers, amounts and timing are undecided, sales will proceed from fiscal 2027 onward, and the earnings impact will be disclosed once finalised.
The slides are available to view on this page. Download options (PDF or PPTX where offered) appear on the gallery page. For the official original, see Nichirei's investor relations materials and the TDnet disclosure.
Yes. The deck uses repeatable layouts: a key-messages page, a results table with right-hand commentary, an operating profit bridge table with explanatory panel, a forecast table with exchange rate assumptions, a strategy matrix and appendix reference tables. Recreate them in PowerPoint with your own figures and branding, keeping Nichirei's company text and logos out of your version.
Yes. Pages 22, 24, 26, 27, 28 and 29 are mostly large data tables, and the small text on pages 26 to 28 is only legible at high zoom. Pages 4, 8, 17 and 20 are section dividers with no data.
Company site; the deck itself references nichirei.co.jp for prior results materials.

Create Your Own Slides
Turn your ideas into professional presentations in seconds with 2slides AI.
Reference professional designs, choose your style, and generate slides with perfect text rendering. Powered by Nano Banana—start creating your presentation now.
Your AI Agent for slides. Save time, shine faster with intelligent presentation creation.


© 2026 2slides. All rights reserved.