
Part of Investor presentation examples · Australian investor presentation examples
National Australia Bank (NAB) FY2026 Full Year Results investor presentation (5 November 2026), lodged with the ASX: 127 slides covering FY26 financial results in Australian dollars (A$), divisional performance, technology and AI transformation, asset quality, capital, funding and liquidity, sustainability and economic outlook.
Uses this deck’s cover as a style reference for slides made from your own content. Or pick any page below to use its layout as the reference.
Quick Navigation
Tags
Share the slides
National Australia Bank (NAB) FY2026 Full Year Results investor presentation (5 November 2026), lodged with the ASX: 127 slides covering FY26 financial results in Australian dollars (A$), divisional performance, technology and AI transformation, asset quality, capital, funding and liquidity, sustainability and economic outlook.
Detailed view of each slide page, including layout, key content and visual elements.
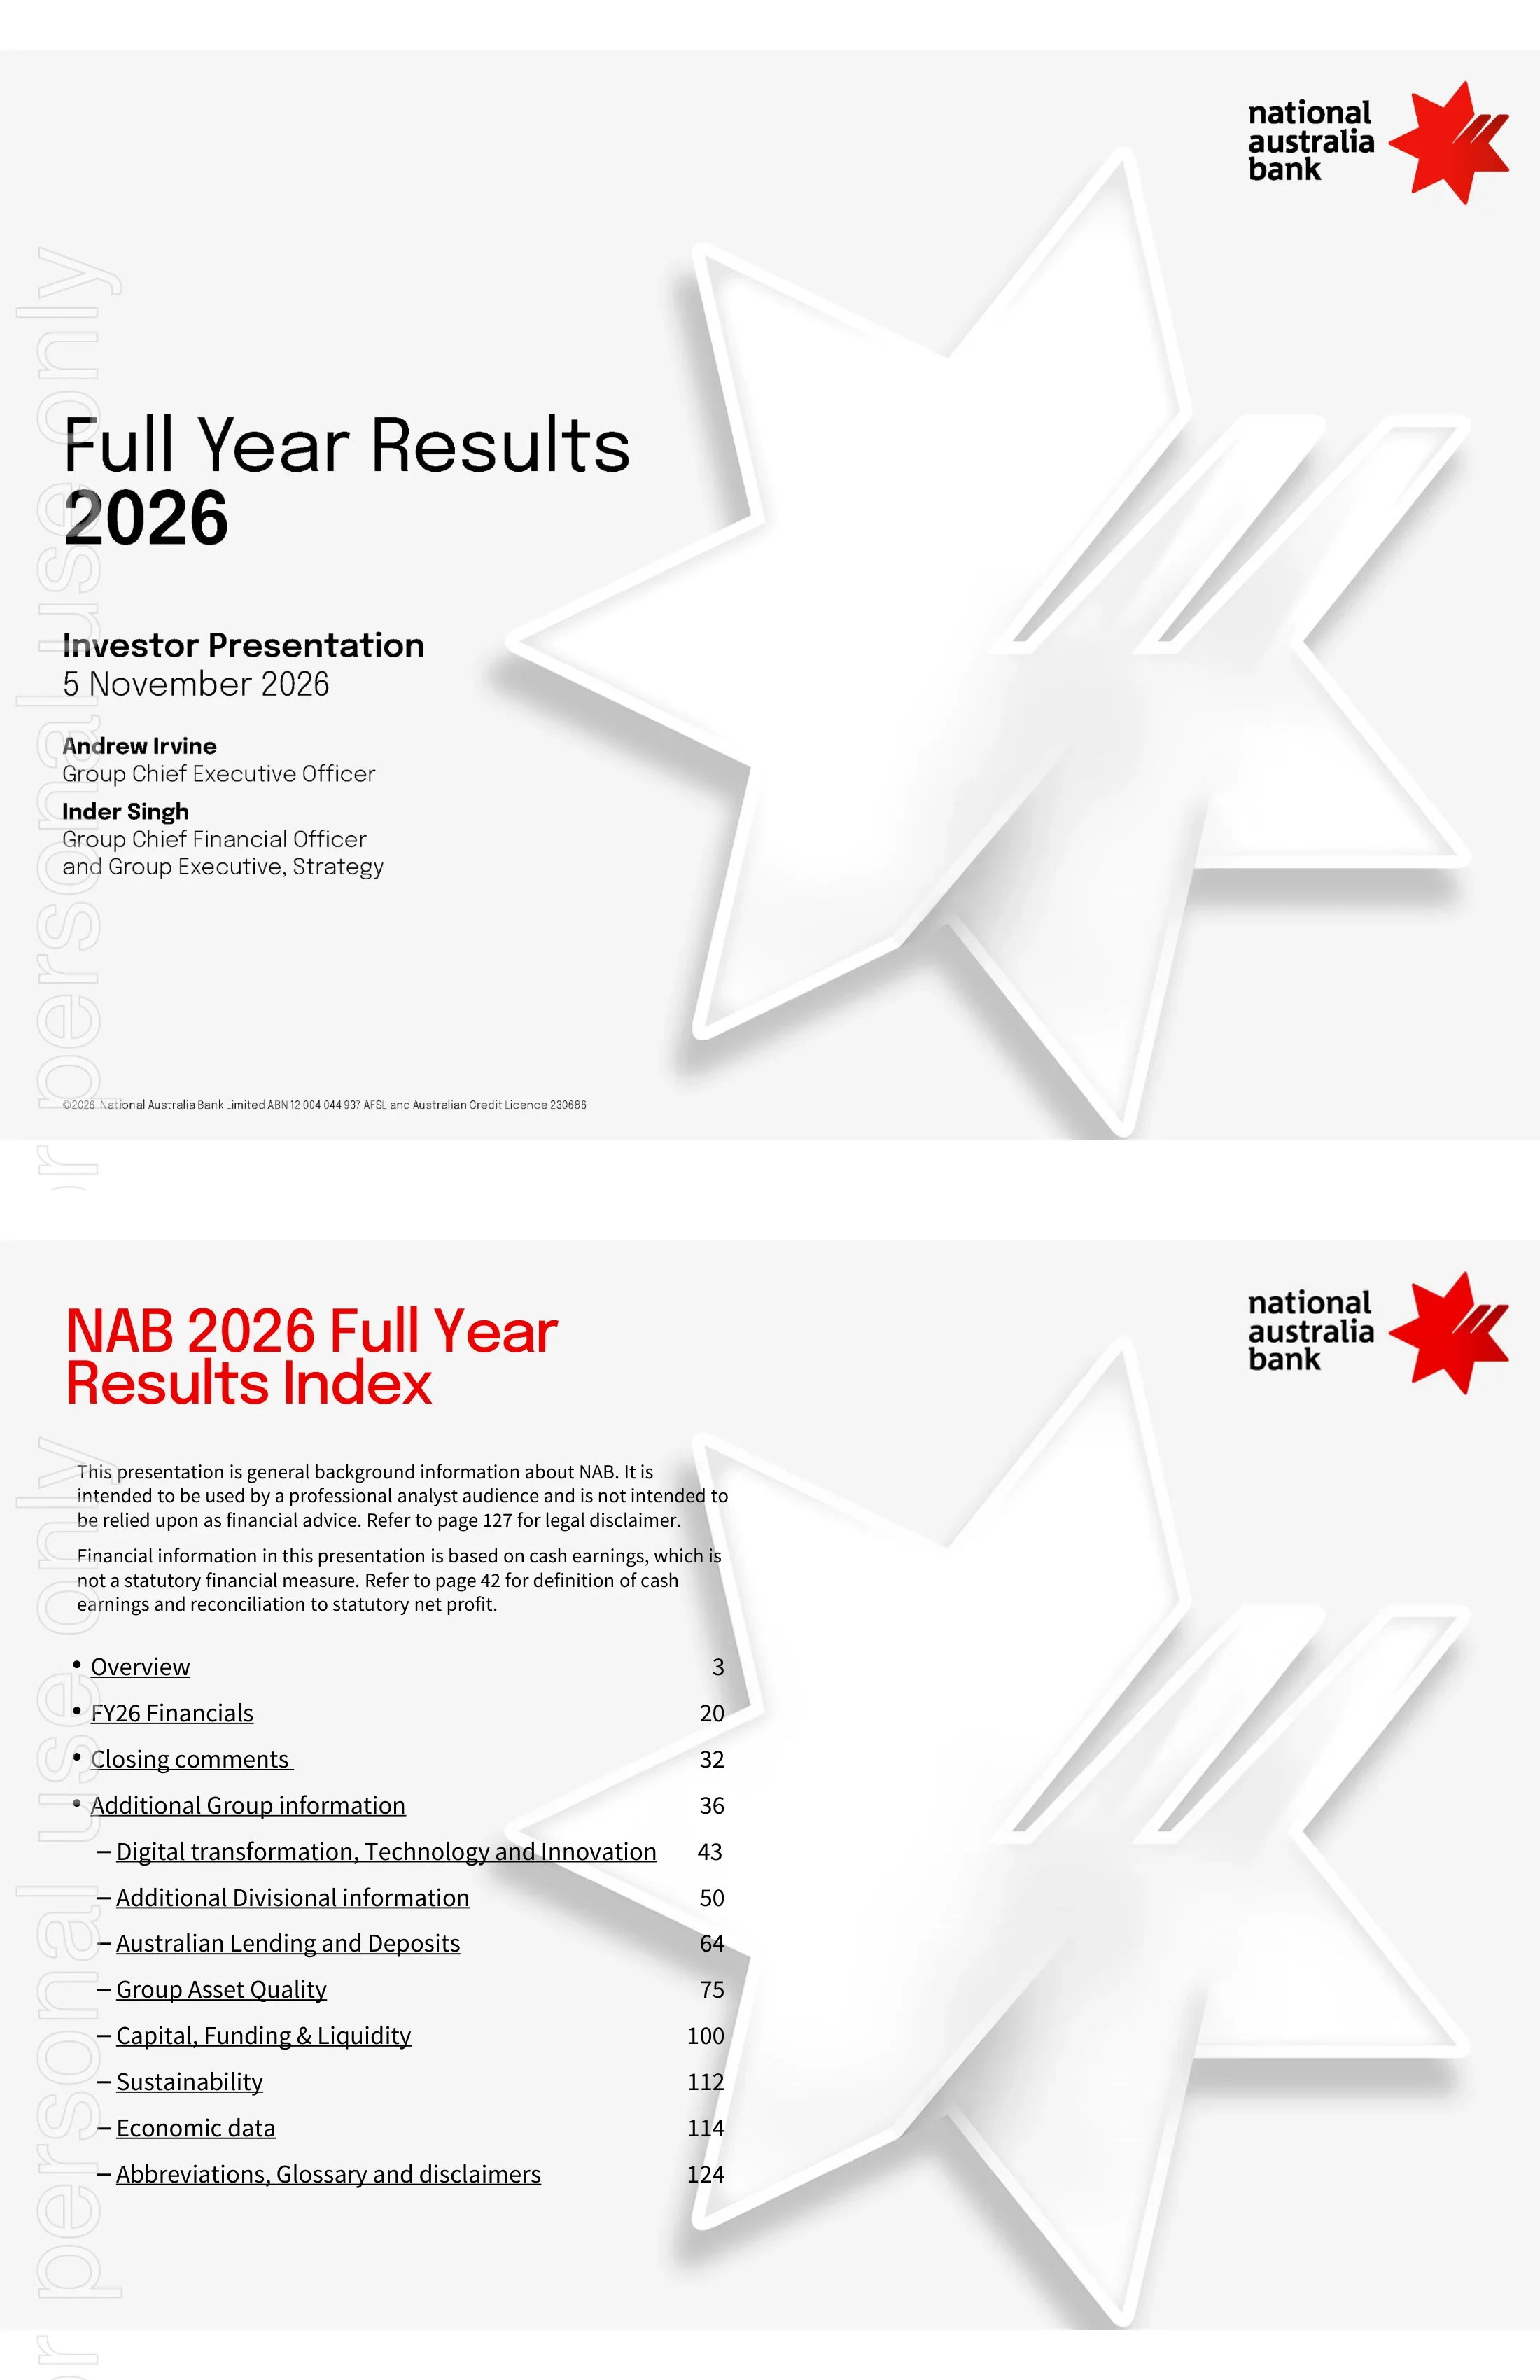
Cover slide for National Australia Bank's Full Year Results 2026 investor presentation dated 5 November 2026, presented by Group CEO Andrew Irvine and Group CFO & Group Executive, Strategy Inder Singh.
Left-aligned title block with presenter names on a light grey background, oversized white NAB star motif filling the right half, NAB logo top right.
Table of contents with page references: Overview (3), FY26 Financials (20), Closing comments (32) and Additional Group information covering technology, divisions, Australian lending and deposits, asset quality, capital and funding, sustainability, economic data and glossary; notes that figures are on a cash earnings basis, a non-statutory measure reconciled on page 42.
Two-column layout: disclaimer paragraph and bulleted index with right-aligned page numbers on the left, star motif on the right.
Section divider introducing the Overview section presented by Group Chief Executive Officer Andrew Irvine.
Section divider with red title and speaker name on the left and a dotted red-and-black star outline on the right.
Five headline messages: strong momentum in FY26 with 5.8% revenue and 6.9% underlying profit growth; supporting customers in an evolving environment; progress on business banking, deposits and proprietary home lending; multi-year ambition to modernise technology to be simple, fast and resilient; and actions to become a stronger, more efficient bank. Underlying profit excludes large notable items of $1,347m before tax ($949m after tax).
Single rounded red-outlined panel containing five icon-led message rows.
Three bar charts comparing FY25 and FY26: underlying profit $10,965m to $11,722m including the $1,347m LNI impact (+6.9% ex LNIs); cash earnings $7,091m to $7,090m ex LNIs (flat; $6,141m reported after $949m LNIs); statutory profit $6,759m to $6,143m (down 9.1%).
Three side-by-side grey-vs-red bar charts with dashed boxes highlighting the large notable item impact and growth annotations above each pair.
Five-year trends FY22-FY26: cash ROE ex LNIs 11.7%, 12.9%, 11.6%, 11.4%, 11.4%; basic cash EPS ex LNIs 221, 247, 229, 232, 231 cents; dividend per share 151, 167, 169, 170, 170 cents; payout ratio 68.4% to 73.7%, guided by a 65-75% range of cash earnings.
Left bar chart for ROE, right column with EPS line chart above dividend line chart and a payout ratio table underneath.
Key economic indicators deteriorated over 12 months to Sep 26: trimmed-mean inflation 2.9% to 3.7%, cash rate 3.6% to 4.85% (+125bps), house prices +4.7% to -6.7%, business confidence +9 to -13 pts, GDP growth slowing to 1.4%, US 10-year yields 4.16% to 5.29%. Offsetting themes: low unemployment, house prices expected to stabilise mid-2027, strong household buffers, 11% increase in offset balances with ~38 months pay-ahead, and a robust business lending pipeline.
Two rounded panels: a left before/after indicator ladder with Sep 25 circles and Sep 26 red/amber pills, and a right checklist of longer-term positives and customer resilience points.
Business customers show signs of emerging stress, prompting earlier risk identification, early-warning tools, SMS repayment alerts and tighter controls; watch loans rose to 1.33% of GLAs at Sep 26 from 1.11% at Mar 26. Retail support includes the NAB Financial Health Campaign, new Community Hubs in Werribee and Cairns and 1.6m NAB Goodies redemptions worth over $11.6m; 30+ DPD home lending arrears were 1.69% at Sep 26.
Two red-outlined panels: business customer bullets with a red watch-loan bar chart on the left, retail initiatives with a phone mockup and an arrears line chart on the right.
Group Level 2 CET1 of 11.87% at Sep 26 (12.07% pro forma including ~20bps from a discounted FY26 final DRP) versus a 10.5% APRA minimum from 1 January 2027; $5.4bn of collective provisions including $2.0bn forward-looking; CP/CRWA increased to 1.40% after a $103m 2H26 top-up; LCR 135% and NSFR 116%.
Four-quadrant layout: bullet commentary, provisioning coverage line chart, CET1 black bar chart with minimum line, and LCR/NSFR bars.
Strategy framework: why (to be the most customer-centric company in Australia and New Zealand), who we are here for (customers and colleagues), who we are (values icons), what we will be known for (relationship-led bankers, exceptional experiences, safe and sustainable), where we will grow (B&PB, C&IB, Personal, BNZ, ubank) and what we will deliver (leading advocacy, winning in market, strong returns).
Stacked horizontal bands, each headed by a red 'Why/Who/What/Where' label followed by icon or text columns.
NAB share of business MFI 18.8% (+210bps vs Sep 25) and consumer MFI 11.7% (+80bps). Strategic NPS rankings versus major peers: #1 Medium & Large Business, #2 Micro & Small Business, #3 Mass Consumer and #4 HNW and Mass Affluent, tracked quarterly Sep 25-Sep 26.
Two header stat boxes above a 2x2 grid of multi-line NPS charts comparing NAB in red with three anonymised peers.
Three strategic priorities with actions: grow business banking (leadership in B&PB, disciplined C&IB growth, seamless experiences), drive deposit growth (transaction accounts, business payments, target segment propositions) and strengthen proprietary home lending (grow the proprietary book, improve returns, simplify processes). Successful execution is expected to improve ROE over time.
Three stacked rows of priority labels and bullet boxes, joined by a large green arrow pointing to an outcome statement.
B&PB serves ~1 in 4 of the SME market and ~1 in 3 of the agri market, with >10 year median tenure, ~70% of sales through proprietary channels and over 1 in 4 Australian private banking customers. Business lending grew from $155bn to $184bn (Sep 24-Sep 26) with NIM at 3.04%; business transaction balances grew 22%; JBWere FUM reached $53.7bn; underlying profit rose to $5,893m in FY26.
Green left-hand credentials column, a top strip of four strategic pillars and a grid of small bar and line charts.
C&IB is the #1 overall Australian corporate and institutional relationship bank, #1 in transactional banking, #1 DCM RSI for 11 years and #1 in interest rate derivatives. Transaction deposits grew 23% to $64bn; ~300bps increase in lending customers with transactional banking; target sectors rose from 60% to 83% of EAD; spot GLAs $135bn; underlying profit $2,734m in FY26.
Green credentials column on the left, icon strip across the top and four charts including bars, donuts and a returns line chart.
Personal Banking ranks #1 in branch customer advocacy for three consecutive quarters, grows at 1x system in household deposits and home lending, and 97% of new home loan customers have an active transaction account. Proprietary home lending balances rose from $164bn to $177bn with proprietary flows of 50% (53% in 2H26); transaction accounts opened in branches up 39%; underlying profit grew to $2,257m.
Green credentials column with a phone mockup, bar charts for Premier customer growth, proprietary lending and profit, and a 39% circular callout.
Against a softening housing market (system growth ~2.6% forecast for FY27 vs ~7% in FY26), increased competition and lower returns, NAB closed the Advantedge book (remaining $19bn migrated to NAB in Oct 2026), raised proprietary lending to 53% of 2H26 drawdowns from 48% in 1H26, is targeting strategic broker relationships and lower-LVR loans, and achieved mortgage NPS of 84 pts (+8 pts). Proprietary home lending grew at 1.1x system in 2H26.
Two panels at top (challenging environment vs deliberate actions), then three bottom tiles: growth bar chart, broker service model callout and app mockup with green NPS badge.
BNZ is the #1 business bank in New Zealand by lending, #1 in consumer NPS and Canstar Bank of the Year for Home Loans and Small Business; 59% of home lending is through proprietary channels. FY26 growth of 5.8% in household deposits (1.4x system), 7.7% in home lending and 5.5% in business lending; underlying profit NZ$2,118m (down 1.3%); customer numbers up 16% over 5 years.
Green credentials column, top pillar strip and three chart tiles for balance sheet growth, GLA mix and underlying profit.
Multi-year business-led transformation to be simple, fast and resilient: ~90% of apps in modern cloud infrastructure, single sales platform, single customer master, 12 of 35 product ledgers in cloud, a single agentic & AI platform and NPP payments migrated to a cloud real-time engine. Products cut by 32% since FY22 (386 to 264), change delivery 18% faster in FY26, ~600 apps decommissioned since FY24.
Green foundations checklist on the left; three grey rows labelled Simple, Fast and Resilient with small charts and a circular delivery icon.
~50 AI squads supported by global partners. Early agentic AI outcomes: 20% faster preparation of business credit memos, 75% less time to identify C&IB customer insights, 50% less lead preparation time for personal bankers, 50% faster design-to-code, 80% faster cyber incident triage and 90% less cyber assessment time. Next wave in build: voice servicing agents, complaints automation, fraud detection and financial crime agents.
Red-outlined main panel split into Growth and Productivity green headers with outcome cards, plus a narrow right panel listing next-wave tools.
Section divider for the FY26 Financials, presented by Inder Singh, Group Chief Financial Officer & Group Executive, Strategy.
Section divider with red title and speaker name on the left and a dotted star outline.
Half-on-half results: underlying profit ex LNIs $5,852m (1H26) to $5,870m (2H26), cash earnings ex LNIs $3,588m to $3,502m (-2.4%), statutory profit $2,750m to $3,393m (+23.4%). FY26 P&L: net operating income $22,014m (+5.8%), ex Markets & Treasury $20,107m (+5.8%), opex ex LNIs $10,292m (+4.5%), credit impairment charge $1,547m (+85.7%).
Three half-year bar charts across the top with a full-width P&L key indicators table below.
Strong momentum in business divisions: B&PB underlying profit $5,299m to $5,893m (+11.2%) and C&IB $2,702m to $2,734m (+1.2%, ex Markets +4.9%). Stable 2H in a challenging environment for Personal Banking ($2,044m to $2,257m, +10.4%; 2H -0.6%) and New Zealand Banking (NZ$2,146m to NZ$2,118m, -1.3%).
Two rounded panels each holding two divisional bar charts with FY and half-year comparisons and growth arrows.
Net operating income rose 2.5% HoH to $11,144m (ex M&T +3.6%), driven by volumes (+$282m) and margin, with fees up on lower remediation and M&T down versus a strong 1H26; NZD translation impact of -$59m. M&T income breakdown shows FY26 $1,907m versus $1,816m in FY25.
Waterfall chart across the top half; stacked M&T bar chart bottom-left and revenue driver bullets bottom-right.
NIM fell 2bps HoH from 1.81% to 1.79% (up 2bps ex M&T to 1.83%): lending margin -2bps, funding costs flat, deposits +6bps, M&T -4bps. 1H27 considerations: ongoing competition, ~3bps replicating portfolio tailwind, and a 9bps move in Bills/OIS equals ~1bp of NIM. Replicating portfolio rate rose to 3.72%.
NIM waterfall chart across the top with annotation boxes; bottom-left considerations bullets and bottom-right replicating portfolio bar/line chart.
Opex ex LNIs rose 4.5% YoY from $9,848m to $10,292m (underlying $10,330m): salary and inflation +$316m (wage inflation $269m, IT vendor inflation $47m), volume-related personnel +$193m, technology & investment +$233m, D&A +$64m, other +$139m, productivity -$463m, AUD/NZ FX -$98m, remediation -$90m and capitalised software policy +$150m.
Single wide waterfall chart with red increases, black decreases and dotted brackets grouping investment in the business.
FY27 underlying opex growth expected to be <3% from a FY26 base of $10,214m ex restructuring, plus a $300m restructuring charge (announced 20 October 2026) and $125m capitalised software policy impact. Investment spend steady at ~$1.8bn ($1.78bn FY25, $1.84bn FY26) with a higher proportion expensed; a cost driver table lists inflation, personnel, technology, D&A, productivity and remediation considerations.
Two top panels (cost bridge chart and investment spend stacked bars) above a cost-driver table with plus/minus impact markers on the right.
2H26 credit impairment charge of $841m, up $135m, including a $196m underlying collective charge, $103m increase in forward-looking provisions and $542m individually assessed charge; CIC 0.20% of GLAs. Watch loans rose 22bps to 1.33% and non-performing exposures rose 4bps to 1.56%, reflecting deterioration in the Australian mortgage portfolio.
Left column of two charts (CIC stacked bars with ratio line; watch loans bars), right column commentary above an NPL stacked bar chart.
Total provisions of $6.8bn (1.76% of CRWA), 1.6x the 100% base case scenario; IAP balance $1.4bn ($137m higher than Mar 26); collective provisions up $278m to $5.4bn (1.40% of CRWA), including $196m underlying charge and $103m forward-looking increase, offset by a $21m FX-related release. History from Sep 19 to Sep 26 shown.
Large stacked bar chart with CP/CRWA and TP/CRWA lines on the left; key considerations bullets on the right.
CET1 moved from 11.65% (Mar 26) to 11.87% (Sep 26): cash earnings +78bps, dividend -58bps, credit RWA -21bps, FY26 interim DRP actions +40bps; pro forma 12.07%. Higher rates lifted IRRBB RWA, cutting CET1 by 11bps; discounted final DRP to add ~$0.9bn (~20bps) in 1Q27; $300m restructuring charge (-5bps); operating target of >11.25% unchanged. Credit RWA rose from $380.6bn to $387.0bn.
CET1 waterfall chart on top, key considerations bullets bottom-left and credit RWA waterfall bottom-right.
Bridge from Sep 25 pro forma CET1 11.81% to Sep 26 pro forma 12.07%: organic capital generation +0.49% (cash earnings 167bps less dividends 118bps) and -0.55% volume growth, rates & market volatility -0.32%, economic environment -0.09% ($403m forward-looking provisions), other +0.13% and capital raised +0.60% via discounted DRPs. FY27 settings focus on stronger starting capital, deliberate portfolio positioning, lower cost growth and business system growth moderating from 11.5% to 8%.
Green banner over a left grey table of CET1 movements and a right rounded panel listing FY27 capital settings.
LCR (quarterly average) 135% and NSFR 116% at Sep 26, well above 100% minimums. FY26 term funding issuance diversified across product, tenor and currency, with FY27 issuance expected broadly in line with prior years; issuance and maturity bars shown FY24-FY27.
Key messages bullets top-left, LCR/NSFR bar chart top-right and full-width term funding issuance and maturity stacked bar chart below.
Section divider for closing comments from Group CEO Andrew Irvine.
Section divider with red title, speaker name and dotted star outline.
Four actions: strengthened capital (pro forma CET1 12.07%, $7.2bn above the 10.5% minimum, 37bps higher than Sep 25); increased provisioning coverage (CP/CRWA 1.40%, total provisions $6.8bn or 1.76% of CRWA, highest since Sep 20); capitalised software policy ($1,347m write-down; balance from $3,430m to $2,196m); and simplifying the operating model to reduce duplication and speed decisions.
Four stacked rounded rows, each with a bold label, explanatory text and a mini chart on the right.
Business credit growth is moderating but expected to remain stronger than housing; NAB's pipeline is slightly below pcp but robust. Business-focused divisions generate ~80% of underlying profit (from ~70% in FY22), with customer-division underlying profit up 20% since FY22 and more stable returns on RWA in business divisions.
Two green label tiles on the left paired with a credit growth line chart, a stacked profit bar chart with grey circular callout, and a returns line chart.
FY27 priorities: maintain a resilient balance sheet and disciplined risk management; support customers through an evolving environment; keep growing business banking, deposits and proprietary home lending with stronger divisional alignment; improve cost efficiency through workforce change and technology modernisation; and increasingly leverage AI for growth and productivity.
Single large rounded red-outlined panel with five bullet points on white.
Section divider opening the appendix of additional Group information.
Section divider with red title and dotted star outline.
Key FY26 data: cash earnings $7,090m ex LNIs, cash ROE 11.4%, GLAs $822.4bn, customer deposits $692.6bn, impaired assets 0.34%, default but not impaired 1.22%, CET1 11.87%, NSFR 116%. Australian market share: business lending 21.7%, housing 14.0%, cards 27.2%. 43,271 FTE and 595 branches; ratings AA-/Aa2/AA-. Cash earnings split: B&PB 52.0%, C&IB 24.5%, Personal 19.2%, NZ 16.4%.
Left column with divisional earnings table and GLA pie chart above credit ratings strip; right column key financial, market share and non-financial data tables.
NAB Customer Voices three-pillar approach: focus on 20 'Must Win Battles', customer feedback loops (listen, learn, act) and granular experience metrics, in a four-step cycle of reviewing feedback, embedding immediate responses, making investment decisions and delivering better experiences to drive growth and returns.
Three header boxes with arrows above a circular four-step cycle diagram centred on a green 'Growth & Returns' hub.
Opex ex LNIs half-on-half bridge from $5,018m (Mar 26) to $5,274m (Sep 26), with underlying of $5,096m before AUD/NZ FX, remediation and capitalised software policy ($150m) effects; remediation reflects higher payroll costs ($61m) and lower customer-related costs ($5m).
Full-width waterfall chart with red increments and black reductions.
Half-yearly M&T income from Mar 22 to Sep 26 split into NAB risk management, derivative valuation adjustment and customer risk management; FY22-FY26 M&T income of $1,302m, $1,587m, $1,509m, $1,816m and $1,907m, also split by Markets vs Treasury and net interest vs other operating income.
Wide stacked bar chart on top with two smaller stacked bar charts underneath.
Customer-related remediation charges by half from 2H23 to 2H26 (continuing vs discontinued operations) covering incorrect rates, fees and discounts; JBWere Adviser Service Fee program complete. Payroll remediation FY26 costs of $75m ($7m 1H26, $68m 2H26), including $8m for colleague payments, $30m program run costs and $37m for future program costs.
Left bullet commentary; right two stacked bar charts for total and categorised remediation charges.
Explains why NAB uses cash earnings (not a statutory or audited measure) and reconciles FY26 cash earnings of $6,141m to statutory net profit of $6,143m via hedging and fair value volatility, amortisation of acquired intangibles and acquisitions/disposals items, with FY25, 2H26 and 1H26 comparatives.
Explanatory bullets on top and a full-width reconciliation table with columns FY26, FY25, change, 2H26, 1H26 and change.
Section divider for the digital transformation, technology and innovation appendix.
Section divider with red title and dotted star outline.
Progress against simple, fast and resilient pillars in FY26: single customer master covering 96% of Personal and B&PB customers, one contact centre platform, real-time payments on a cloud engine, business-lending time to yes down 28% since FY22, one onboarding experience, 30% of card payments on a new cloud switch, Confirmation of Payee, 24/7 fraud operations and NZ term deposits on a cloud core. FY27+ focus on process simplification, card migration and modernising 25 priority applications.
Three-column matrix with black column headers (Simple, Fast, Resilient), red row labels for FY26 progress and FY27+ focus.
Timeline of AI milestones from 2020-2023 (AI data platform, Customer Brain with >200 models, GenAI platform, responsible AI principles) through 2024 (~800 models, AI developer tools with AWS, >1,000 engineers trained), 2025 (Group Executive Digital, Data and AI, AI certification) to 2026 (>3,500 models, Databricks Genie, ~50 AI squads, programs with AWS and Anthropic, agentic AI toolkit).
Horizontal red timeline with four circular year markers, each above a grey rounded column of check-marked milestones.
AI operating model: governance, agentic platform, workforce capability and tech foundations supporting Growth (Banker.AI, Customer.AI), Productivity (Operations.AI, SDLC.AI, Obligations.AI, Cyber.AI) and AI for Colleagues (Ruby.AI, with role-appropriate tools such as Claude, Gemini, Copilot, Cursor, Claude Code and Devin).
Left stack of four red foundation tiles with icons; right three grey columns for Growth, Productivity and AI for Colleagues with named AI products.
NAB app rated #1 major banking app in the Apple App Store (4.8) and Google Play (4.6) for over a year, #3 mobile app for consumers, +20 NPS; monthly digitally active customers up 24% Sep 23-Sep 26. New features include in-app verification, tailored segment experiences, refreshed account screens, product discovery and home loan management.
Phone mockup on the left, feature list in the centre and stat tiles plus a red bar chart on the right.
NAB Connect, the business digital banking platform for B&PB and C&IB customers, rated #1 digital platform for 8 years running, desktop NPS +25 vs Sep 23, active customers up 14%, 99.86% service availability, plus Confirmation of Payee, closed and FX statements and upgraded FX deal capability.
Desktop and phone mockups on the left with feature bullets; award badge, green NPS figure and bar chart on the right.
Six protection pillars: 24/7 fraud assistance, real-time intervention, security technology (NAB Nexus integrated monitoring), enhanced behavioural detection, customer education and support, and industry partnerships such as AFCX. FY26 outcomes: >$980m invested in customer protection, ~2.5m real-time alerts with $403m in payments subsequently abandoned, and ~190 referrals a month to specialist support.
Photo panel on the left, six icon columns across the top and a grey FY26 outcomes strip at the bottom.
Section divider listing divisional pages: Business & Private Banking (52), Personal Banking (56), Corporate & Institutional Banking (58) and New Zealand Banking (60).
Section divider with red title, small page index and dotted star outline.
FY26 divisional cash earnings: B&PB $3,685m (+10.7%; 2H26 $1,835m, -0.8% HoH), Personal Banking $1,362m (+8.7%; 2H -5.4%), C&IB $1,740m (-6.1%; 2H -11.1%) and New Zealand Banking NZ$1,381m (-7.0%; 2H -10.3%).
Clean full-width table with five columns and generous row spacing.
B&PB revenue rose 8.2% to $9,230m, underlying profit 11.2% to $5,893m and cash earnings 10.7% to $3,685m. Business lending grew to $183.7bn (+5.7%, 8% incl. housing), housing lending $114.0bn and deposits $252.4bn (+6.1%); NIM 3.04% (2H26 3.06%); CIC $628m (0.21%); cash earnings on RWAs 2.20%.
Three bar charts across the top, lending/deposit stacked bars bottom-left and other key metrics table bottom-right.
Diversified business lending growth: agri $51bn (+7.9%), health $12bn (+16.2%), CRE $47bn (+11.2%), other $74bn (+10.8%), total B&PB $184bn (+10.5%), with broad-based growth in trade, manufacturing, health and construction. SME lending share (RBA) 27.7% at Aug 26 (affected by an RBA restatement); business lending share (APRA) 21.7%.
Growth bar chart across the top with balance labels and a callout bubble; two market share bar charts below.
End-to-end digital business lending platform: simplified digital origination, automated verification and decisioning, digital fulfilment and automated account management. Banker deals submitted digitally rose from 8% (2H22) to 83% (2H26), automated annual reviews from 23% to 72%, 77% of documents sent electronically and median time to yes ~28% shorter.
Chevron process flow across the top, green arrow pointing to four small metric charts and a 77% circular callout.
Integrated proposition across NAB Private Wealth, JBWere, nabtrade and NAB Private Investments, with awards from RFI Global and Global Finance. Deposits $48.2bn (+7.1%), housing lending $26.0bn (+6.1%), JBWere net inflows $2.3bn in 2H26 and FUM $53.7bn; Global Bond Service raised +$6bn since June 2023; new digital onboarding experiences.
Circular ecosystem diagram and award badges on the left, performance bar charts in the centre and highlights bullets on the right.
Personal Banking revenue rose 7.3% to $4,962m, underlying profit 10.4% to $2,257m and cash earnings 8.7% to $1,362m. Housing GLAs $262.7bn (+3.1%), deposits $188.6bn (+7%); NIM 1.85%; CIC $313m (0.12%); cash earnings on RWAs 1.60%.
Three bar charts across the top, GLA and deposit bars bottom-left and other key metrics table bottom-right.
ubank targets young Australians: NPS +22 (mortgages +22), 4.7/5 app rating and >60% of onboarded customers under 35. Deposits grew 11.0% to $23.3bn and lending 11.6% to $18.3bn; beta customers shared over 10,000 feedback points in three months.
ubank-branded layout with phone mockup on the left, teal and dark navy stat tiles and two teal/navy bar charts.
C&IB underlying profit $2,734m (+1.2%, ex Markets +4.9%), cash earnings $1,740m (-6.1%), revenue $4,120m (+0.6%; ex Markets +4.3%), Markets revenue $603m vs $671m. NIM 1.08% (2.04% ex Markets), CIC $282m (0.21%), cash earnings on RWAs 1.62%; includes wind-down of NAB Asset Servicing completed in 1H26.
Two bar charts across the top, stacked revenue breakdown bottom-left and metrics table bottom-right.
Coalition Greenwich survey results 2021-2026 versus the four major domestic banks: Large Corporate & Institutional NPS and RSI, Transactional Banking RSI, Interest Rate Derivatives RSI, Debt Capital Markets RSI and Foreign Exchange (Corporate) RSI, with NAB in red.
2x3 grid of small multi-line charts comparing NAB to three peers.
New Zealand Banking (local currency) revenue NZ$3,541m (+0.9%), underlying profit NZ$2,118m (-1.3%), cash earnings NZ$1,381m (-7.0%). Business lending NZ$49.5bn, housing NZ$68.8bn (+7.7%), deposits NZ$91.4bn; NIM 2.29% (2.60% ex Markets); CIC NZ$137m (0.12%); cash earnings on RWAs 1.99%.
Three bar charts across the top, balance stacked bars bottom-left and other key metrics table bottom-right.
BNZ ranks #1 in consumer NPS and equal #2 in business NPS among the five major New Zealand banks, tracked quarterly Sep 25-Sep 26 (Insights HQ and Kantar data).
Two side-by-side multi-line charts with end labels for BNZ and four peers.
NZ housing portfolio NZ$68.8bn (Sep 26) vs NZ$63.9bn, drawdowns NZ$18.9bn; 88.1% fixed rate, 64.6% owner occupied, 59.2% proprietary, interest only 18.9%, LVR at origination 65.8%; 90+ DPD 0.18% and impaired 0.14%, compared with industry trend charts.
Key metrics table on the left with two line charts (90+ DPD and impaired loans vs industry) on the right.
BNZ customer deposits by product rose from NZ$82bn (Sep 24) to NZ$91bn (Sep 26); mix steady at ~31% transaction incl. NBIs, ~21% savings, ~45% term deposits and ~3% offset.
Two stacked bar charts: absolute balances on the left and percentage mix on the right.
Section divider for the Australian lending and deposits appendix.
Section divider with red title, subtitle and dotted star outline.
Australian GLAs Mar 25-Sep 26 by division: B&PB $267bn to $302bn (business lending $184bn), Personal Banking $258bn to $271bn (housing $263bn), C&IB $116bn to $135bn and Ubank balances.
Four groups of stacked bar charts arranged left to right by division.
Australian housing portfolio $377bn at Sep 26: average loan size $438k, 93.7% variable, 65.3% owner occupied, 47.1% proprietary, interest only 17.4%, offset balances $60bn, dynamic LVR 39.9%, offset/redraw buffer 38.4 months; 90+ DPD 1.09%, impaired 0.10%, individually assessed provision coverage 25.7%, with drawdown metrics and properties in possession.
Dense full-width data table with portfolio columns and drawdown columns.
Origination requirements covering income verification and shading (10% rental, 20% less-certain income), household expenses (greater of declared or HEM), serviceability (customer rate plus 3.0% buffer or 5.75% floor), existing debt assessment and LVR limits (e.g. 95% P&I owner occupied, 80% at-risk postcodes, 70% high-risk), plus policies on DTI, LMI and broker verification.
Left table of policy categories with bullet descriptions; right LVR limits table and other policy bullets.
Housing lending flow bridge from $373bn (Mar 26) to $377bn (Sep 26) via new fundings, net refinance, interest and repayments, prepayments, property sales/closures and Advantedge; divisional balances: Personal Banking $262.7bn, B&PB $114.0bn and Ubank $18.3bn.
Waterfall chart across the top and three divisional bar chart groups below.
Mortgage portfolio mix: owner occupier P&I 60.4%, investor P&I 20.6%, investor IO 13.4%, owner occupier IO 3.9%, line of credit 1.7%; by state NSW/ACT 42%, VIC/TAS 32%, QLD 15%, WA 7%, SA/NT 4%; application income bands concentrated at $200k-$500k.
Two pie charts across the top and an application income band bar chart across the bottom.
Owner occupied lending $240.0bn to $247.8bn (+3.2%) and investor lending $127.5bn to $131.3bn (+3.0%); monthly growth versus system, with Nov-Dec 2025 movements distorted by a $4.2bn reclassification from investor to owner occupier.
Two bar charts on top and two NAB vs system monthly growth line charts below with callout boxes for the reclassification.
Offset and redraw balances growing over time (overall and variable), distribution by balance band, and distribution by monthly repayments ahead: 40% of accounts more than 2 years ahead at Sep 26, with ~2% behind.
Line chart and grouped bar chart across the top, grouped bar chart and stacked residual bars below.
LVR at origination and dynamic LVR distribution Mar 25-Sep 26; average dynamic LVR 39.7%; $17.7bn with dynamic LVR above 90%, of which $6.6bn is not covered by LMI or a first home buyer guarantee and $403m is 90+ DPD or impaired.
Two grouped bar charts stacked vertically with a callout box on the right.
Australian customer deposits grew from $560bn (Mar 25) to $618bn (Sep 26): transaction incl. NBIs $184bn, savings $156bn, term deposits $180bn, offsets $62bn and structured deposits $36bn; mix roughly 30% transaction, 25% savings, 29% term deposits.
Stacked bar chart of balances on the left and 100% stacked mix chart on the right.
Deposits by division Mar 25-Sep 26: B&PB $235bn to $252bn, Personal Banking $169bn to $189bn, C&IB $134bn to $154bn and Corporate Functions & Other (incl. Ubank and Treasury) ~$22-23bn, split by product type.
Four divisional stacked bar chart groups side by side.
Section divider for the Group asset quality appendix.
Section divider with red title, subtitle and dotted star outline.
Long-run credit impairment charge as % of GLAs since the late-1980s recession, GFC and COVID (0.19% latest), and half-yearly charges Mar 17-Sep 26 split into individually assessed and collective charges, reaching 0.20% in 2H26.
Long-run line chart with shaded crisis periods on top; stacked half-year bar chart with ratio labels below.
IAP rose to $1,391m at Sep 26 with IAP/impaired assets coverage of 50.3%; net write-offs $400m (0.10% of GLAs); composition of the IAP charge from 1H18 to 2H26 showing new and increased provisions versus write-backs and recoveries.
Two bar charts across the top and a wide half-yearly bar chart with ratio line below.
Group business mix shifted from 76% commercial / 16% home lending in 1985 to 44% commercial / 55% home lending in 2026. Estimated long run loss rate on the 2026 mix: 0.15% (1985-2026 average), 0.13% (2007-2026) and 0.08% (10 years), versus Australian averages of 0.29%, 0.19% and 0.08%.
Two pie charts on the left (1985 vs 2026) and loss rate table on the right.
GLAs of $822.4bn by product (housing 55%, other term lending 41%, asset & lease 2%, overdrafts 1%, cards 1%), geography (Australia 85%, New Zealand 12%, other 3%) and business unit (B&PB 37%, Personal 33%, C&IB 16%, NZ 12%, other 2%).
One large pie chart on the left and two smaller pies on the right.
Provision movement from $6,386m (Mar 26) to $6,801m (Sep 26), a $415m increase: underlying CP +$175m, economic adjustment +$106m, target sector FLAs -$3m and IAP +$137m. Explains model-based underlying CP, three-scenario economic adjustment, target sector FLAs (new Utilities FLA) and IAP.
Waterfall chart on top and four explanatory text columns underneath.
Total ECL provision $6,801m (probability weighted) vs $4,168m at 100% upside, $4,484m base case and $9,651m downside; Australian scenario weights unchanged at 2.5% upside, 52.5% base and 45.0% downside. Base case assumes GDP growth 1.5% FY27, unemployment 4.7% and house prices -4.9%; total provisions are 1.6x the base case.
Scenario tables and a stacked provisions bar chart on the left; key considerations bullets and economic assumptions table on the right.
Non-retail lending EAD of $437.4bn at Sep 26; NPLs as % of EAD by industry (commercial property 24% of EAD, agri 15%, finance & insurance 14%, then utilities, business services, manufacturing and others), highlighting target sectors with forward-looking adjustments.
Grouped bar chart by industry with reference lines and an industry-share strip along the bottom.
Target sector FLAs declined from $334m (Sep 24) to $264m (Sep 26), across utilities, agriculture, construction, energy-intensive industries, tourism and hospitality, Australian mortgages, retail trade and commercial property.
Stacked bar chart on the left with a colour legend on the right.
Group non-retail IRB EAD by PD band: investment grade 56.5% (57.5% Mar 26), sub-investment grade 42.2% and non-performing 1.28%; share of business lending exposures with PD >=2.5% around 8% since the Mar 25 Pillar 3 alignment.
Grouped PD band bar chart on top and long-run bar chart of high-PD exposures below.
Loans and advances by stage ($1,070bn total at Sep 26: $841bn stage 1, $216bn stage 2) and provisions by stage (stage 1 $679m, stage 2 $3,476m, stage 3 $2,646m); provision coverage of 0.08% stage 1, 1.61% stage 2 and 20.7% stage 3, with a table explaining stage definitions.
Three bar charts across the top and a staging definitions table with bullets below.
Arrears and impairments deteriorated in 2H26, skewed to mortgages serviced by business income: 30+ DPD 1.69%, 90+ DPD 1.09% and impaired 0.10%. Average dynamic LVR rose to 39.7%, net write-offs below 1bp, $17.7bn above 90% DLVR and $1.5bn in total housing provisions.
Key considerations bullets top-left, arrears line chart top-right and a wide area chart of average DLVR and negative equity below.
Australian housing 90+ DPD and impaired assets by state and purpose (investor 1.15%, FHB 1.03%, owner occupier 1.25%), 30+ DPD by purpose and by vintage calendar year 2017-2025 versus months on book.
2x2 grid of multi-line charts.
Card and personal lending CIC $125m (2.49%) in 2H26, down on improvement in the Citi portfolio and seasonality; 90+ DPD $82m (0.83%); consumer card revolve rate stable at ~65%; long-run 30+ DPD trends for consumer cards and personal lending.
Key considerations bullets top-left with three charts arranged around them.
Business lending CIC $520m (0.33%) in 2H26; non-performing exposure $6,350m (2.00% of GLAs) with impaired $2,009m; security profile ~58% fully secured; portfolio ~53% investment grade.
2x2 grid of stacked bar charts with ratio lines.
B&PB CIC $422m (0.28%) in 2H26; non-performing exposures $7,623m (2.53% of GLAs), split housing $5,518m and non-housing $2,105m; security 72% fully secured; 78% sub-investment grade or default.
2x2 grid of stacked bar charts.
B&PB business lending NPLs decreased to 2.99% of GLAs over 2H26 on lower default-but-not-impaired balances; deterioration in agri, construction and transport & storage; B&PB watch loans up 30% since Mar 26 reflecting earlier engagement and emerging stress.
Bullets top-left, stacked NPL bars top-right, industry grouped bar chart across the bottom.
Long-run B&PB business lending NPL ratios Sep 18-Sep 26 (2.99% at Sep 26), share of exposures with PD >=2.5% (~13%), security profile of higher-risk balances (21% partially secured, 72% fully secured) and total EaD with PD >=2.5% not fully secured.
Wide stacked bar chart on top; bar chart, stacked security bar and small table below.
Group agri EAD $65.9bn (Australia 79%, NZ 21%), ~15% of non-retail EAD; Australian portfolio EAD $52.2bn diversified across beef, mixed farming, grain, dairy and others, 87% fully secured; provisioning includes a $63m target sector FLA; mixed seasonal conditions and softening farm values.
Pie chart and bullets on top; sector pie, asset quality bars and security pie along the bottom.
Group CRE GLAs $87.9bn (Australia $81.1bn, NZ $6.8bn), 10.7% of Group GLAs; $99bn CRE EAD by sector (retail 25%, office 21%, industrial 21%, residential 16%) and geography (NSW 34%, VIC 25%, QLD 18%); 81% fully secured and mostly institutional investment grade.
GLA table top-left, sector and geography pies top-right, long-run balance bars and security pie below.
CRE non-performing exposures reduced over FY26, skewed to default-but-not-impaired; rising rates are a headwind for interest coverage; most new CRE investment lending below 60% LVR; provisioning includes a $55m target sector FLA; residential development and secondary office remain challenged.
Two columns of considerations above a non-performing exposure bar chart with ratio line.
Construction EAD $16.8bn (~4% of non-retail EAD), 58% construction trade services; 46% fully secured; ~50% of C&IB exposures are contingent facilities; provisioning includes $22m target sector FLA; non-performing exposure ratio around 2.8% at Sep 26.
EAD bars and bullets on top; sector and security pies and NPL bars along the bottom with a small table.
Manufacturing and transport & storage EAD ~$45bn (~10% of non-retail EAD) under pressure from elevated input costs; non-performing exposures up 9bps since Mar 26 to 2.33%; provisioning includes $49m target sector FLA; 46% fully secured.
EAD bars and bullets on top; sector pie, security pie and NPL bar chart below.
Non-bank F&I EAD $95.7bn (excluding $82bn of bank EAD supporting the LCR), including Funds Finance ($25.7bn, mainly investor recourse lending to private capital funds backed by high-quality institutional investors) and third-party securitisation ($34.2bn, ~99% rated AAA/AA).
EAD bars top-left with two pie charts below; explanatory text for Funds Finance and securitisation on the right.
Utilities EAD $28.4bn (~6% of non-retail EAD), with C&IB offshore $14.7bn, 75% investment grade; NPLs 1.81% of sector EAD at Sep 26, impacted by a small number of offshore broadband customers ($1.9bn EAD) facing cost overruns and weak take-up, with some exits in 2H26; provisioning includes $75m target sector FLA.
EAD bars and bullets on top; sub-sector pie, grade pie and NPL bar chart below.
Section divider for the capital, funding and liquidity appendix.
Section divider with red title, subtitle and dotted star outline.
Total RWA rose from $449.8bn (Mar 26) to $459.1bn (Sep 26), driven by credit risk (+$6.4bn) and IRRBB (+$4.4bn), with market risk lower; credit RWA $380.6bn to $387.0bn on strong business lending growth, partly offset by $3.0bn overlay releases.
Key messages bullets top-left, RWA waterfall top-right and quarterly credit RWA waterfall across the bottom.
IRRBB RWA grew ~$4.4bn to $22.3bn on higher swap rates (3-year AUD swap 4.9%); NAB hedges capital to 3 years and deposits to 5 years; EGL and optionality RWA expected to run off ~$1.5bn in FY27 and ~$2.3bn in FY28; 10bps swap move equals ~$0.5bn RWA.
Bullets top-left, runoff curve top-right, stacked IRRBB bar chart with swap rate line below.
NAB replicating portfolio balances and average rate (3.19% to 3.72%) and BNZ replicating portfolios (NZ$ balances, 3.80%), with long-run portfolio rates compared to 3m BBSW/BKBM and 3- and 5-year swap rates from Sep 21 to Sep 26.
Two bar charts with rate lines on the left and two long-run multi-line charts on the right.
APRA CET1 11.9% equates to an internationally comparable CET1 of 17.6% at Sep 26 (Tier 1 19.7%, total capital 28.9%), with a reconciliation table showing adjustments for deductions, IRRBB, mortgage multipliers and LGD floors, IPRE and other differences.
Grouped bar charts across the top and a reconciliation table across the bottom.
Timeline of regulatory changes for 2026-2028: APRA AT1 phase-out implementation, credit risk and market risk (APS 116) consultations, liquidity (APS 210) consultation, covered bond legislative limit (Banking Regulations 2026) and RBNZ capital settings review implementation.
Gantt-style table with year columns and grey bars labelled consultation or implementation.
From January 2027 APRA replaces 1.5% AT1 with 0.25% extra CET1 and 1.25% Tier 2; NAB has $7.1bn AT1 contributing until first calls through 2032; ~$6-7bn Tier 2 issuance expected per year. Tier 2 outstanding is 72% callable, 48% USD and 43% AUD; AT1 and Tier 2 runoff chart through FY33+.
Bullets top-left, capital requirement stacked bars top-right, two pies and runoff bars below.
Funded balance sheet of $1,060bn: assets 43% housing, 34% business lending, 21% liquid assets; funding 61% stable customer deposits, 14% term funding >12 months, 12% short-term wholesale, 6% equity. Sources and uses of funds over 12 months and Australian core funding gap vs peers.
Two stacked column 'balance sheet' bars on the left, sources/uses waterfall top-right and peer line chart bottom-right.
LCR quarterly average 135% at Sep 26 (HQLA $212bn vs net cash outflows $158bn); NSFR 116% with $738bn available stable funding vs $636bn required; movement bridges for LCR (132% to 135%) and NSFR.
Four charts in a 2x2 grid: LCR bars, NSFR composition stacks and two movement waterfalls.
Historical term funding issuance FY21-FY26 by type (senior unsecured, Tier 2, secured, RBA TFF, RBNZ facilities) with tenors of 4.3-8.1 years (5.2 years in FY26); term funding maturity profile FY27 to beyond FY31 with a weighted average maturity of 3.3 years.
Two stacked bar charts stacked vertically with tenor labels above bars.
FY26 issuance by product (senior 54%, covered 25%, Tier 2 16%, RMBS 5%) and currency (AUD 33%, USD 33%, EUR 16%, GBP 8%, NZD 6%); outstanding issuance senior 57%, Tier 2 and AT1 21%, covered 20%; 43% of covered bond capacity used.
Four pie charts in a 2x2 grid.
Indicative term wholesale issuance costs for 3-, 5- and 10-year senior and 10NC5 Tier 2, average term wholesale portfolio cost, domestic short-term funding costs (3M Bills-OIS spread, ~9bps move equals 1bp NIM) and Australian term deposit portfolio costs, Sep 21-Sep 26.
2x2 grid of line charts.
Section divider for the sustainability appendix.
Section divider with red title, subtitle and dotted star outline.
Strategic priorities: climate ($80bn environmental finance ambition by 2030; $34.7bn progress), housing affordability ($60bn housing affordability finance ambition by 2030; $13.7bn progress) and First Nations ($1bn First Nations finance ambition by 2030, replacing a retired $1bn lending ambition).
Red ambition banner over a black side label and three grey columns with large red figures and progress check-marks.
Section divider for the economic data appendix.
Section divider with red title, subtitle and dotted star outline.
NAB Economics forecasts: Australian GDP growth 1.3% CY26 and 1.0% CY27, unemployment 4.8% and 5.4%, trimmed-mean inflation 3.6% and 2.9%, cash rate 4.85% and 4.35%. Australian system growth FY27(f): housing 2.6% (7.0% FY26), business 8.0% (11.5%), total lending 4.5%, deposits 3.8%; matching NZ indicator and system growth tables.
Four data tables in a 2x2 grid (Australia left, New Zealand right).
NAB Monthly Business Survey data to September 2026: business confidence and conditions now below average, capacity utilisation above average, investment intentions fallen notably and cost growth elevated.
2x2 grid of long-run line charts.
Consumer spending has been resilient (NAB Spend Trend by category, MoM and YoY), real disposable income growth is easing and the household savings rate has stabilised.
Horizontal bar chart on the left, stacked contribution chart and savings rate line chart on the right.
Unemployment has risen gradually, labour demand growth remains positive, forward-looking indicators (job vacancies, job ads) still healthy and availability of suitable labour shows the market remains tight.
2x2 grid of long-run line charts.
House prices falling across all capital cities (Cotality index to 31 October 2026), rent growth still elevated, dwelling completions low relative to demand and rental vacancy rates low but starting to rise.
2x2 grid of multi-city line charts.
Underlying inflation has reaccelerated (trimmed mean), goods and services inflation has picked up, inflation is broad-based across tradeables and non-tradeables, and commodity prices remain elevated.
2x2 grid of line and bar-line charts.
NZ GDP growth has picked up recently, unemployment is rising, inflation remains elevated and the RBNZ is tightening policy, with a BNZ/NAB OCR forecast to end-2027.
2x2 grid of line charts with forecast segment.
Auckland house prices trending down with little movement elsewhere, sales volumes easing, new residential mortgage lending easing and dwelling consents plateauing.
2x2 grid of line charts.
Oil prices remain elevated as the war in Iran drags on, global growth has been relatively resilient with NAB forecasts to 2028, 10-year bond yields have risen sharply in 2026 (UK, US, Japan, Germany) and major central banks are tightening.
2x2 grid: two line charts, red bar chart and policy rate line chart.
Section divider for the abbreviations, glossary and disclaimer pages.
Section divider with red title and dotted star outline.
Footnote sources for page 11 MFI and NPS metrics, defining RFI Global Atlas business and consumer MFI share and the segment definitions for strategic NPS rankings.
Plain text page with numbered footnotes.
Glossary of abbreviations used in the deck, from AFCX, ANZSIC, AT1 and CET1 through DLVR, DRP, EAD, ECL, FLA, HQLA, IRRBB, LCR, LNI, MFI, NSFR and RWA to TFF.
Two-column shaded glossary table.
Legal disclaimer stating the material is general background information current at 5 November 2026, to be read with the 2026 Full Year Results Management Discussion and Analysis, with forward-looking statement cautions and risk factors; investor relations and media contacts listed.
Dense text disclaimer with contact names in three columns at the bottom.
Common questions about this slide and the underlying presentation content.
It is NAB's official 127-slide investor presentation for its 2026 full year results, dated 5 November 2026 and lodged with the ASX. It was presented by Group CEO Andrew Irvine and Group CFO Inder Singh, and covers financial results, divisions, technology, asset quality, capital, funding, sustainability and economic data.
NAB's financial year ends on 30 September, so FY26 covers October 2025 to September 2026. The deck also splits results into 1H26 (October 2025 to March 2026) and 2H26 (April to September 2026). This is different from the July-June year used by many other Australian companies.
Amounts are in Australian dollars (A$), written in the deck as $m or $bn. New Zealand Banking (BNZ) results are shown in New Zealand dollars (NZ$) in local currency.
Excluding large notable items of $1,347m before tax ($949m after tax), underlying profit rose 6.9% to $11,722m and cash earnings were flat at $7,090m. Revenue grew 5.8% to $22,014m, statutory profit fell 9.1% to $6,143m, cash ROE was 11.4% and the full-year dividend was 170 cents. The CET1 ratio was 11.87%, or 12.07% pro forma.
They relate to a change in NAB's capitalised software policy: a $1,347m (pre-tax) capitalised software write-down and accelerated amortisation booked in 1H26. NAB reports underlying profit and cash earnings both including and excluding these items.
Yes. This gallery page provides the original PDF of the presentation for free, along with slide images and a written summary of every page.
Bank analysts, investors comparing the major Australian banks, IR and finance teams building results decks, and designers who want examples of clear financial charts such as NIM, opex, provisioning and capital waterfalls.
The presentation was lodged with the Australian Securities Exchange (ASX) and is published with NAB's 2026 Full Year Results Management Discussion and Analysis and Annual Report on NAB's shareholder centre at nab.com.au.
Official NAB investor relations hub hosting results presentations, Management Discussion and Analysis and annual reports.

Create Your Own Slides
Turn your ideas into professional presentations in seconds with 2slides AI.
Reference professional designs, choose your style, and generate slides with perfect text rendering. Powered by Nano Banana—start creating your presentation now.
Your AI Agent for slides. Save time, shine faster with intelligent presentation creation.


© 2026 2slides. All rights reserved.