
Part of Investor presentation examples · Japanese investor presentation examples
Mitsui Kinzoku H1 FY2026 Earnings Presentation: a 31-page Japanese-language interim results deck from Mitsui Mining & Smelting Co., Ltd. (三井金属鉱業, brand Mitsui Kinzoku, TSE code 5706) for the first half of the fiscal year ending March 2027. The original was published on TDnet (Tokyo Stock Exchange timely disclosure) on November 10, 2026 under the title 第2四半期(中間期)決算説明資料. FY2026 here means the fiscal year ending March 2027, so H1 covers April to September 2026. The deck reports H1 net sales of ¥431.1 billion (4,311 億円) and operating profit of ¥57.5 billion (575 億円), raises the full-year operating profit forecast to ¥99.0 billion (990 億円), and announces a new copper foil plant in Malaysia (about ¥190.0 billion, 約1,900億円).
Uses this deck’s cover as a style reference for slides made from your own content. Or pick any page below to use its layout as the reference.
Quick Navigation
Tags
Share the slides
Mitsui Kinzoku H1 FY2026 Earnings Presentation: a 31-page Japanese-language interim results deck from Mitsui Mining & Smelting Co., Ltd. (三井金属鉱業, brand Mitsui Kinzoku, TSE code 5706) for the first half of the fiscal year ending March 2027. The original was published on TDnet (Tokyo Stock Exchange timely disclosure) on November 10, 2026 under the title 第2四半期(中間期)決算説明資料. FY2026 here means the fiscal year ending March 2027, so H1 covers April to September 2026. The deck reports H1 net sales of ¥431.1 billion (4,311 億円) and operating profit of ¥57.5 billion (575 億円), raises the full-year operating profit forecast to ¥99.0 billion (990 億円), and announces a new copper foil plant in Malaysia (about ¥190.0 billion, 約1,900億円).
Detailed view of each slide page, including layout, key content and visual elements.
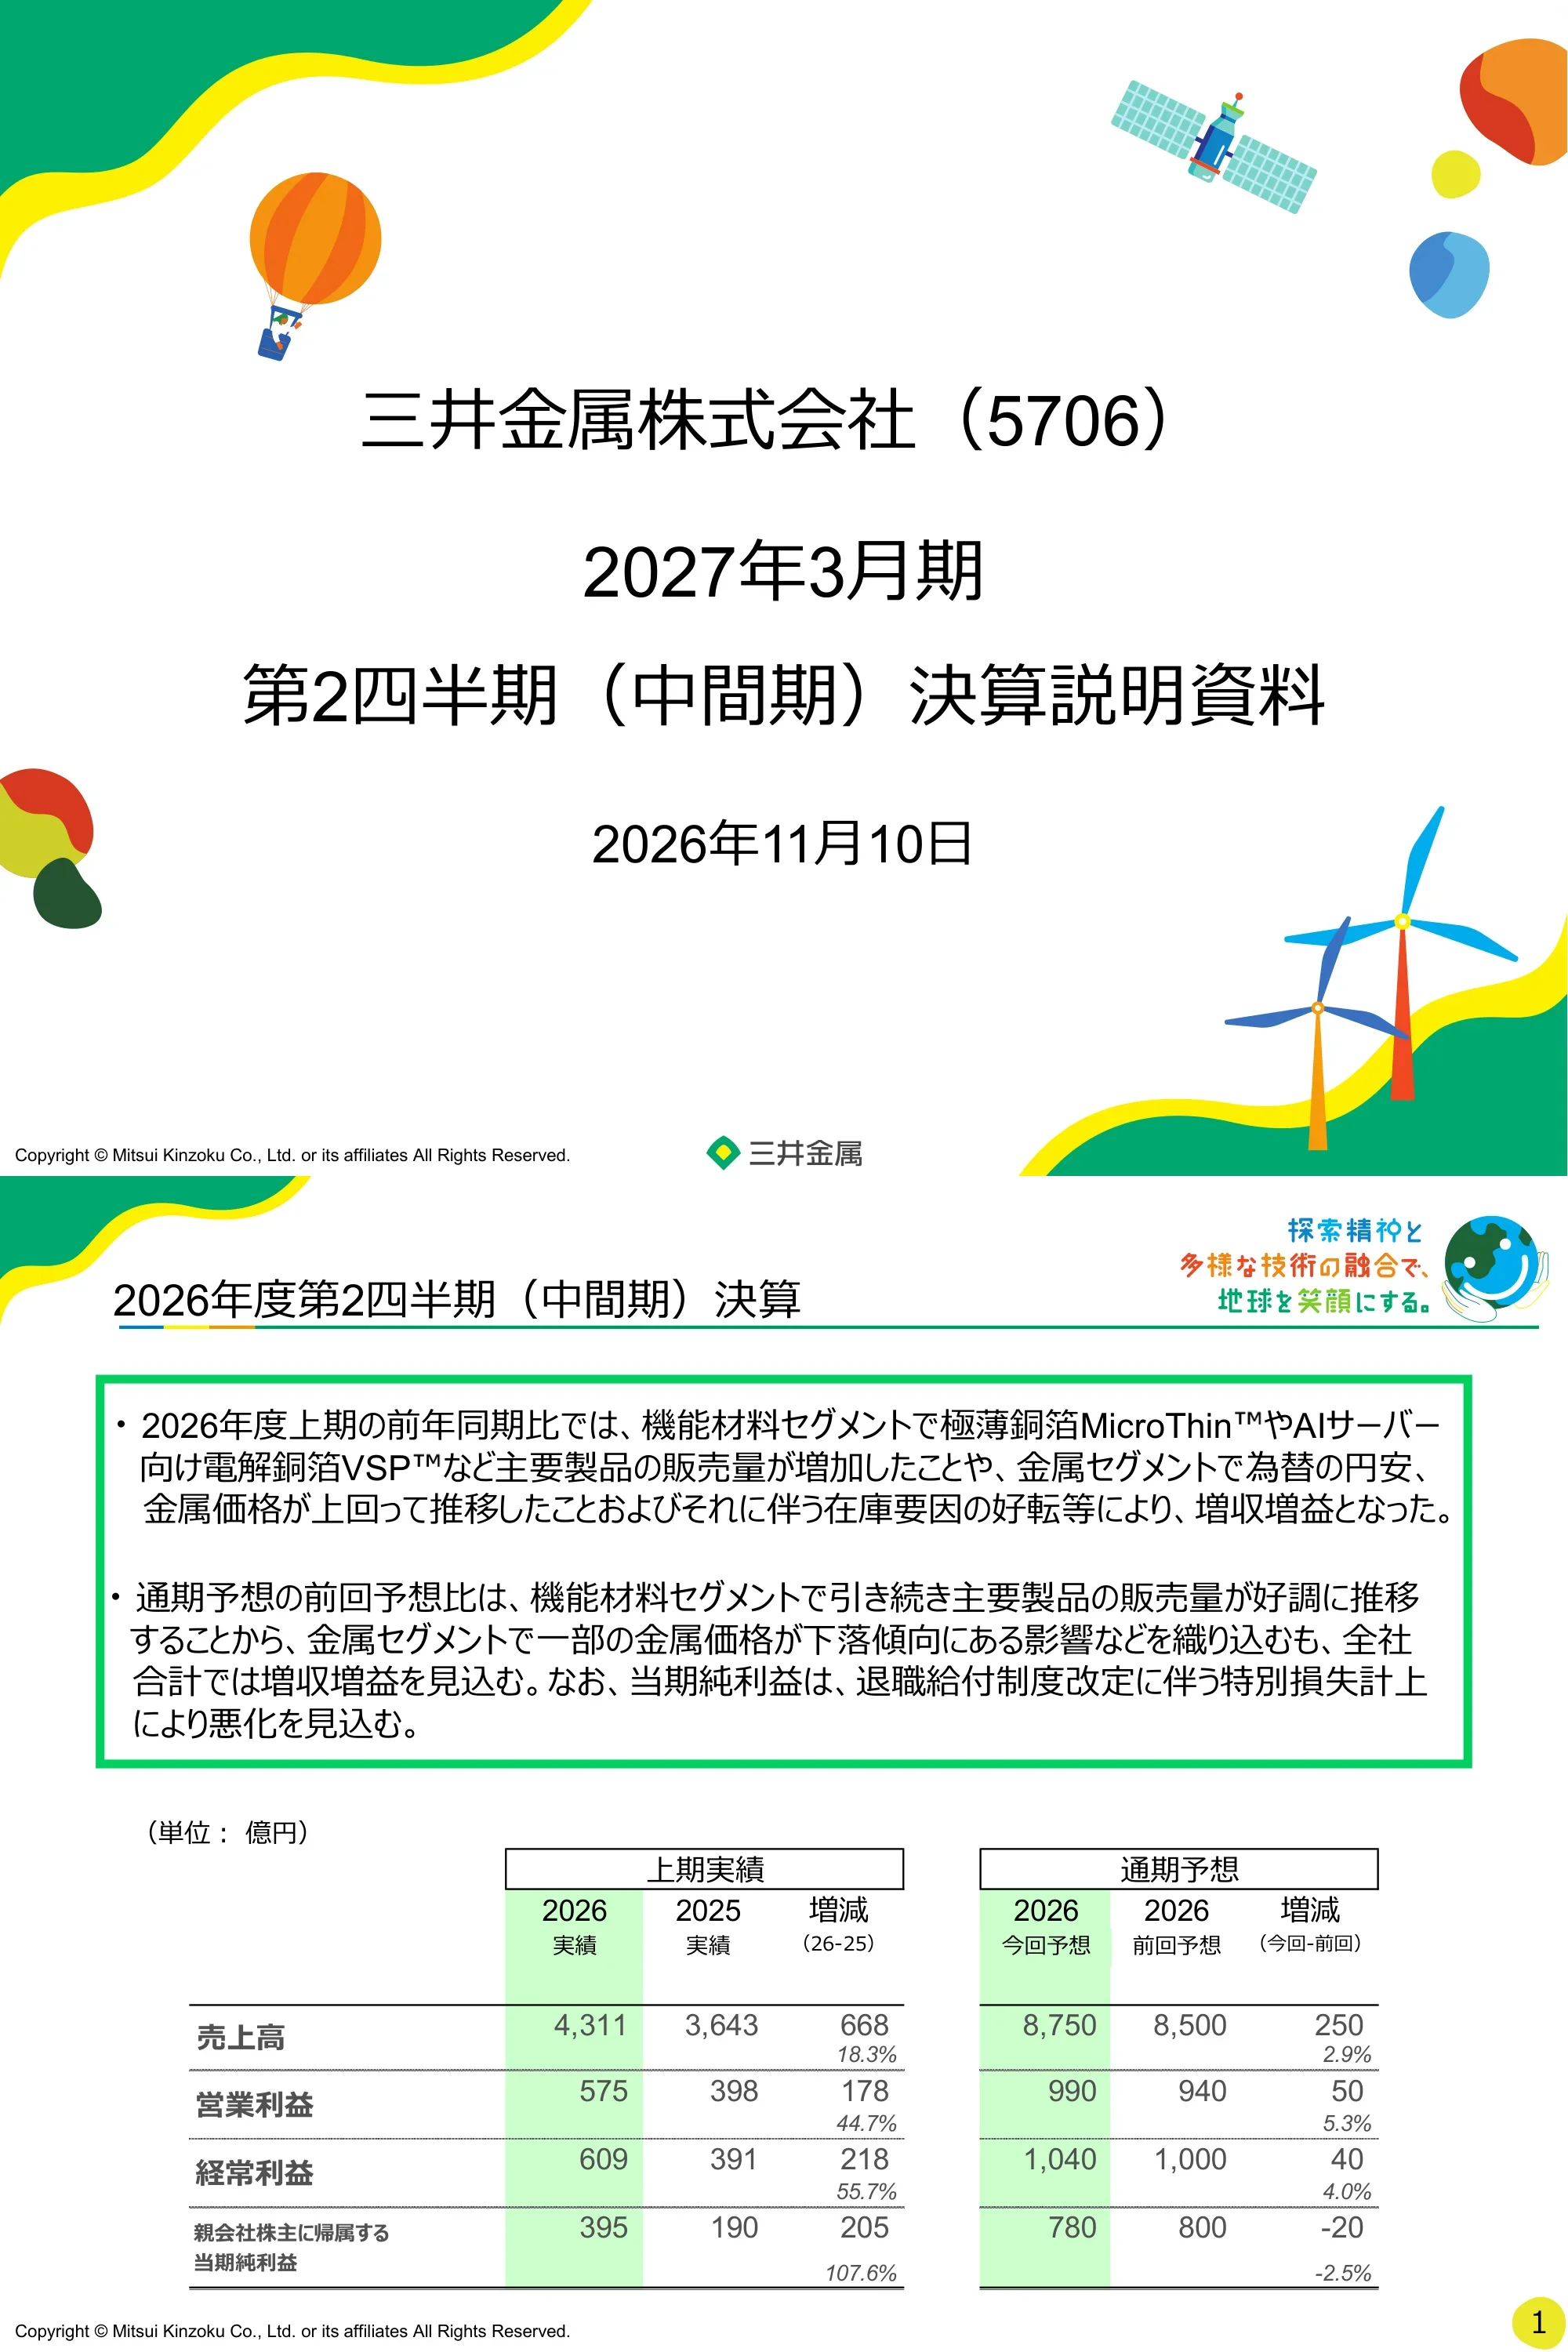
Cover slide for Mitsui Kinzoku Co., Ltd. (TSE code 5706), titled 2027年3月期 第2四半期(中間期)決算説明資料 (fiscal year ending March 2027, Q2 / interim earnings presentation) and dated November 10, 2026.
Centered title block with company name, fiscal period and date stacked vertically; decorative illustration clusters in the corners; copyright line and logo at the bottom.
H1 FY2026 (April-September 2026) delivered higher sales and profit year on year: net sales ¥431.1 billion (4,311 億円, +18.3%), operating profit ¥57.5 billion (575 億円, +44.7%), ordinary profit ¥60.9 billion (609 億円, +55.7%) and net profit attributable to owners of the parent ¥39.5 billion (395 億円, +107.6%). Growth was driven by functional materials volumes (MicroThin ultra-thin copper foil, VSP copper foil for AI servers) and, in metals, a weaker yen, higher metal prices and favorable inventory effects. The full-year forecast is now net sales ¥875.0 billion, operating profit ¥99.0 billion, ordinary profit ¥104.0 billion and net profit ¥78.0 billion (down ¥2.0 billion versus the prior forecast because of a special loss from a retirement benefit plan revision).
Title with company slogan logo at top right, a green-bordered commentary box with two bullet paragraphs, and two side-by-side tables below (H1 actual vs prior year with change; full-year forecast new vs previous with change).
Combined bar and line chart (¥100 million units) of net sales, operating profit, ordinary profit and net profit from March 2023 to the forecast for March 2027, plus H1 FY2026. Sales were 6,520, 6,467, 7,123 and 7,585 for FY3/2023 to FY3/2026, with a forecast of 8,750 for FY3/2027; H1 sales were 4,311. Ordinary profit peaked at 1,367 in FY3/2026 and is forecast at 1,040; operating profit 1,309 then 990; net profit 913 then 780. Dividend per share is shown as ¥14, ¥14, ¥18, ¥24.5 and a forecast ¥32, with DOE (dividend on equity) of 3.3%, 3.1%, 3.0%, 3.5% and 4.0%.
Full-width chart with green columns for sales and three colored lines for profits, a highlighted yellow band for H1, callout labels on the right, a dividend and DOE row below the axis and footnotes at the bottom right.
Operating profit is forecast at ¥99.0 billion (990), up ¥5.0 billion from the August 7 forecast of 940. H1 actual of 575 beat the prior H1 forecast of 450 by ¥12.5 billion, while the H2 forecast is cut to 415 from 490, a ¥7.5 billion reduction. Callouts point to pages 4, 5 and 22 for details.
Two grouped bar sets: the August 7 forecast (H1 450, H2 490, full year 940) in gray on the left and the November 10 forecast (H1 actual 575, H2 415, full year 990) in blue-violet on a shaded panel on the right, with dashed reference lines, up and down arrows and green callout bubbles.
Waterfall from the H1 forecast of 450 (August 7) to the H1 actual of 575, a ¥12.5 billion gain: inventory effects +56 (functional materials +20, metals +36), catalyst and precious-metal price effects +22, functional materials +27 (copper foil +61, catalysts -13, headquarters -20), metals +11 and head-office/other +9.
Horizontal waterfall with a gray start bar, floating teal bars and a violet end bar, boxed breakdowns with leader lines under or above each driver, and a large arrow label at the right.
Bridge from the previous H2 forecast of 490 to the new H2 forecast of 415, a ¥7.5 billion reduction: inventory effects -25 (functional materials +8, metals -33), precious-metal price effects 0, functional materials -2 (copper foil +25, catalysts -7, headquarters -23), metals -39 (including zinc and lead by-products -30) and head-office/other -9.
Same waterfall template as the previous page with orange downward bars, gray start bar, violet end bar and breakdown boxes; a large orange arrow labeled 75億円 reduction on the right.
Walk from the H1 actual of 575 to the H2 forecast of 415, a ¥16.0 billion decline: one-off factors -34, inventory effects -133 (functional materials -47, metals -86), catalyst and precious-metal prices -16, functional materials +29 (copper foil +4, catalysts +20), metals -8 (copper smelting +24, resources -32) and head-office/other +2.
Waterfall with a violet start bar (H1 actual), one teal positive bar and several orange negative bars, labeled breakdown boxes, and a large orange arrow reading 160億円 decline at the right.
On November 10, 2026 the company decided to build a new copper foil plant in Malaysia for MicroThin carrier-attached ultra-thin foil and VSP high-frequency electrolytic foil, land and buildings included. Total investment is about ¥190.0 billion (約1,900億円: land about 140億円, buildings about 320億円, production equipment and other about 1,440億円), funded by own cash and borrowings, with operations starting gradually from April 2031. Continued capacity increases in MicroThin, VSP and FaradFlex are expected to lift copper foil operating profit to 3.2 times the FY2025 level in FY2030 and 5.5 times in FY2033. A capacity table shows MicroThin rising from 4,900 K-m2 per month (FY2025) to 12,000 (FY2033) and VSP from 720 to 2,600 tonnes per month.
Numbered text list (investment content, amount, funding, start date) at the top, a green panel with the profit-multiple message and a capacity table by fiscal year below, with FY2031-2033 columns outlined in red and a footnote on the right.
Three-block table (H1, H2, full year; ¥100 million) comparing FY2026 against FY2025. H1: sales 4,311 (+18.3%), cost of sales 3,314, gross profit 997 (+24.8%), SG&A 421, operating profit 575 (+44.7%), non-operating items +34, ordinary profit 609, extraordinary items -52, pre-tax profit 557, net profit attributable to owners 395. Full-year forecast: sales 8,750 (+15.4%), operating profit 990 (-24.4%), ordinary profit 1,040, net profit 780 (-14.5%).
Three side-by-side tables with highlighted current-year columns, bold subtotal rows, dotted separators and italic percentage changes; H2 and full-year blocks show only line items that are forecast.
Segment sales (¥100 million), H1 FY2026 versus FY2025: Functional Materials 2,118 (+40.7%), Metals 2,115 (+31.2%), Headquarters-managed 801 (-28.5%), adjustments -724, consolidated 4,311 (+18.3%). Full-year forecast: Functional Materials 4,160 (+26.7%), Metals 4,390 (+16.5%), Headquarters-managed 1,570, consolidated 8,750.
Three-block table (H1, H2, full year) with each block showing current, prior year and change; a heavy rule above the consolidated row; large empty space below the table.
Segment operating profit, H1 FY2026: Functional Materials 464 (+65.4%), Metals 157 (-11.3%), Headquarters-managed -5, New Business Creation -43, adjustments +2, consolidated 575. Ordinary profit: Functional Materials 451, Metals 188, consolidated 609. Full-year forecast operating profit: Functional Materials 865, Metals 215, consolidated 990; ordinary profit consolidated 1,040. The H2 metals forecast (operating profit 58) falls sharply from 530 a year earlier.
Two stacked table sections (operating profit on top, ordinary profit below), each with H1, H2 and full-year blocks and segment rows ending in a consolidated line.
Variance table for H1 operating profit (26Q1-2 versus 25Q1-2): total 575 versus 398, +178. By driver: volume and production +61, market prices and FX +95, inventory and precious-metal price effects +76, margin and cost and other -55. Functional Materials +183 (volume 48, prices/FX 19, inventory/precious metals 49, margin/cost 68); Metals -20 (prices/FX +45, inventory +27, margin/cost -99).
Matrix table with segment rows on the left, operating profit comparison in the middle and a five-column variance decomposition on the right; negative values in red and a gray total row.
H1 non-operating items total +34 (equity-method gains +52, FX loss -17, interest -5, dividends +3) versus -6 a year earlier. H1 extraordinary items total -52 (versus -163): retirement benefit plan termination loss -64, gain on sale of affiliate shares +14, securities gain +10, fixed asset disposal -7. Full-year forecast includes a subsidy income of +56 in H2 and extraordinary items of -11 in total.
Two stacked tables (non-operating on top, extraordinary below), each with H1, H2 and full-year blocks and bold total rows.
Quarterly sales volume table for 2024, 2025 and the 2026 forecast (November 10 and August 7 versions). Electrolytic copper foil is 1,710 t/month for H1 2026 (forecast 1,670 for the full year); VSP is 700 t/month in H1 and 730 for the year, against 550 in 2025; MicroThin (a)+(b) is 4,250 K-m2/month in H1 and 4,320 for the year, up from 3,410; FaradFlex 70 in H1 and 80 for the year. Catalysts, semiconductor protective materials (index, Q1 2024 = 100) and zinc output (98 thousand tonnes in H1; 214 forecast for the year) are also shown.
Wide dense table with left-side vertical category labels (functional materials, metals), product rows with units, quarterly and period columns, a separate August 7 forecast block at the right and an index footnote.
Three tables in ¥100 million. Inventory effects: consolidated 31 in H1 2025 and 126 in H1 2026, with a full-year forecast of 109 (H2 forecast -17); metals 54 in H1 2026 and 22 for the full year. Catalyst and precious-metal price effects on functional materials: 16 for H1 2026 and 16 for the full year. Combined total: consolidated 142 in H1 2026 and 125 for the full-year forecast (previous forecast 68).
Three stacked tables with section headings and segment color tags (green functional materials, yellow metals, cyan headquarters); the right-hand block shows the August 7 forecast for comparison.
Functional Materials H1 FY2026: sales 2,118 (+613), operating profit 464 (+183), ordinary profit 451 (+187) and underlying profit 379 (+138). Full-year forecast: sales 4,160, operating profit 865, ordinary profit 850, underlying profit 769. Ordinary profit rose 187 in H1 mainly from copper foil +183 (MicroThin and VSP volume growth). A product and application table lists copper foil, catalysts, functional powders, rare materials, ceramics, thin-film materials and HRDP.
Top: ten-column results table (H1, H2, full year with prior-year and change). Bottom left: product photo and application table; bottom right: ordinary profit change explanation for H1 and the full year.
Metals H1 FY2026: sales 2,115 (+503), operating profit 157 (-20), ordinary profit 188 (+4) and underlying profit 134 (-23). Full-year forecast: sales 4,390, operating profit 215, ordinary profit 245 (-506 versus prior year) and underlying profit 223. Sensitivity tables show a ±$100/t change in LME zinc moves full-year ordinary profit by 14.8 (9.9 with hedges), lead by 2.3, and ±1 yen per dollar by 6.5 (5.1 with hedges). Zinc TC terms are $80/t for FY2025 and $85/t for FY2026.
Top: results table. Bottom left: ordinary profit change analysis table. Bottom right: sensitivity table, zinc TC terms and a text box of other major factors.
Stacked bar charts of capital expenditure and depreciation (¥100 million). Old organization: capex 325 (2022), 320 (2023), 314 (2024) with depreciation 336, 344, 332. New organization: capex 314 (2024), 365 (2025), 550 (2026 forecast) and 167 for H1 2026; depreciation 332, 298, about 310 forecast and 140 in H1. The 2026 forecast bar is split into functional materials 170, metals 221, headquarters 19 and New Business Creation 122.
Left half shows the old organization (three bars), right half the new organization (four bars, with the forecast bar outlined by a dashed border); depreciation is a red line with markers; legend at the bottom.
Total assets, equity, interest-bearing debt and net interest-bearing debt from March 2023 to the forecast for March 2027. Total assets 6,319, 6,406, 6,579, 6,975 and forecast 7,700; equity 2,534, 2,785, 3,315, 4,120 and 4,708. Interest-bearing debt falls from 2,192 to 1,141 and is forecast at 1,300; net debt falls from 1,924 to 559 and is forecast at 749. D/E ratio 0.87 to 0.28 (forecast 0.28), net D/E 0.76 to 0.14 (forecast 0.16) and equity ratio 40.1% to 59.1% (forecast 61.1%).
Stacked bars (total assets light blue, equity gold) with red and black lines for debt, forecast column highlighted in yellow, ratio rows below the axis.
Operating, investing and free cash flow (¥100 million): 2023 753 / -349 / 404; 2024 767 / -209 / 558; 2025 875 / -245 / 631; H1 2026 149 / -144 / 5. The 2026 forecast is operating CF 800, investing CF -830 and free cash flow -30, with the investing figure including a ¥30.0 billion M&A allowance.
Grouped bar chart with three bars per year (teal operating, yellow investing, blue free cash flow), dashed bars for the forecast and a rounded callout about the M&A allowance.
Section divider slide reading Appendix, introducing the supplementary data pages that follow.
Centered large title text on a white background with the same corner illustrations as the cover.
Price assumption table: zinc ($/t) 2,968 for 2025 and 3,723 for the 2026 forecast (3,416 in the August forecast); lead 1,953 and 1,903; copper (cents/lb) 491 and 640; indium ($/kg) 423 and 833; palladium ($/oz) 1,336 and 1,330; rhodium ($/oz) 7,731 and 9,005; exchange rate 150.8 and 157.2 yen per dollar (155.8 with hedges versus 149.7 for 2025).
Wide table with metals and FX as rows, quarterly, half and full-year columns for 2025 and the 2026 forecast, plus a separate August 7 forecast block; hedged rows shown below zinc and FX.
Full-year bridge from the August 7 forecast of 940 to the new forecast of 990, a ¥5.0 billion increase: inventory effects +31 (functional materials +28, metals +3), catalyst and precious-metal price effects +22, functional materials +25 (copper foil +85, catalysts -20, headquarters -43), metals -28 (including by-products -25) and head-office/other 0.
Waterfall chart with a gray start bar and a violet end bar, teal positive and orange negative floating bars with boxed breakdowns and an arrow labeled 50億円 increase.
Underlying operating profit (excluding inventory and catalyst/precious-metal price effects) in ¥100 million: old organization 196 (2022), 325 (2023), 577 (2024); new organization 577 (2024), 1,064 (2025), 887 forecast for 2026 (November 10) versus 890 (August 7). The 2026 forecast splits into functional materials 784 and metals 193.
Left: stacked bar chart for the old organization; right: stacked bars for the new organization with a yellow trend line, boxed totals above and a dashed border on the forecast bar.
Underlying ordinary profit (excluding inventory and catalyst/precious-metal price effects) in ¥100 million: old organization 267 (2022), 451 (2023), 584 (2024); new organization 584 (2024), 1,103 (2025), 915 forecast for 2026 (November 10) versus 932 (August 7). The 2026 forecast splits into functional materials 769 and metals 223, with New Business Creation at -80.
Same two-panel layout as the previous page: old organization on the left, new organization on the right, stacked columns with a yellow trend line and boxed totals.
Quarterly table (¥100 million) with a highlighted Q2 FY2026 column. Q2 FY2026 consolidated sales were 2,295 (+342 year on year, +279 quarter on quarter), operating profit 365 (+82, +155) and ordinary profit 375 (+83, +140), with net profit attributable to owners of 227 (the page shows -23 as the year-on-year change and +59 quarter on quarter). Q1 FY2026 was sales 2,016, operating profit 210, ordinary profit 235, net profit 168.
Dense matrix with sections for sales, operating profit, ordinary profit and net profit; columns for the four FY2025 quarters, Q1 and Q2 FY2026, H1, H2 forecast, full-year forecast and the two Q2 change columns; Q2 column highlighted green.
Quarterly table of operating and ordinary profit excluding inventory and catalyst/precious-metal price effects (¥100 million). Consolidated underlying operating profit: FY2025 1,064; Q1 FY2026 164; Q2 285; H1 449; H2 forecast 438; full-year forecast 887. Underlying ordinary profit: FY2025 1,103; Q1 180; Q2 288; H1 467; H2 448; full year 915. Functional materials leads with 226 in Q2 operating profit.
Two stacked sections (operating profit, ordinary profit) sharing the same column structure as the quarterly page, with Q2 highlighted in green.
Quarterly net sales by product group (¥100 million). Functional materials: copper foil 410 (Q1) and 495 (Q2 FY2026), catalysts 361 and 393, functional powders 147 and 138, other 88 and 88; total 1,006 and 1,112. Metals: zinc and lead 670 and 797, copper and precious metals 249 and 238, other 63 and 98; total 983 and 1,133. Headquarters-managed 382 and 419, adjustments -354 and -370, consolidated 2,016 and 2,295.
Table with color-coded segment blocks (green functional materials, yellow metals, cyan headquarters), product rows and bold segment totals, for 2025 quarters, the full year and 2026 Q1-Q2.
FY2026 one-off factors total -82 (¥100 million): copper foil prior-year sales settlement +28, zinc smelter major overhaul -20, copper smelter major overhaul -26, and a retirement benefit plan termination loss -64 (versus -46 in the August forecast). Reference FY2025 one-offs total -104, including the ACT share transfer loss -190 and a lead raw material composition effect +39. FY2026 non-operating FX gains and losses total -17 (copper foil +4, catalysts -15, other -6).
Four stacked tables (FY2026 one-offs, FY2025 reference one-offs, FY2026 FX gains and losses, FY2025 reference FX) with color-coded segment labels and a comparison block for the August forecast at the right.
Chart comparing the old organization (New Business Creation, Functional Materials, Metals, Mobility, Headquarters-managed) with the new one (New Business Creation, Functional Materials, Metals, Headquarters-managed). The Mobility division was dissolved: catalysts moved to Functional Materials, while Mitsui Kinzoku ACT, Diecast and Kyushu Precision moved to Headquarters-managed units. Note: all shares of Mitsui Kinzoku ACT were transferred on November 4, 2025.
Two columns of color-coded business-unit blocks (old on the left, new on the right) connected by red arrows that trace the businesses that moved.
Standard Japanese disclaimer stating that forward-looking statements involve risks and uncertainties and may differ materially from actual results, that the company does not guarantee them, that risk factors are described in the securities report and on the company website, and that the material is not an invitation to invest. Text-only page with no figures.
Title with logo at top, four left-aligned paragraphs of Japanese text and empty space below.
Common questions about this slide and the underlying presentation content.
It is Mitsui Kinzoku's (Mitsui Mining & Smelting, TSE 5706) interim earnings presentation for the first half of FY2026, meaning April to September 2026 within the fiscal year ending March 2027. It covers H1 results, a raised full-year forecast, a Malaysia copper foil investment, segment data, capex, cash flow and appendix tables.
H1 net sales were ¥431.1 billion (4,311 億円, +18.3%), operating profit ¥57.5 billion (575 億円, +44.7%), ordinary profit ¥60.9 billion (609 億円) and net profit attributable to owners ¥39.5 billion (395 億円). The full-year forecast is net sales 8,750, operating profit 990, ordinary profit 1,040 and net profit 780 (all in ¥100 million).
It is a Japanese-language deck. The original was published on TDnet, the Tokyo Stock Exchange's timely disclosure service, on November 10, 2026 as 決算説明資料 (第2四半期(中間期)決算説明資料). This gallery page provides English page-by-page analysis; the slides themselves remain in Japanese.
FY2026 is the fiscal year ending March 2027 and H1 (上期) is April to September 2026. H2 (下期) is October 2026 to March 2027 and 通期 means the full year. Amounts are in ¥100 million (億円) unless a page states otherwise.
Page 8 announces a decision on November 10, 2026 to build a new copper foil plant in Malaysia producing MicroThin and VSP foils. Total investment is about ¥190.0 billion (land about 140億円, buildings about 320億円, equipment about 1,440億円), with gradual start-up from April 2031.
Operating profit was raised by ¥5.0 billion to ¥99.0 billion (940 to 990) because H1 came in ¥12.5 billion above plan, partly offset by a ¥7.5 billion lower H2 outlook. Pages 4 to 7 and page 23 break the change into inventory effects, precious-metal prices, copper foil volume and metals items.
The original TDnet release was a PDF. On the gallery page you can browse the pages and use the 2slides download options where they are offered. For the official figures, refer to the company's own IR materials.
Yes. The deck offers reusable patterns: a summary box with two result tables, waterfall bridges with boxed breakdowns, multi-block P&L tables, stacked capex charts and an organization change diagram. Replace the figures and keep the structure, but do not reuse the company's logo or copyrighted artwork.

Create Your Own Slides
Turn your ideas into professional presentations in seconds with 2slides AI.
Reference professional designs, choose your style, and generate slides with perfect text rendering. Powered by Nano Banana—start creating your presentation now.
Your AI Agent for slides. Save time, shine faster with intelligent presentation creation.


© 2026 2slides. All rights reserved.