
Part of Investor presentation examples · E-commerce presentation examples
MercadoLibre Q3 2026 Investor Presentation: Q3'26 results for Latin America's largest e-commerce and fintech platform, covering US$22.8bn GMV, US$108.8bn TPV, US$10.75bn net revenues (+45% YoY, +41% FX-neutral), a US$17.9bn credit portfolio (+62% YoY), margin bridges, adjusted free cash flow, net debt and full non-GAAP reconciliations.
Uses this deck’s cover as a style reference for slides made from your own content. Or pick any page below to use its layout as the reference.
Quick Navigation
Tags
Share the slides
MercadoLibre Q3 2026 Investor Presentation: Q3'26 results for Latin America's largest e-commerce and fintech platform, covering US$22.8bn GMV, US$108.8bn TPV, US$10.75bn net revenues (+45% YoY, +41% FX-neutral), a US$17.9bn credit portfolio (+62% YoY), margin bridges, adjusted free cash flow, net debt and full non-GAAP reconciliations.
Detailed view of each slide page, including layout, key content and visual elements.
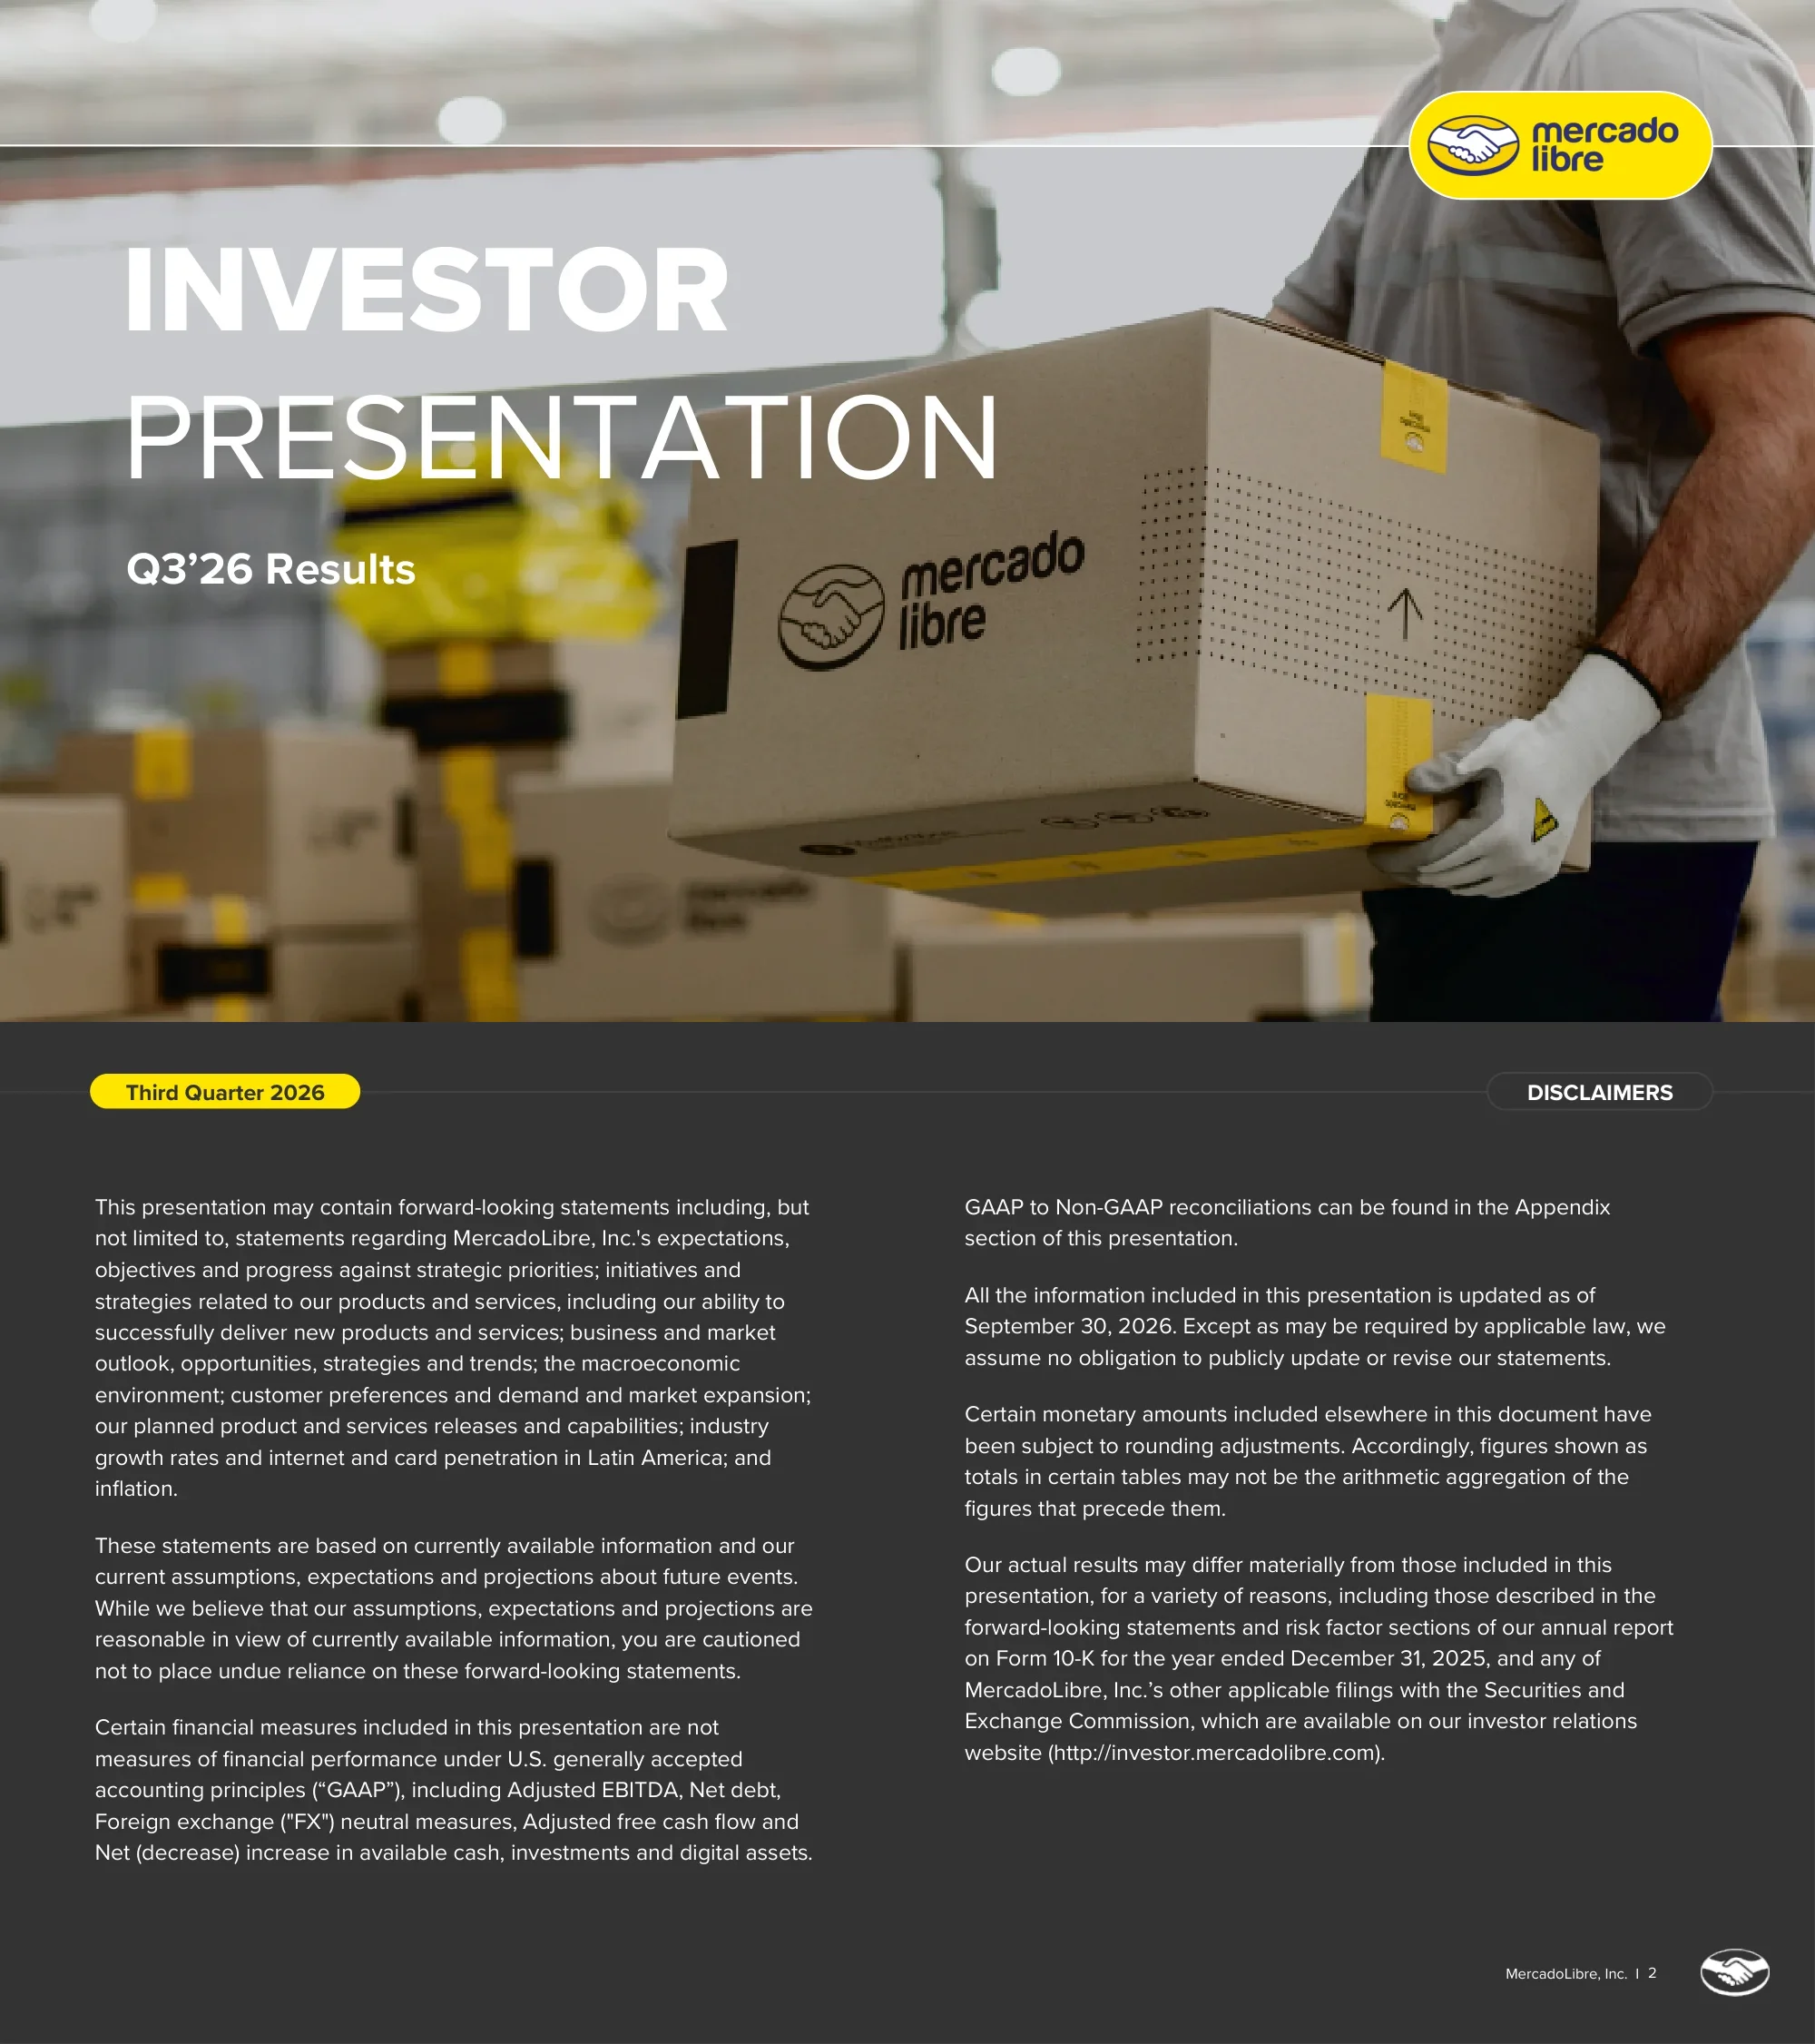
Cover slide reading 'Investor Presentation, Q3'26 Results' over a photo of a warehouse worker carrying a branded Mercado Libre shipping box, with the yellow Mercado Libre handshake logo pill at top right.
Full-bleed photograph with large white two-line title on the left, small subtitle beneath and a thin horizontal rule across the top third.
Forward-looking statements caveat covering strategy, products, Latin American internet and card penetration and inflation; notes that Adjusted EBITDA, net debt, FX-neutral measures, adjusted free cash flow and net change in available cash are non-GAAP, that data is as of September 30, 2026, and points to the 2025 Form 10-K risk factors and investor.mercadolibre.com.
Dark charcoal background with yellow 'Third Quarter 2026' pill top left, 'Disclaimers' outline pill top right and two columns of body text.
Three cards promoting IR content: a podcast featuring Jesus Moreno Sosa (Sr. VP Advertising, Mercado Libre), a new conversational AI 'MELI IR Assistant' that answers questions in any language from SEC filings, shareholder letters, earnings presentations, call transcripts, sustainability reports and proxy statements, and an IR Newsletter.
Three equal vertical cards, each with a yellow or photo header, a grey category pill and a large call-to-action with arrow (Listen here, Try it now, IR Newsletter).
Country-by-country social and economic impact study (Efecto MELI 2026, 2025 data): Brazil 0.7% of national GDP and 5.3M SMEs and entrepreneurs in the ecosystem; Argentina 1.0% of GDP and 67% of sellers first sold online through Mercado Libre; Mexico 0.4% of GDP and 137k associated jobs; Chile 0.3% of GDP and 15k associated jobs. Footnote clarifies impact is ecosystem contribution, not MELI revenue or GMV.
Headline and intro sentence with a yellow 'Explore the 2026 reports here' arrow banner, above four country cards in alternating yellow and outlined-dark styles.
Eight KPI tiles for Q3'26: GMV US$22.8bn (+38% YoY, +33% FXN), items sold 866.9MM (+36%), TPV US$108.8bn (+53% YoY, +51% FXN), credit portfolio US$17.9bn (+62%), net revenues and financial income US$10.75bn (+45% YoY, +41% FXN), income from operations US$676MM (6.3% margin), net income US$448MM (4.2% margin) and adjusted free cash flow US$285MM.
White background with a 4x2 grid of rounded outlined tiles, each showing a label, a large bold figure and a growth or margin line below a divider.
Section divider introducing the quarterly KPI section, shown over an image of a black Mercado Pago Visa card tapping a phone displaying an R$ 85,80 payment.
Yellow gradient background with a large translucent rounded pill containing the section number and title, and an arrow pointing right into a product photo.
Unique active buyers grew 22% YoY to 93.9MM in Q3'26 (Q3'25 76.8, Q4'25 83.2, Q1'26 84.1, Q2'26 89.3), adding more than 17 million buyers in a year with Brazil delivering the largest absolute gain; YoY growth by quarter 26%, 24%, 26%, 26%, 22%.
Left callout box with yellow outline and bold takeaway; right white panel with five-quarter yellow bar chart and growth pills underneath.
GMV FX-neutral growth stayed above 30% while items sold outpaced it. GMV FXN growth Q3'25 / Q2'26 / Q3'26: Argentina 44% / 38% / 40%, Brazil 34% / 39% / 36%, Mexico 34% / 26% / 21%, Other 30% / 40% / 43%, consolidated 35% / 36% / 33%. Items sold growth: Argentina 34% / 22% / 19%, Brazil 42% / 56% / 45%, Mexico 42% / 34% / 25%, Other 32% / 44% / 44%, consolidated 39% / 45% / 36%.
Two side-by-side clustered bar charts in one white panel, each with three bars per country (light grey, dark grey, yellow) and a shared legend.
Same and next day shipments rose 49% YoY to 258MM (Q3'25 173, Q4'25 191, Q1'26 199, Q2'26 225), outpacing total shipments, which reached 591MM (from 408, 470, 477, 535); YoY growth of fast shipments 28%, 29%, 39%, 38%, 49%.
Left white panel with five-quarter yellow bar chart and two rows of pills (growth and total shipments); right outlined callout box.
Purchase frequency hit a new high of 9.2 items per unique active buyer (Q3'25 8.3, Q4'25 9.0, Q1'26 8.6, Q2'26 8.9), up 12% YoY and the fifth straight quarter of double-digit growth, led by Brazil at 16%; YoY growth 11%, 15%, 16%, 14%, 12%.
Left outlined callout with bold headline; right white panel with a yellow line chart with circular markers and growth pills.
Fintech monthly active users grew 29% YoY to 92.9MM (Q3'25 72.2, Q4'25 77.9, Q1'26 82.9, Q2'26 88.0), with Brazil and Mexico growing ahead of the regional average on market-leading NPS; YoY growth 29%, 27%, 29%, 30%, 29%.
Left white panel with five-quarter bar chart and growth pills; right outlined callout box with headline and explanation.
AUM grew 67% YoY to US$25,118MM (from 15,070, 18,810, 19,873, 23,214) and the credit portfolio grew 62% to US$17,884MM (from 11,022, 12,508, 14,555, 16,375); Q3'26 mix 34% consumer, 47% credit card, 16% merchant, 2% asset-backed; originations rose from US$10,328MM to US$17,563MM. Q3'26 average exposure per user US$222 consumer, 445 credit card, 531 merchant, 7,430 asset-backed (car loans), with durations of 3.7, 2.7, 3.2 and 18.8 months.
Wide white panel with a bar chart on the left and a 100%-labelled stacked bar chart on the right, an originations row and a yellow-outlined table of exposure and duration below.
NIMAL was 20.1% of average portfolio in Q3'26 (Q3'25 21.0%, Q4'25 23.3%, Q1'26 17.8%, Q2'26 20.7%), reflecting a higher share of credit cards; credit card NIMAL improved sequentially as cohorts matured while other portfolios compressed slightly. NIMAL is defined as credit revenues minus provisions for doubtful accounts minus third-party funding costs.
Left outlined callout with headline and explanation; right white panel with a five-quarter percentage bar chart and a formula line beneath.
Asset quality held steady with the 15-90 day NPL ratio flat sequentially at 7.0% (Q3'25 6.8%, Q4'25 7.8%, Q1'26 8.0%, Q2'26 7.0%); the over-90-day NPL ratio moved from 17.6% to 19.3%. Provision coverage for over-15-day NPLs was 103% (from 105%) and for over-90-day NPLs 140% (from 146%, peaking at 150% in Q4'25).
Single white panel with two line charts side by side, each with a two-series legend and five quarterly labels.
Acquiring TPV grew 40% YoY FX-neutral to US$68.3bn (Acquiring OFF 44.5, Acquiring ON 23.8), up from 47.7bn in Q3'25 (55.7, 56.0, 64.1 in between); quarterly FXN growth 45%, 40%, 41%, 42%, 40%. Segment FXN growth Q3'25 / Q2'26 / Q3'26: Argentina 70% / 52% / 55%, Brazil 28% / 32% / 31%, Mexico 53% / 47% / 43%, Other 37% / 29% / 18%, consolidated 45% / 42% / 40%.
White panel split into a stacked bar chart (on- and off-platform) with growth pills on the left and a clustered bar chart by country on the right.
Section divider for financial metrics, showing a smiling customer unboxing brown leather loafers from a Mercado Libre box printed 'Hola, ¡llegué! :)'.
Yellow-to-olive gradient background with large numbered translucent pill and arrow on the left, lifestyle photo on the right.
Commerce revenue grew 41% YoY FX-neutral to US$6,141MM (services 4,613, product sales 1,528), up from 4,174 in Q3'25 (4,978, 4,868, 5,762 in between); FXN growth 38%, 37%, 39%, 40%, 41%. 3P take rate rose on advertising growth and shipping fee adjustments, partly offset by fee discounts in Brazil and MELI+ expansion in Argentina.
Left white panel with stacked bars and an FX-neutral growth line above; right outlined callout box with two paragraphs.
Fintech revenue grew 40% YoY FX-neutral to US$4,609MM (financial services and income 2,172, credit revenues 2,420, fintech product sales 17), up from 3,235 in Q3'25 (3,781, 3,977, 4,407 in between); FXN growth decelerated 65%, 61%, 54%, 47%, 40%. Credit was the main growth driver while Mercado Pago gained share in online and in-store payments.
Left outlined callout box; right white panel with three-layer stacked bars and a declining growth line above.
Operating margin was 6.3% as MercadoLibre kept investing in engagement and growth: income from operations US$724MM, 889, 611, 683, 676MM (margins 9.8%, 10.1%, 6.9%, 6.7%, 6.3%); net income US$421MM, 559, 417, 466, 448MM (margins 5.7%, 6.4%, 4.7%, 4.6%, 4.2%) from Q3'25 to Q3'26.
One white panel with two bar charts side by side, each with a margin line and percentage labels above the bars.
YoY bridge from 9.8% to 6.3% operating margin (-350 bps): COGS -2.5 pts, bad debt -1.5 pts, sales and marketing -0.3 pts, G&A +0.1 pts, product development +0.7 pts. Wider free shipping plus take rate and PIX discounts in Brazil compressed gross margin, partly offset by G&A and product development leverage; higher bad debt reflects credit portfolio growth.
Explanatory paragraph above a full-width waterfall chart with yellow start and end bars, red negative and green positive steps and a -350 bps bracket.
Sequential bridge from 6.7% to 6.3% (-40 bps): COGS -0.1, bad debt +0.1, sales and marketing -0.4, G&A -0.2, product development +0.2 pts. The decline reflects a 60 bps net shipping headwind (40 bps in gross margin, 20 bps in G&A) and 40 bps of higher marketing spend, partly offset by 20 bps of product development leverage.
Explanatory paragraph above a full-width waterfall chart with small step bars and a -40 bps bracket.
YoY bridge from 5.7% to 4.2% net income margin (-150 bps): COGS plus opex -3.5 pts and net interest income and expense -0.2 pts, partly offset by a lower tax burden +1.5 pts and lower foreign exchange losses +0.7 pts.
Full-width white panel with a waterfall chart, yellow start and end bars, red and green steps and a -150 bps bracket.
Q3'26 adjusted free cash flow of US$285MM: cash from operations 2,950, reconciliation adjustments 31, restricted customer funds -1,551, capex -503, loans receivable -2,143 and fintech funding +1,501; other loans payable +1,173, other activities -10 and FX -73 lifted available cash and investments by 1,375 from 6,751 to 8,126MM (total cash, restricted cash and investments 20,559 to 23,390MM).
Left white panel with a horizontal waterfall of labelled bars and a dotted box grouping the adjusted FCF items; right outlined callout box summarising capex, credit investment and funding.
Net debt rose to US$8,028MM (from 4,605, 4,682, 5,748, 6,425) as fintech debt reached 9,691, commerce, corporate and other debt 3,499 and operating leases 2,964, against available cash of 8,126. Net debt / adjusted EBITDA including fintech debt was 2.04x (from 1.19x), while excluding fintech debt it stayed negative at -0.42x; most debt funds fintech receivables.
White panel with stacked bars above and available-cash bars below a zero line, red-outlined net debt totals, two rows of leverage ratio pills and a right callout box.
US$9.7bn of fintech debt (other fintech debt 5,527, securitization debt 4,164) is covered 1.3x by the US$13.0bn net credit portfolio and 1.8x by the US$17,884MM gross portfolio (allowances 4,844).
White panel with two stacked bars compared via dashed lines and vertical arrows labelled 1.3x and 1.8x, plus legend and right callout box.
Section divider for the revenue and financial factsheet, reusing the cover's warehouse photo of a worker carrying a Mercado Libre box.
Full-bleed photo with large numbered translucent pill and right arrow on the left.
Q3'26 vs Q3'25 net revenues by country (US$MM): Brazil 6,001 vs 4,009 (commerce 3,659, fintech 2,342), Mexico 2,429 vs 1,651 (1,453 / 976), Argentina 1,818 vs 1,441 (678 / 1,140), others 502 vs 308 (351 / 151), total 10,750 vs 7,409; commerce services 4,613, product sales 1,528, financial services 2,172, credit revenues 2,420 and fintech product sales 17. Footnotes define each revenue line.
White background with a wide data table: row labels in grey pills, yellow country and period header pills, bold subtotal rows, and dense footnotes below.
One-page factsheet: GMV US$22,818MM (+32.9% FXN), items sold 866.9MM (+36.5%), live listings 1,247.8MM (+101.9%), managed network penetration 97.6% (+280 bps), TPV US$108,801MM (+50.8% FXN; acquiring 68,279, fintech services 40,522), TPN 5,656MM, AUM US$25,118MM (+66.7%), credit portfolio US$17,884MM (+62.3%; credit card 8,467, consumer 6,062, merchant 2,918, asset-backed 437); unique buyers 93.9MM (+22.3%) and fintech MAU 92.9MM (+28.7%); gross profit US$4,384MM (40.8% margin, -250 bps), operating margin 6.3%, net income US$448MM; segment revenue growth in US$ for each country and consolidated (+45.1%).
Three-column factsheet with yellow section header pills (Volumes, Users, P&L, Net revs per segment) and label / value / growth rows.
Appendix divider with a smiling woman working on a laptop next to a Mercado Libre box labelled 'Hola, ¡llegué! :)'.
Yellow gradient background with numbered translucent pill and arrow on the left and lifestyle photo on the right.
Glossary of KPIs: commerce and fintech revenue, net income and operating margin, fintech MAU (seven qualifying actions), unique active buyers and GMV and items sold (including food delivery from Q2 2025), TPV, acquiring TPV, total payment transactions, AUM, NIMAL, NPL ratio and the FX-neutral methodology using 2025 average monthly exchange rates.
Large white rounded panel with a two-column term / definition list on a charcoal background.
Q3'26 revenue YoY growth in USD vs FX-neutral: commerce 47% vs 41%, fintech 42% vs 40%, total MELI 45% vs 41%.
Centered white card with a three-row table and two yellow column header pills (USD, FX Neutral).
As reported, net revenues US$10,750MM vs 7,409 (+45.1%), cost of revenues 6,366 vs 4,200, gross profit 4,384 vs 3,209 (+36.6%), opex 3,708 vs 2,485 and income from operations 676 vs 724 (-6.5%). FX-neutral: net revenues 10,432 (+40.8%), gross profit 4,277 (+33.3%), opex 3,583 and income from operations 694 (-4.0%).
Wide white panel with a two-block table (as reported and FX-neutral) under yellow header pills, with rules under subtotal rows.
Adjusted EBITDA of US$982MM in Q3'26 vs 933 in Q3'25: net income 448 (421) plus D&A 306 (209), interest income and other financial gains -55 (-49), interest expense and other financial losses 58 (35), foreign currency losses 72 (102) and income tax 153 (215).
Centered white card with a single reconciliation table, grey label pills and double rules under net income and adjusted EBITDA.
Total debt US$16,154MM at September 30, 2026 vs 11,392 at December 31, 2025 (current loans 6,909, non-current loans 6,281, operating leases 599 and 2,365), less cash 4,010, short-term investments 2,740 and long-term investments 1,376 (total 8,126 vs 6,710), giving net debt of US$8,028MM vs 4,682.
White card with a two-date table, grey label pills, bold total rows and footnotes on exclusions.
Adjusted FCF of US$285MM in Q3'26 (206 in Q3'25) and US$443MM for the nine months (718): CFO 2,950 (9M 8,687), restricted funds -1,551 (-3,574), capex -503 (-1,215), loans receivable -2,143 (-6,212), fintech funding 1,501 (2,719). Net increase in available cash was 1,375 for the quarter and 1,416 for nine months, ending at 8,126; net cash used in investing -3,546 and provided by financing 2,707 in Q3'26.
Wide white panel with a four-column table (nine months and three months, 2026 and 2025), shaded subtotal rows and footnotes.
Closing slide with investor relations contacts (investor@mercadolibre.com and investor.mercadolibre.com) over a photo of a phone showing the Mercado Libre app with Spanish promotions for kitchen deals and interest-free installments.
Full-bleed photo with yellow logo pill top right and a large yellow rounded contact box bottom left.
Common questions about this slide and the underlying presentation content.
It is MercadoLibre's 36-page earnings deck for the quarter ended September 30, 2026. It covers highlights, marketplace and fintech KPIs, acquiring TPV, commerce and fintech revenues, margin bridges, adjusted free cash flow, net debt, fintech debt coverage, a revenue breakdown by country, a one-page factsheet, definitions and non-GAAP reconciliations.
Net revenues and financial income were US$10.75bn (+45% YoY, +41% FX-neutral), GMV US$22.8bn (+33% FX-neutral), TPV US$108.8bn, credit portfolio US$17.9bn (+62%), income from operations US$676MM (6.3% margin), net income US$448MM (4.2% margin) and adjusted free cash flow US$285MM.
The YoY bridge on page 20 shows a 350 bps decline from 9.8% to 6.3%, driven by COGS (wider free shipping plus take rate and PIX discounts in Brazil) and higher bad debt from the growing credit book, partly offset by G&A and product development leverage. The QoQ bridge on page 21 shows a further 40 bps decline.
The 15-90 day NPL ratio was 7.0%, flat versus Q2'26, NIMAL was 20.1%, and provision coverage was 103% of over-15-day NPLs and 140% of over-90-day NPLs. Fintech debt of US$9.7bn is covered 1.3x by the US$13.0bn net credit portfolio.
MercadoLibre, Inc. (Nasdaq: MELI) published it on its investor relations website, investor.mercadolibre.com, alongside its Q3 2026 earnings release. The page here shows every slide with a text summary, and the original PDF is free to download.
Yes, as a design reference. The deck shows a reusable earnings structure: KPI tile summary, five-quarter trend charts with growth pills, country comparison bars, margin waterfalls, a cash-flow bridge and an appendix of reconciliations, all in a consistent yellow and charcoal style. You can rebuild a similar layout with your own data in 2Slides.
It uses the same structure and design. Most charts show five quarters, so Q2'26 values appear next to Q3'26. For example, unique active buyers rose from 89.3MM to 93.9MM, the credit portfolio from US$16.4bn to US$17.9bn, and operating margin moved from 6.7% to 6.3%.
Official IR site with quarterly results, earnings presentations, shareholder letters and SEC filings.

Create Your Own Slides
Turn your ideas into professional presentations in seconds with 2slides AI.
Reference professional designs, choose your style, and generate slides with perfect text rendering. Powered by Nano Banana—start creating your presentation now.
Your AI Agent for slides. Save time, shine faster with intelligent presentation creation.


© 2026 2slides. All rights reserved.