
Part of Investor presentation examples
Mapletree Pan Asia Commercial Trust Investor Presentation November 2026 — the 13 November 2026 investor presentation of Mapletree Pan Asia Commercial Trust (MPACT, SGX: N2IU), a Singapore-listed REIT with 15 office, business park and retail properties in Singapore, Hong Kong, China, Japan and South Korea, built around its 2Q FY26/27 and 1H FY26/27 results (April to September 2026) and covering portfolio, capital management, sustainability and market data. Amounts are in S$ (Singapore dollars) unless stated.
Uses this deck’s cover as a style reference for slides made from your own content. Or pick any page below to use its layout as the reference.
Quick Navigation
Tags
Share the slides
Mapletree Pan Asia Commercial Trust Investor Presentation November 2026 — the 13 November 2026 investor presentation of Mapletree Pan Asia Commercial Trust (MPACT, SGX: N2IU), a Singapore-listed REIT with 15 office, business park and retail properties in Singapore, Hong Kong, China, Japan and South Korea, built around its 2Q FY26/27 and 1H FY26/27 results (April to September 2026) and covering portfolio, capital management, sustainability and market data. Amounts are in S$ (Singapore dollars) unless stated.
Detailed view of each slide page, including layout, key content and visual elements.
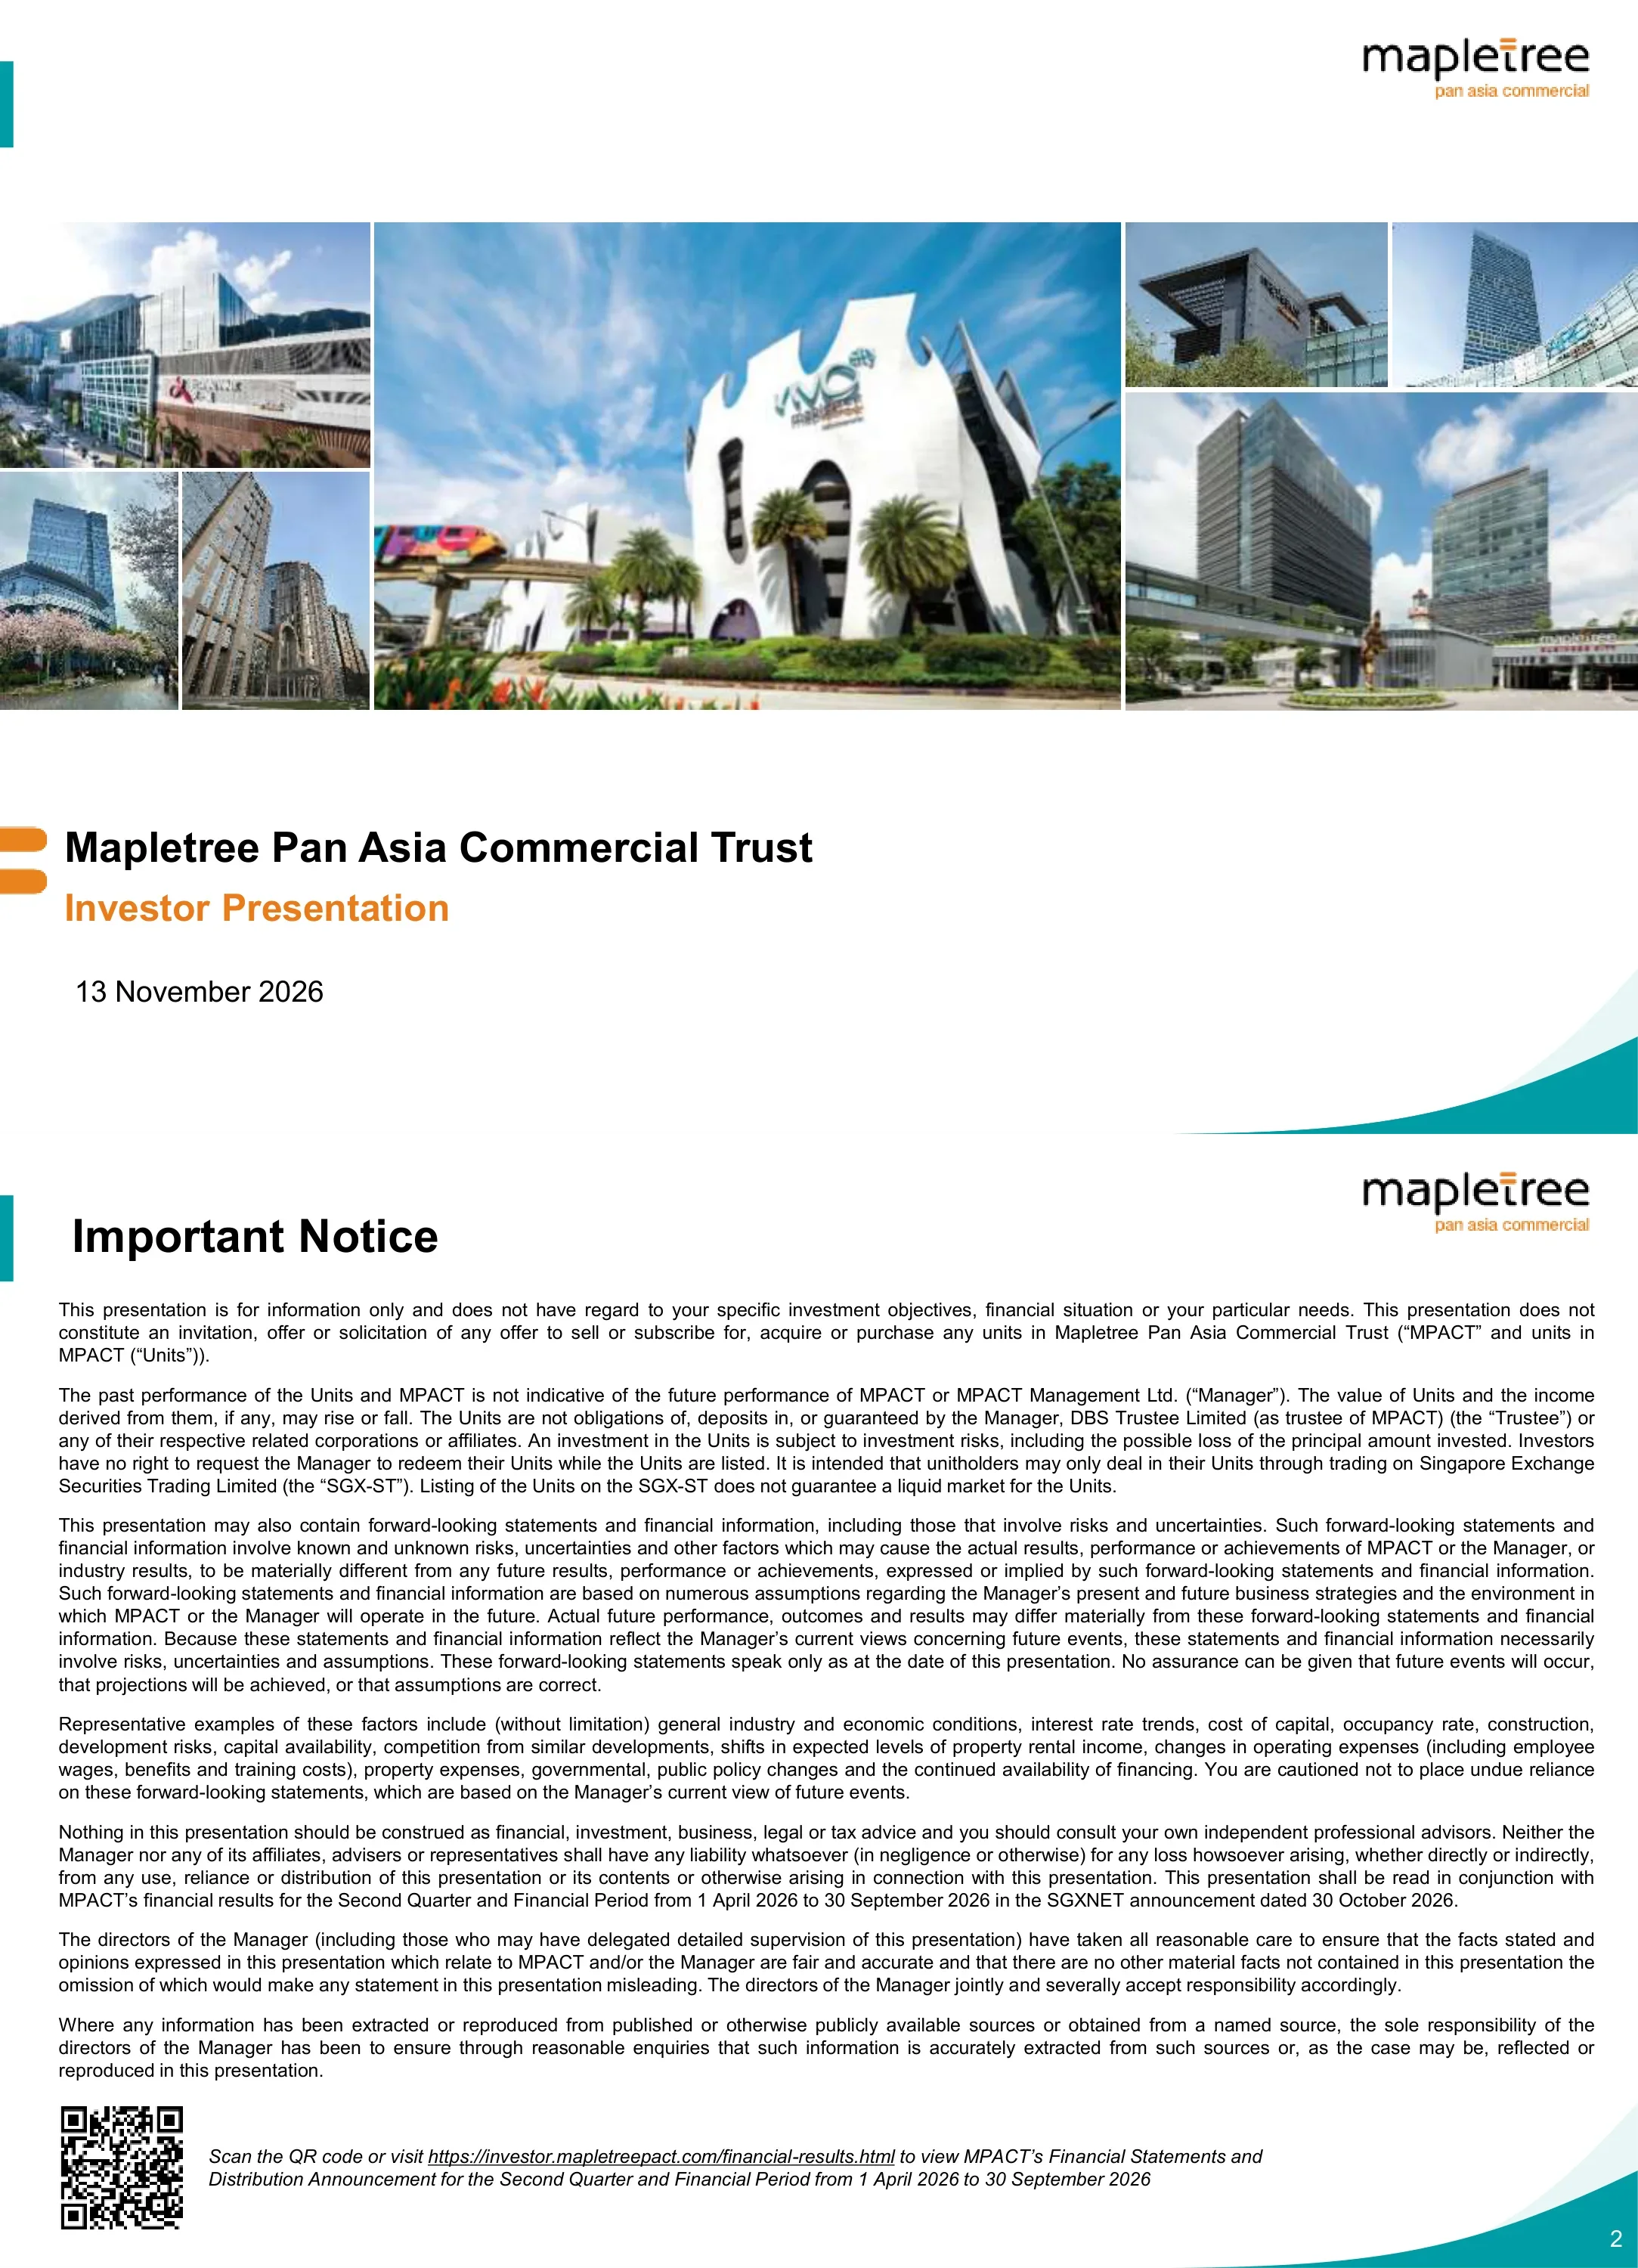
Title slide for the Mapletree Pan Asia Commercial Trust Investor Presentation dated 13 November 2026, with the mapletree pan asia commercial logo.
Photo mosaic band across the middle, title and orange subtitle bottom-left, logo top-right, teal corner swoosh.
Legal disclaimer stating the deck is for information only and should be read with the results for 1 April to 30 September 2026 announced via SGXNET on 30 October 2026. A QR code links to investor.mapletreepact.com/financial-results.html.
Full-width justified paragraphs under a title, QR code and link at bottom-left.
Agenda with page references: Overview (page 4), Financial Performance (9), Portfolio Highlights (18), Commitment to Sustainability (34), Our Long-Term Focus (37), Appendix 1 Portfolio Information (40) and Appendix 2 Market Information (52).
Bulleted agenda list with right-aligned page numbers over a decorative maple-leaf art background.
S$6.1 billion market capitalisation (at S$1.16 on 12 November 2026), 15 properties, 10.2 million sq ft lettable area and S$15.2 billion AUM. By country AUM is Singapore 61%, Hong Kong 22%, China 9%, Japan 6%, South Korea 1%; VivoCity and MBC are 27% each, and by asset class Retail is 49%, Office 22%, Business Parks 29%.
Four KPI tiles on top, flag list with percentages, two donut charts below, footnotes at the bottom.
15 properties across five markets: Singapore 4 (VivoCity, MBC, mTower, BOAHF), Hong Kong 1 (Festival Walk), China 2 (Gateway Plaza in Beijing, Sandhill Plaza in Shanghai), Japan 7 (four in Tokyo, three in Chiba) and South Korea 1 (The Pinnacle Gangnam).
Asia map with numbered orange pins and teal-headed property list boxes around it.
Mandate covers income-producing real estate used for office and/or retail, with geography including Singapore, China, Hong Kong, Japan and South Korea. The Sponsor, Mapletree Investments Pte Ltd, holds 56.0% and public unitholders 44.0% as at 12 November 2026; the Manager and Property Managers are 100% owned by the Sponsor.
Two panels: icon-led mandate text on the left, ownership flow chart on the right.
Management fees are a base fee of 10% of Distributable Income plus a performance fee of 25% of year-on-year growth in DPU, which the slide says aligns the Manager with unitholders and reflects strong Sponsor support.
Left box with the two fee components joined by a plus sign, arrow to a right box of three benefit statements with icons.
Timeline: listed on SGX-ST Main Board on 27 April 2011; 2013 raised S$225.0 million and acquired Mapletree Anson; 2016 raised S$1.04 billion and acquired MBC I; 2019 raised S$918.5 million and acquired MBC II; 2022 merged with Mapletree North Asia Commercial Trust; 2024 divested Mapletree Anson for S$775.0 million; 2025 divested TS Ikebukuro Building and ABAS Shin-Yokohama Building for S$78.7 million; 2026 divested the office component of Festival Walk for S$328.1 million.
Horizontal arrow timeline with eight year markers, photos above and event text below, map inset at right.
Section divider titled Financial Performance, over a photo of the fish sculpture at Mapletree Business City, SG.
Full-bleed photo with white title text and caption bottom-right.
Gross revenue S$207.5 million (down 5.0%), NPI S$153.5 million (down 6.3%), finance expenses S$42.6 million (down 10.1%), amount available for distribution S$103.1 million (down 2.9%) and DPU 1.94 cents versus 2.01 cents (down 3.5%). Singapore revenue rose 0.3% on VivoCity, while overseas contributions and divested assets weighed.
Left financial table with variance arrows, right column of commentary bullets, footnotes below.
Comparable gross revenue was S$210.5 million versus S$216.9 million, with VivoCity up 5.9% to S$66.0 million and NPI of S$155.8 million versus S$162.9 million, VivoCity up 5.0% to S$48.8 million. Core assets VivoCity and MBC were 58% of revenue and 60% of NPI.
Two stacked bar charts side by side comparing 2Q FY25/26 and 2Q FY26/27 with a colour legend.
Gross revenue S$413.9 million (down 5.3%), NPI S$308.3 million (down 6.5%), finance expenses S$83.4 million (down 14.4%), distributable amount S$207.3 million (down 2.7%) and DPU 3.90 cents versus 4.02 cents (down 3.0%). On a constant currency basis revenue and NPI would have been 4.9% and 6.4% lower.
Same table-plus-commentary layout as the quarterly slide.
1H comparable gross revenue S$419.9 million versus S$433.4 million, with VivoCity up 7.5% to S$131.6 million; NPI S$312.8 million versus S$327.5 million, VivoCity up 6.9% to S$98.2 million. By market, Singapore is 66% of revenue and 68% of NPI; core assets are 58% and 59%.
Two stacked bar charts with by-market flag percentage panels beside each.
As at 30 September 2026: total assets S$15,389.7 million, net borrowings S$5,772.2 million, net assets S$9,172.3 million, 5,291,445 thousand units and NAV per unit S$1.73, unchanged from 31 March 2026. The S$250 million perpetual securities were redeemed and S$200 million of fixed-rate notes issued in June 2026.
Two-column balance sheet table with highlighted totals.
Gross debt S$5,913.4 million, aggregate leverage 38.1% (37.7% at June 2026), ICR 3.3 times, all-in cost of debt 2.95%, fixed-rate debt 71.8%, average debt maturity 3.2 years and Moody's Baa2 (negative). Gross debt to net asset value is 64.5%.
Seven-row comparison table across three dates with seven footnotes.
Total gross debt S$5.9 billion with about S$0.6 billion available liquidity; ICR of 3.3x versus the 1.5x statutory limit (3.0x with a 10% EBITDA decline, 2.5x with a 100 bps rate rise). Debt is 61% SGD and 39% foreign, matching 61% Singapore and 39% overseas AUM. The maturity ladder runs from S$256 million in FY26/27 to S$1,323 million in FY29/30 and S$400 million in FY33/34.
Three rounded panels on top, full-width debt maturity bar chart with % of total debt row below.
About 72% of S$5.9 billion total gross debt is fixed or hedged and 28% floating; every 50 bps change in benchmark rates affects DPU by an estimated 0.14 cents per annum. About 94% of expected distributable income is in SGD or hedged into SGD (80% SGD, 15% hedged, 6% unhedged).
Two donut charts with supporting tables beneath each.
Section divider titled Portfolio Highlights, over a photo of Mapletree Business City, SG.
Full-bleed building photo with white title text.
Committed occupancy 85.6%, rental reversion 3.5% and tenant retention 74.0%. Renewed and re-let area was 479,613 sq ft in retail and 1,734,792 sq ft in office/business park. VivoCity tenant sales rose 4.1% and traffic 1.1%; Festival Walk tenant sales rose 3.9% and traffic 6.7%.
Translucent card over a photo with icon-led KPI blocks and two property sub-panels.
MPACT portfolio committed occupancy was 85.6% at 30 September 2026 (84.4% in June 2026; 88.9% a year earlier). MBC 95.4%, VivoCity 100.0%, other Singapore 95.4%, Festival Walk 99.9%, China 84.5%, Japan 57.5% and The Pinnacle Gangnam 99.9%.
Table with three date columns and a leasing update commentary column.
Portfolio rental reversion +3.5% on 231 leases, 74.0% retention and 1,292.5 thousand sq ft renewed or re-let. VivoCity +15.0%, MBC +1.4%, other Singapore +5.5%, Pinnacle Gangnam +32.7%, Japan +2.4%, Festival Walk -15.6% and China properties -29.9%.
Table by property with leases committed, retention rate, area and reversion columns.
WALE by gross monthly income at 30 September 2026 is 2.3 years for the portfolio, 1.9 years for retail and 2.7 years for office/business park. Retail expiries peak at 16.8% in FY27/28; office/business park is 13.5% in FY30/31 and beyond.
WALE summary box on top, clustered column chart of expiry by year below.
Singapore: 95.4% committed at both MBC and other Singapore properties, reversion +1.4% and +5.5%. China: 84.5% committed, retention 78.7%, reversion -29.9%. Japan: 57.5% committed, retention 70.6%, reversion +2.4%. South Korea: 99.9% committed, retention 55.4%, reversion +32.7%.
Four country cards in a 2x2 grid, each with KPIs and a small renewal column chart.
VivoCity: 100.0% committed, 73.3% retention, +15.0% reversion, 304 thousand sq ft renewed in FY26/27. Festival Walk: 99.9% committed, 56.7% retention, -15.6% reversion, 156 thousand sq ft renewed.
Two side-by-side cards with KPIs and small bar charts on a grey background.
Section divider titled VivoCity over a photo of a busy shopping concourse at VivoCity, SG.
Full-bleed motion-blurred crowd photo with title text.
1H FY26/27 tenant sales were S$540.5 million (up 4.1% from S$519.1 million) and shopper traffic 22.1 million (up 1.1% from 21.9 million). 2Q tenant sales rose 3.3% year on year. Footnote cites the Circle Line Stage 6 completion on 12 July 2026 and closure of HarbourFront Centre from 27 July 2026.
Two stacked column charts split into 1Q and 2Q with growth callouts.
Timeline from VivoCity's 2006 opening to the 2026 Circle Line loop, with seven AEIs each delivering at least 10% ROI: 1st about 25% on S$5.5 million, 2nd about 20% on S$5.7 million, 3rd about 29% on S$3.0 million, 4th over 10% on S$16.0 million, 5th about 40% on S$2.2 million, 6th over 20% on S$10.0 million and 7th over 10% on S$43.0 million.
Central teal timeline arrow with initiative cards above and below, ROI banners at the card bottoms.
New-to-mall concepts include Bake it Babe (L1), Bee Cheng Hiang (B2), Mister Mobile (L2) and Tissot (L1); refreshed stores include Burberry (L1), MUJI (L2), PUMA (L1) and Typo (L2). A note says this is only a subset of 2Q FY26/27 changes.
Two teal-headed rows of four captioned photos.
Sanrio Characters Moonlit Garden x TANGS Mid-Autumn Fair 2026 ran from 25 August to 27 September 2026, with Sky Park transformed by Sanrio installations and lanterns, mascot meet-and-greets, and extensive press and social media coverage.
Banner title with a two-photo top row and a larger photo plus press collage below.
Section divider titled Festival Walk over an atrium photo of Festival Walk, HK with mirrored escalators.
Full-bleed interior photo with white title text.
1H FY26/27 tenant sales were HK$1,761.9 million (up 3.9% from HK$1,696.4 million) and shopper traffic 16.6 million (up 6.7% from 15.6 million). 2Q tenant sales rose 3.7% alongside 10.3% traffic growth, helped by luxury spending and the space reconfiguration completed in July 2026.
Two stacked column charts split by quarter with growth callouts.
Tenant changes highlighted include ICBC (L1), So Gor Beef Brisket (G), Asics (L1) and Go Wild (L1, expanded and rejuvenated). A note says this covers only a subset of 2Q FY26/27 changes.
Two-by-two grid of large captioned storefront photos.
Events included a Winnie the Pooh 100th Year of Celebration pop-up, a Beware of Love stage comedy press conference, a Toei Animation 70th Anniversary pop-up, a Kalos Blocks x Coca-Cola pop-up and a Nintendo Switch 2 Yoshi event.
Five-photo mosaic with caption overlays.
Section divider titled Commitment to Sustainability over a landscaped garden photo at Mapletree Business City, SG.
Full-bleed green landscape photo with white title.
Twelve material topics mapped to UN SDGs, grouped into four pillars. Targets include a 78.5% reduction in Scope 1 and 2 carbon intensity by 2035 versus the FY23/24 baseline, 50% renewable electricity adoption by 2030, 60% of occupied area on green leases by 2030, and 100% green-certified portfolio.
Four coloured pillar columns with numbered topics and SDG icons, targets row beneath.
Four-step climate roadmap: foundation and pathway development, stakeholder engagement, decarbonisation levers, compensate and neutralise. The 2026 GRESB Real Estate Assessment named MPACT Sector Leader in three categories and improved its Five-Star rating; the Public Disclosure rating stayed at Level A.
Four chevron roadmap steps on top, GRESB results panel and community event photos below.
Section divider titled Our Long-Term Focus over a photo of Mapletree Business City, SG.
Full-bleed building photo with white title text.
Outlook cites geopolitical tension, higher energy costs and rising rates. Singapore is 61% of AUM and 68% of NPI, with MBC lease commencements from 3Q FY26/27; overseas leasing prioritises occupancy; finance cost savings should keep cushioning headwinds, though scope has narrowed as rates rise.
Operating environment banner, three teal columns (Singapore, Overseas, Capital Management), closing strategy banner.
Closing slide with investor relations contacts Teng Li Yeng (+65 6377 6111) and Cassandra Seet (+65 6807 4064), both Investor Relations and Sustainability at Mapletree.
Photo strip of five properties, large Thank You and two contact blocks right-aligned.
Divider for Appendix 1: Portfolio Information over a photo of the ice rink at Festival Walk, HK.
Full-bleed interior photo with white title text.
Top ten tenants contributed 21.4% of gross rental income at 31 March 2026, excluding one undisclosed tenant. Google Asia Pacific (MBC) is 6.2%, BMW (Gateway Plaza) 3.3%, Merrill Lynch Global Services (BOAHF) 2.0%, then TaSTe, Hewlett-Packard Japan and IMDA at 1.7% each.
Ranked ten-row table with tenant, property and income share columns.
Trade mix by gross rental income at 31 March 2026: F&B 17.2%, IT Services and Consultancy 14.3%, Fashion 7.8%, Banking and Financial Services 6.2%, Departmental Store/Supermarket 5.3%, with Others at 6.9%, totalling 100.0%.
Twenty-row table with sector label column.
Portfolio valuation was S$15,211.1 million versus S$15,536.0 million (down 2.1%). Singapore rose S$278.0 million (3.1%) to S$9,291.0 million while overseas fell S$602.9 million to S$5,920.1 million, with S$301.1 million from forex; excluding forex the total fell S$23.7 million (0.2%).
Three KPI cards above a valuation, valuation impact and FX impact table.
VivoCity S$4,062.0 million (up 5.4%, cap rate 4.40%), MBC I S$2,372.0 million, MBC II S$1,670.0 million, mTower S$827.0 million (up 4.2%) and BOAHF S$360.0 million (up 2.9%); Singapore total S$9,291.0 million, up 3.1%.
Property table with valuation, variance, per sq ft and capitalisation rate columns.
Festival Walk HK$20,700 million (S$3,387.1 million, down 4.9% local), Gateway Plaza RMB5,290 million (S$982.6 million), Sandhill Plaza RMB2,070 million (S$384.5 million), Japan properties JPY117,620 million (S$944.9 million) and The Pinnacle Gangnam KRW258,050 million (S$221.0 million). Overseas total S$5,920.1 million.
Wide table with local currency and S$ valuations, variance, FX impact and cap rate columns, seven footnotes.
VivoCity at 1 HarbourFront Walk has 1,082,644 sq ft and 2,183 carpark lots (valuation S$4,062.0 million). MBC I and II combined have 2,885,678 sq ft and 2,001 lots (S$2,372.0 million and S$1,670.0 million); certifications include BCA Green Mark Platinum.
Three property photos above a spec table with address, title, area, valuation, certifications and tenants.
mTower at 460 Alexandra Road has 523,582 sq ft, 749 carpark lots and a S$827.0 million valuation. Bank of America HarbourFront (BOAHF) at 2 HarbourFront Place has 215,963 sq ft, 94 lots and S$360.0 million.
Two property photos above a two-column spec table.
Festival Walk: 588,890 sq ft, 830 lots, HK$20,700.0 million. Gateway Plaza, Beijing: 1,145,896 sq ft, RMB5,290.0 million. Sandhill Plaza, Shanghai: 683,115 sq ft, RMB2,070.0 million. The Pinnacle Gangnam, Seoul: 478,461 sq ft at 100% (50% interest), KRW258,050.0 million, freehold.
Four property photos above a four-column spec table.
Hewlett-Packard Japan Headquarters Building: 457,426 sq ft, JPY40,900 million (S$328.6 million). IXINAL Monzen-nakacho Building: 73,753 sq ft, JPY8,540 million. Omori Prime Building: 73,168 sq ft, JPY7,670 million. All freehold offices acquired in 2022 with CASBEE ratings.
Three photos above a three-column spec table.
Higashi-nihonbashi 1-chome Building 27,996 sq ft (JPY2,800 million), mBAY POINT Makuhari 923,077 sq ft (JPY33,000 million), Fujitsu Makuhari Building 657,549 sq ft (JPY9,910 million; reduced to 329,023 sq ft after Fujitsu's departure) and Makuhari Bay Tower 402,444 sq ft (JPY14,800 million).
Four photos above a four-column spec table with footnotes.
At 9 September 2026 by type: Sponsor and related parties 56%, retail investors 21%, institutional holders 21%, others 2%. Institutional investors by region: North America 30%, Singapore 28%, Asia excluding Singapore 22%, United Kingdom 11%, Europe 9%, Rest of the World 0.02%.
Two donut charts side by side with footnotes below.
Divider for Appendix 2: Market Information over the Festival Walk atrium photo.
Full-bleed photo with a semi-transparent text box and title.
Orchard average rent S$38.10 per sq ft per month (up 0.3% qoq) at 92.8% occupancy; suburban S$21.00 (down 0.1%) at 95.3%. Singapore GDP grew 5.4% yoy in 3Q 2026; retail sales excluding motor vehicles rose 1.5% yoy in July to August 2026. Source is Colliers (27 October 2026).
Map at left with bullets, rent and occupancy tiles and commentary on the right.
Two tables of planned retail supply for 2026 to 2028 by submarket, including Bukit V (173.4 thousand sq ft, 2027), Golden Mile Redevelopment (114.4, 2027), Marine Parade Underground Mall (99.8, 2026) and One Sophia (82.7, 2028).
Two side-by-side tables with submarket, property, area and expected completion.
Monthly retail sales excluding motor vehicles from July 2022 to August 2026, roughly S$3.1 to 4.4 billion a month, with online share about 12.6% to 19.5%. Headline says July to August 2026 sales rose 1.5% yoy. Individual labels are small; source is Singapore Department of Statistics.
Single combo chart of bars and a line, with year-on-year change row beneath.
International visitor arrivals: 19.1 million (2019), 2.7 (2020), 0.3 (2021), 6.3 (2022), 13.6 (2023), 16.5 (2024), 16.9 (2025) and 12.7 million for the first nine months of 2026. Arrivals fell 1.8% yoy in July to September and 1.7% over nine months.
Single column chart with year labels.
Islandwide average rent S$7.03 per sq ft per month (up 1.9% qoq) and occupancy 89.0% (down 0.2 p.p.). CBD rents rose 1.9% to S$12.23 and City Fringe 0.4% to S$8.24. About 2.7 million sq ft of new space is expected from the rest of 2026 to 2028.
District map with insets at left, rent and occupancy tiles and bullets at right.
Planned 2026 to 2028 supply includes Solitaire On Cecil (197.0 thousand sq ft, 2026), Newport Tower (220.0, 2027), The Skywaters (745.0, 2028), Clifford Centre (345.0, 2028) and One Comcentre (809.0, 2028).
Single table of submarket, property, area and expected completion.
Central Region business park rent is S$4.50 per sq ft per month (down 4.3% qoq) and occupancy 89.0% (up 3.7 p.p.). The planned new supply table is empty, and the text says modern, well-located parks should be more resilient.
Cluster map at left, empty supply table and rent and occupancy tiles at right, bullets beside.
Kowloon East rent is HK$255 per sq ft per month (up 0.4% qoq), occupancy 85.9%. Visitor arrivals rose 12% yoy in January to September 2026; retail sales rose 5.1% in July to August. Around 1.0 million sq ft of retail space is due for the rest of 2026, with 1.9 million sq ft more in 2027 to 2028.
Map at left with bullets, tiles and commentary at right.
Planned 2026 to 2028 supply includes XRL Terminus retail portion (602.8 thousand sq ft, 2026), The KEyPoint (300.0, 2026), IL 9088 Central Harbourfront Site 3A (340.0, 2027) and 35 Clear Water Bay Road (575.9, 2028).
Single twelve-row table.
Monthly retail sales July 2022 to August 2026, roughly HK$28 to 37 billion, with online share about 6 to 14.6%. The headline says sales rose 5.1% yoy in July to August and 8.5% in January to August 2026. Source is Hong Kong Census and Statistics Department.
Single combo chart of purple bars and a green line with YoY row.
Arrivals of 55,913 thousand in 2019, 49,895 thousand in 2025 and 40,704 thousand over nine months of 2026 (31,900 mainland). Arrivals rose 9.0% yoy to 14.0 million in July to September and 11.6% over nine months.
Stacked column chart of mainland versus other visitors.
Lufthansa (Grade A) rent is RMB179.2 per sq m per month (down 6.9% qoq) and occupancy 72.7%. Beijing overall occupancy fell 2.2 p.p. to 80.3% in 3Q 2026 and China's GDP grew 4.5% yoy. About 0.7 million sq m of new supply is expected to 2028.
District map and bullets at left, tiles and commentary at right.
Planned supply includes Maoyuan Yao Zone (38.0 thousand sq m, 4Q 2026), Zhongyang Plaza (78.0, 4Q 2026), Digital Financial Technology Demonstration Park (213.3, 2027) and Dajia Life Building (117.2, 3Q 2028).
Single nine-row table.
Zhangjiang rent is RMB3.40 per sq m per day (down 0.5% qoq) and occupancy 67.3% (up 1.2 p.p.). Shanghai business park occupancy rose to 70.5% in 3Q 2026 and overall rents fell 5.6% yoy. About 2.8 million sq m of new supply is projected to 2028.
Map at left with bullets, tiles and commentary at right.
Two long tables list planned supply by submarket, including Golden Valley WK14-4 Qingtian (390.0 thousand sq m, 2028), Zhangjiang Middle Zone Plot 41-13 (275.5, 2027) and Shanghai Riverfront Harbor B-3-10 (155.0, 4Q 2026).
Two side-by-side dense tables.
Tokyo 18 wards rent is JPY21,623 per tsubo per month (up 1.2% qoq) at 96.8% occupancy; Chiba JPY12,742 (up 3.1%) at 91.2%. Tokyo Central 5 wards occupancy rose 0.4 p.p. to 98.3%. Makuhari occupancy remains soft.
Map at left, supply table and rent and occupancy tiles at right, commentary below.
GBD rent is KRW145,898 per pyeong per day (up 3.9% qoq) and occupancy 98.0% (down 0.5 p.p.). Seoul office occupancy rose to 95.9% and South Korea's GDP grew 3.4% yoy in 3Q 2026. About 0.5 million pyeong of supply is projected to 2028, 94% in the CBD and GBD.
Schematic Seoul map with district callouts and bullets at left, tiles and commentary at right.
Planned supply (million pyeong) for 2026 to 2028, mostly CBD projects at 0.01 to 0.07 each; the largest is KDIC Seocho Development Project in the GBD at 0.11, expected 1Q 2028.
Single nineteen-row table.
Common questions about this slide and the underlying presentation content.
It is dated 13 November 2026 and built around MPACT's second quarter and first half results of FY26/27, covering 1 April to 30 September 2026. MPACT's financial year starts in April, so 2Q FY26/27 means July to September 2026. It is separate from the 2Q FY26/27 results presentation released on 30 October 2026.
2Q FY26/27 gross revenue was S$207.5 million and NPI S$153.5 million, with DPU of 1.94 Singapore cents versus 2.01 cents. 1H DPU was 3.90 cents. NAV per unit was S$1.73, aggregate leverage 38.1%, committed occupancy 85.6% and rental reversion +3.5%. Amounts are in S$ (Singapore dollars).
It was lodged with SGX (Singapore Exchange) as a general announcement by the Manager of MPACT (SGX: N2IU). Singapore-listed REITs report on a half-yearly basis, so this November deck follows the half-year results announced on 30 October 2026 and gives investors a fuller picture than the results release alone.
The deck has 70 pages: Overview (pages 4 to 8), Financial Performance (9 to 17), Portfolio Highlights (18 to 33), Commitment to Sustainability (34 to 36), Our Long-Term Focus (37 to 39), Appendix 1 Portfolio Information (40 to 51) and Appendix 2 Market Information (52 to 70).
MPACT has 15 properties: VivoCity, Mapletree Business City (MBC I and II), mTower and Bank of America HarbourFront in Singapore; Festival Walk in Hong Kong; Gateway Plaza in Beijing and Sandhill Plaza in Shanghai; seven properties in Greater Tokyo; and The Pinnacle Gangnam in Seoul.
Gross debt was S$5,913.4 million at 30 September 2026 with 38.1% leverage, 3.3 times interest coverage, 2.95% all-in cost of debt, 71.8% fixed-rate debt and a Moody's Baa2 (negative) rating. About 72% of debt is fixed or hedged, and about 94% of expected distributable income is in SGD or hedged into SGD.
Yes, the deck can be downloaded from this page as PDF or PPTX subject to the page's download options. Always verify figures against MPACT's official SGX announcement, since the deck is a public disclosure of the Manager and its content is not investment advice.
Yes. The deck is a good example of a roadshow-length structure: overview, financial tables, debt and hedging, leasing KPIs, asset-level fact sheets, ESG and market appendices. Replace the MPACT content with your own figures and keep the consistent KPI tile, table and chart layouts.

Create Your Own Slides
Turn your ideas into professional presentations in seconds with 2slides AI.
Reference professional designs, choose your style, and generate slides with perfect text rendering. Powered by Nano Banana—start creating your presentation now.
Your AI Agent for slides. Save time, shine faster with intelligent presentation creation.


© 2026 2slides. All rights reserved.