
Part of Investor presentation examples
Mapletree Logistics Trust Investor Presentation November 2026: a 32-page Singapore REIT deck, lodged with SGX on 10 November 2026, covering the 2Q FY26/27 results (three months to 30 September 2026) plus portfolio, capital management, sustainability and outlook.
Uses this deck’s cover as a style reference for slides made from your own content. Or pick any page below to use its layout as the reference.
Quick Navigation
Tags
Share the slides
Mapletree Logistics Trust Investor Presentation November 2026: a 32-page Singapore REIT deck, lodged with SGX on 10 November 2026, covering the 2Q FY26/27 results (three months to 30 September 2026) plus portfolio, capital management, sustainability and outlook.
Detailed view of each slide page, including layout, key content and visual elements.
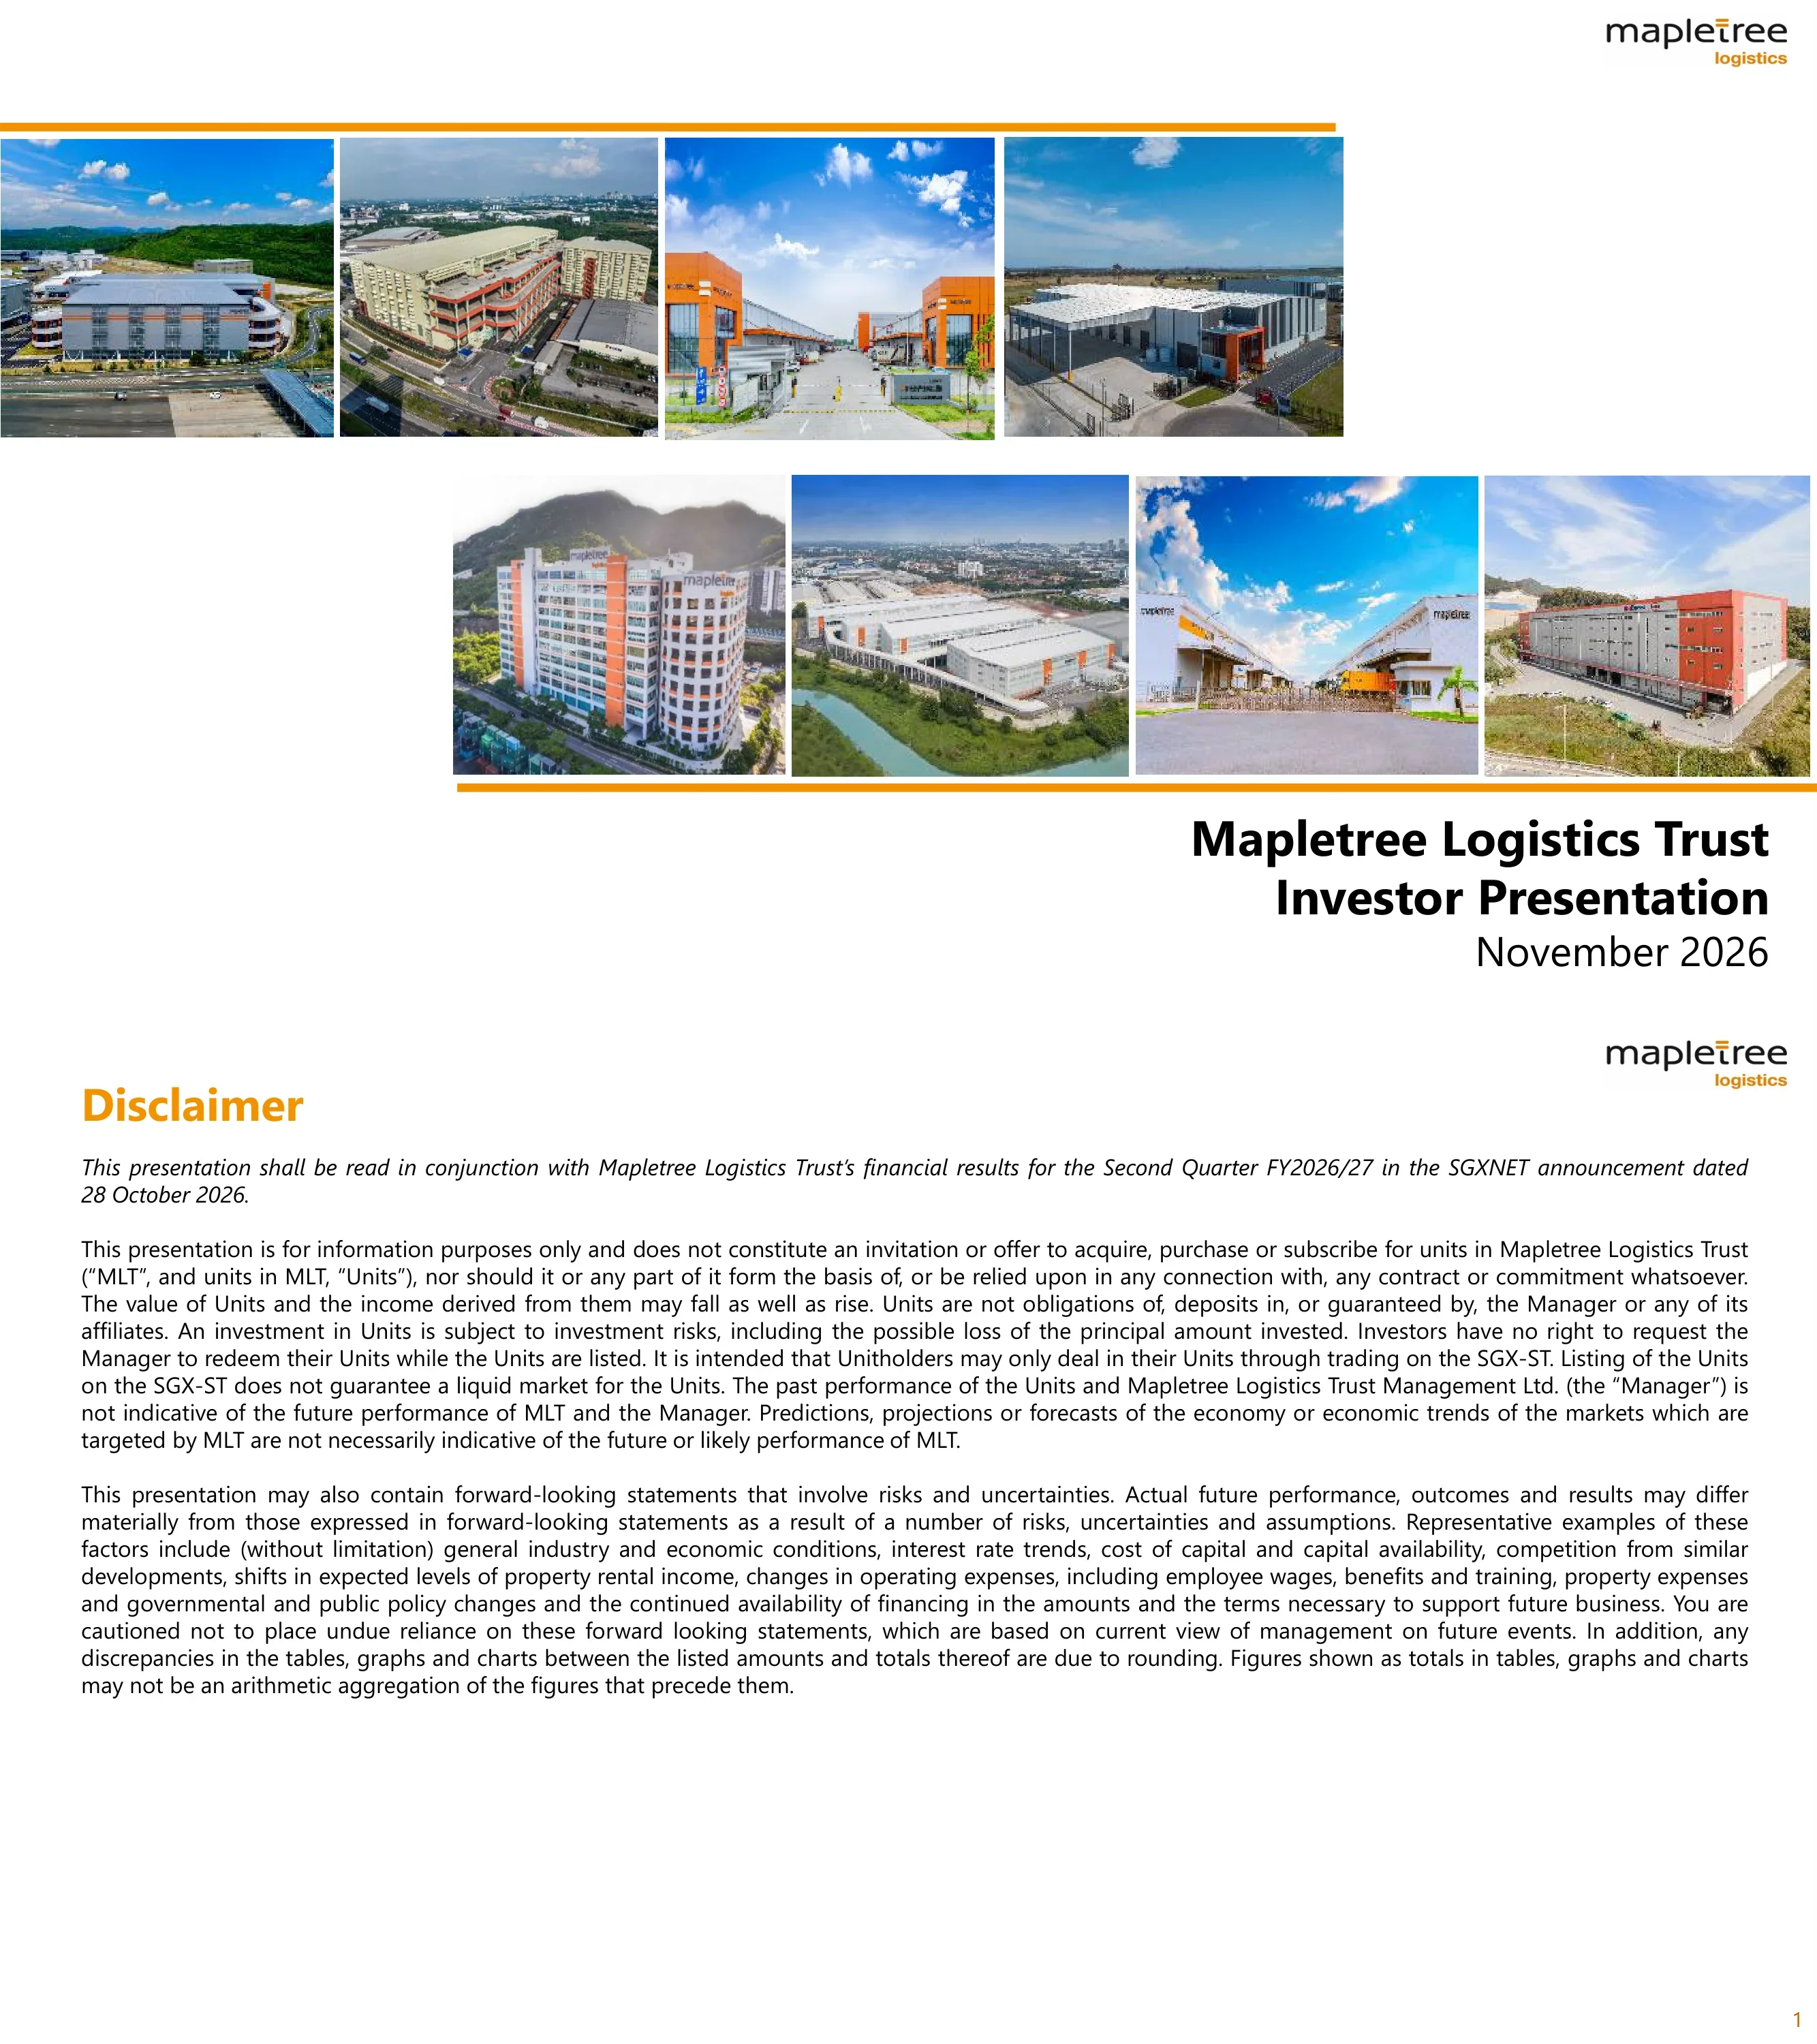
Title slide of Mapletree Logistics Trust (MLT) 'Investor Presentation, November 2026'.
Full-width logistics-site photo with the title and Mapletree logo.
States the presentation should be read with MLT's 2Q FY2026/27 results announcement on SGXNET dated 28 October 2026. Standard REIT disclaimer on unit value, investment risk and forward-looking statements.
Text-only page of dense paragraphs.
Section divider with a photo of Mapletree Logistics Hub - Tanjung Pelepas, Malaysia.
Full-bleed photo with section title overlay.
MLT is the first Asia Pacific focused logistics REIT in Singapore: 172 properties in nine markets, ~8.1 million sqm GFA, ~2.5 years WALE by NLA and S$13.1 billion (S$, Singapore dollars) assets under management as at 30 September 2026. Property counts: Singapore 43, China 40, Japan 22, South Korea 20, Australia 13, Vietnam 12, Hong Kong SAR 9, Malaysia 9, India (small).
Left text and KPI tiles; right Asia Pacific map with country counts and key cities plus sea-route overlays.
Structure chart: Sponsor Mapletree Investments Pte Ltd holds 27.3% of units; other unitholders 72.7%. Manager, Trustee (HSBC Institutional Trust Services) and Property Manager relationships with fee flows. Distribution policy is at least 90% of taxable income, paid quarterly.
Structure diagram of arrows linking Sponsor, Unitholders, Manager, Trustee, Property Manager and property portfolio, with a pie of ownership.
Two decades of growth: AUM from S$0.4 billion in 2005 to S$13.1 billion by FY25/26, NAV per unit S$0.56 to S$1.26, NLA 0.8m to 8.2m sqm, occupancy at or above 95%, total return ~6.8% per annum over 20 years. Phases 2005-2010 to 2021-2025 with acquisition and divestment totals (e.g. 2021-2025 acquisitions S$3,092M, divestments S$469M).
Timeline of five phases with bullet notes plus a KPI column comparing 2005 with FY25/26.
Strategy: portfolio rejuvenation through accretive acquisitions, strategic asset enhancements and selective divestments. Target mix 65-70% developed markets and 30-35% emerging markets; ~S$1bn of properties identified for divestment (over S$500m executed per the page); sponsor pipeline in India, Vietnam, Malaysia and Australia.
Strategy framework: top pillars, three columns for acquisitions, enhancements and divestments with bullets.
To date MLT has executed over S$1.4 billion of divestments at an average premium to valuation of 20%. The page lists divested properties by market, mainly Singapore, Japan, Malaysia and China.
Collage of property photos with a long list of property names around a central headline.
Divestments of ~S$243 million executed in FY26/27 at an average 3.1% premium to valuation, across six transactions (China sales to the RMB Fund and third parties, 39 Changi South Avenue 2 for S$16.6m, a Derrimut Australia site for AUD28.0m, two Hong Kong strata units). Four-step capital recycling loop and valuation footnotes.
Top four-step process banner, a transaction table with buyer, area, agreed value and valuation, and small footnotes.
Case studies of redevelopments of older assets into modern ramp-up facilities with before/after photos: Benoi (GFA up 4x, S$122 mil), Toh Guan (2.7x, S$95 mil), Pioneer (1.8x, S$90 mil), Ouluo Shanghai (2.3x, S$205 mil) and Joo Koon.
Grid of before/after photo pairs, each with GFA uplift and cost labels.
Changi South redevelopment: two mature assets become a 5-storey ramp-up facility, GFA up 34% to 499,666 sf, estimated cost ~S$141m, construction from 1Q 2027 to 2Q 2029. Singapore is the largest market at over 30% of gross revenue; targets Green Mark Super Low Energy.
Left bullet text with sustainability sub-section; right artist's impression renderings.
Section divider for the quarter's highlights (photo of Tanjung Pelepas hub, Malaysia).
Full-bleed photo with section title.
3 months to 30 Sep 2026: gross revenue S$180.0m (+1.4% y-o-y), NPI S$154.8m (+1.0%), DPU 1.816 cents (+0.1%). Occupancy 96.4%, WALE 2.5 years, rental reversion +2.1% (+4.2% ex China), aggregate leverage 37.5%, 90% of debt hedged to fixed rates, average cost of debt 2.7%, 74% of income hedged. Also a S$400m 3.5% perpetual securities issue and CNY500m 2.1% RMB bond.
Three KPI panels (financial, operating, capital management) with large figures and delta captions plus two bullet columns.
Table (S$'000): gross revenue 180,000 vs 177,471 (+1.4%); property expenses 25,215 (+4.4%); NPI 154,785 (+1.0%); borrowing costs 38,588; amount distributable 100,952 (+2.8%); DPU 1.816 vs 1.815 cents. Commentary explains drivers.
Financial table at left with variance column and commentary bullets at right.
Six months to 30 Sep 2026: gross revenue 358,892 (+1.1%), NPI 311,203 (+1.5%), amount distributable 199,577 (+1.9%), DPU 3.632 cents vs 3.627 (+0.1%), in S$'000.
Financial table and commentary bullets.
Gross revenue 180,000 vs 178,892 (+0.6%); property expenses +12.2%; NPI 154,785 vs 156,418 (-1.0%); DPU unchanged at 1.816 cents. Notes on property taxes and utility adjustments.
Financial table with commentary bullets.
As at 30 Sep 2026: total assets S$13,841m, total debt S$5,125m, net assets S$6,524m, NAV per unit S$1.27, leverage 37.5% (40.5% at 30 Jun), borrowing cost 2.7%, debt duration 3.4 years, ICR 2.9x, Fitch BBB+ stable. Net debt fell S$389m q-o-q.
Left balance sheet table and ICR sensitivity row; right commentary on leverage and cost.
Ample liquidity: S$1,152 million of committed credit facilities to refinance FY26/27 debt. Currency mix: JPY 28%, RMB 25%, SGD 13%, KRW 11%, HKD 10%, MYR 8%, AUD 4%, USD 1%. Average debt duration 3.4 years.
Left currency breakdown list, right stacked maturity bar chart by facility type.
About 90% of debt is hedged or fixed rate (pro forma 83% excluding timing effect), ~74% of amount distributable in the next 12 months hedged into or derived in SGD. Notes on perpetual securities timing.
Charts for hedged vs unhedged debt and income by currency, with bullet takeaways.
Developed markets anchor ~70% of AUM and revenue. AUM S$13.1 billion: Singapore 20.9%, Hong Kong SAR 22.0%, China 17.6%, Japan 13.7%, South Korea 8.3%, Australia 7.7%, Malaysia 5.7%, Vietnam 3.0%, India 1.1%. 1H FY26/27 revenue S$358.9m: Singapore 31.4%, HK 16.6%, China 14.4%, Japan 10.8%.
Two donut charts side by side with a shared central country legend.
985 customers; top 10 tenants account for 19.9% of gross revenue (Equinix 3.8%, CWT 3.6%, Coles 2.3% and others). About 85% of revenue from domestic distribution and 15% exports. Trade sector breakdown by revenue in Sept 2026.
Tenant sector icons with percentages and a top-10 tenant logo strip.
Portfolio occupancy 96.4% at Sept-26 (e.g. Singapore 99.4%, Hong Kong SAR 94.4%, India 85.3%). Lease expiry by NLA: FY26/27 15.9%, FY27/28 34.0%, FY28/29 20.4%, FY29/30 10.8%, FY30/31 3.3%, beyond 15.6%, split into single-user and multi-tenanted.
Stacked bar chart of expiries and a market occupancy strip.
Section divider with a photo of rooftop solar panels at Mapletree Joo Koon Logistics Hub, Singapore.
Full-bleed photo with title.
Green and sustainable financing S$1.5 billion (~28% of borrowings); green leases 70% of portfolio NLA in FY26/27 YTD (64% in FY25/26); solar capacity 132.9 MWp heading to 150 MWp by 2030; 79 green-certified assets covering 5.2m sqm (67% of GFA); carbon neutrality for Scope 1 and 2 by 2030.
Four themed panels with bullets and small charts of solar and certification growth.
Section divider with photo of Mapletree Logistics Hub Tsing Yi, Hong Kong SAR.
Full-bleed photo with title.
Uncertain global outlook with higher-for-longer rates and currency volatility; developed markets over 70% of value and revenue; about 85% of revenue from domestic consumption. Priorities: occupancy and cost efficiency, continued rejuvenation, hedging.
Three columns of bullets with headings.
Closing slide with photo of Mapletree Shah Alam Logistics Park, Malaysia.
Full-bleed photo with Thank You title.
Appendix divider with photo of Coles Chilled Distribution Centre, Australia.
Full-bleed photo with title.
Sponsor (MIPL) pipeline: completed projects total 3,471,900 sqm GFA (China 2,691,433, Vietnam 435,253, India 233,243, Australia 111,971); projects underway total 1,430,840 sqm (Malaysia 676,270, India 326,257, Hong Kong 227,836, Vietnam 110,477, Australia 90,000).
Two tables of completed and underway projects by country with GFA.
2Q FY26/27 portfolio rental reversion +2.1% (+4.2% ex China); China -1.7% versus -3.0% a year earlier. By market: Singapore 5.3%, South Korea 6.3%, Vietnam 5.3%, Japan 1.8%, Malaysia 2.8%, India 3.3%, Hong Kong 0.5%. Includes JLL market updates by country.
Table of reversions by market for two quarters beside market-update bullets.
Portfolio lease expiry by NLA: FY26/27 15.9%, FY27/28 34.0%, FY28/29 20.4%, FY29/30 10.8%, FY30/31 3.3%, beyond 15.6%, with each year split by nine markets. Detailed segment labels are small.
Stacked column chart with many small data labels and a legend by market.
Underlying land lease (by NLA): up to 30 years 23.8% (55 assets), 31-60 years 45.4% (50), over 60 years 5.9% (9), freehold 24.9% (58). Weighted average remaining leasehold term 36.7 years.
Stacked columns by remaining years and market, with summary table above.
Common questions about this slide and the underlying presentation content.
32 pages: overview, strategy, divestments and redevelopments, 2Q FY26/27 highlights and financial tables, capital management, portfolio and tenant diversification, sustainability, outlook and an appendix.
MLT's fiscal year starts in April, so 2Q FY26/27 is July to September 2026, with 1H FY26/27 covering April to September 2026.
For 2Q FY26/27: gross revenue S$180.0m (+1.4%), NPI S$154.8m (+1.0%), DPU 1.816 cents (+0.1%), occupancy 96.4%, aggregate leverage 37.5%.
It is Mapletree Logistics Trust's investor presentation lodged with SGX on 10 November 2026, to be read with its results announcement on SGXNET dated 28 October 2026.
Singapore listed companies report half-yearly; REITs like MLT still publish quarterly updates, and this deck covers the 2Q and 1H results. Q1/Q3 updates from other SGX companies are business updates.
Yes, the gallery page offers downloads. Review the original source terms before reuse.
Yes. The KPI summary, financial tables, donut charts and divider layouts adapt easily to other REITs or property companies.
Most are. The lease expiry by geography and land lease charts use very small labels, so check the original for detailed values.

Create Your Own Slides
Turn your ideas into professional presentations in seconds with 2slides AI.
Reference professional designs, choose your style, and generate slides with perfect text rendering. Powered by Nano Banana—start creating your presentation now.
Your AI Agent for slides. Save time, shine faster with intelligent presentation creation.


© 2026 2slides. All rights reserved.