
Part of Investor presentation examples · Indian investor presentation examples
Lupin Q2 FY27 Earnings Presentation: Lupin Limited's (NSE: LUPIN, BSE: 500257) investor presentation for the quarter ended 30 September 2026 (Q2 of fiscal year 2027, which runs April 2026 to March 2027), dated November 4, 2026 and filed with BSE/NSE. The 20-slide deck reports net sales of INR 77,855 million (+14% YoY), EBITDA of INR 19,574 million at a 25.1% margin (-8% YoY) and net income of INR 11,553 million (-22% YoY), with regional breakdowns for India, North America, EMEA, APAC, LATAM, ROW and API, plus strategy, R&D, quality, sustainability and ESG updates.
Uses this deck’s cover as a style reference for slides made from your own content. Or pick any page below to use its layout as the reference.
Quick Navigation
Tags
Share the slides
Lupin Q2 FY27 Earnings Presentation: Lupin Limited's (NSE: LUPIN, BSE: 500257) investor presentation for the quarter ended 30 September 2026 (Q2 of fiscal year 2027, which runs April 2026 to March 2027), dated November 4, 2026 and filed with BSE/NSE. The 20-slide deck reports net sales of INR 77,855 million (+14% YoY), EBITDA of INR 19,574 million at a 25.1% margin (-8% YoY) and net income of INR 11,553 million (-22% YoY), with regional breakdowns for India, North America, EMEA, APAC, LATAM, ROW and API, plus strategy, R&D, quality, sustainability and ESG updates.
Detailed view of each slide page, including layout, key content and visual elements.
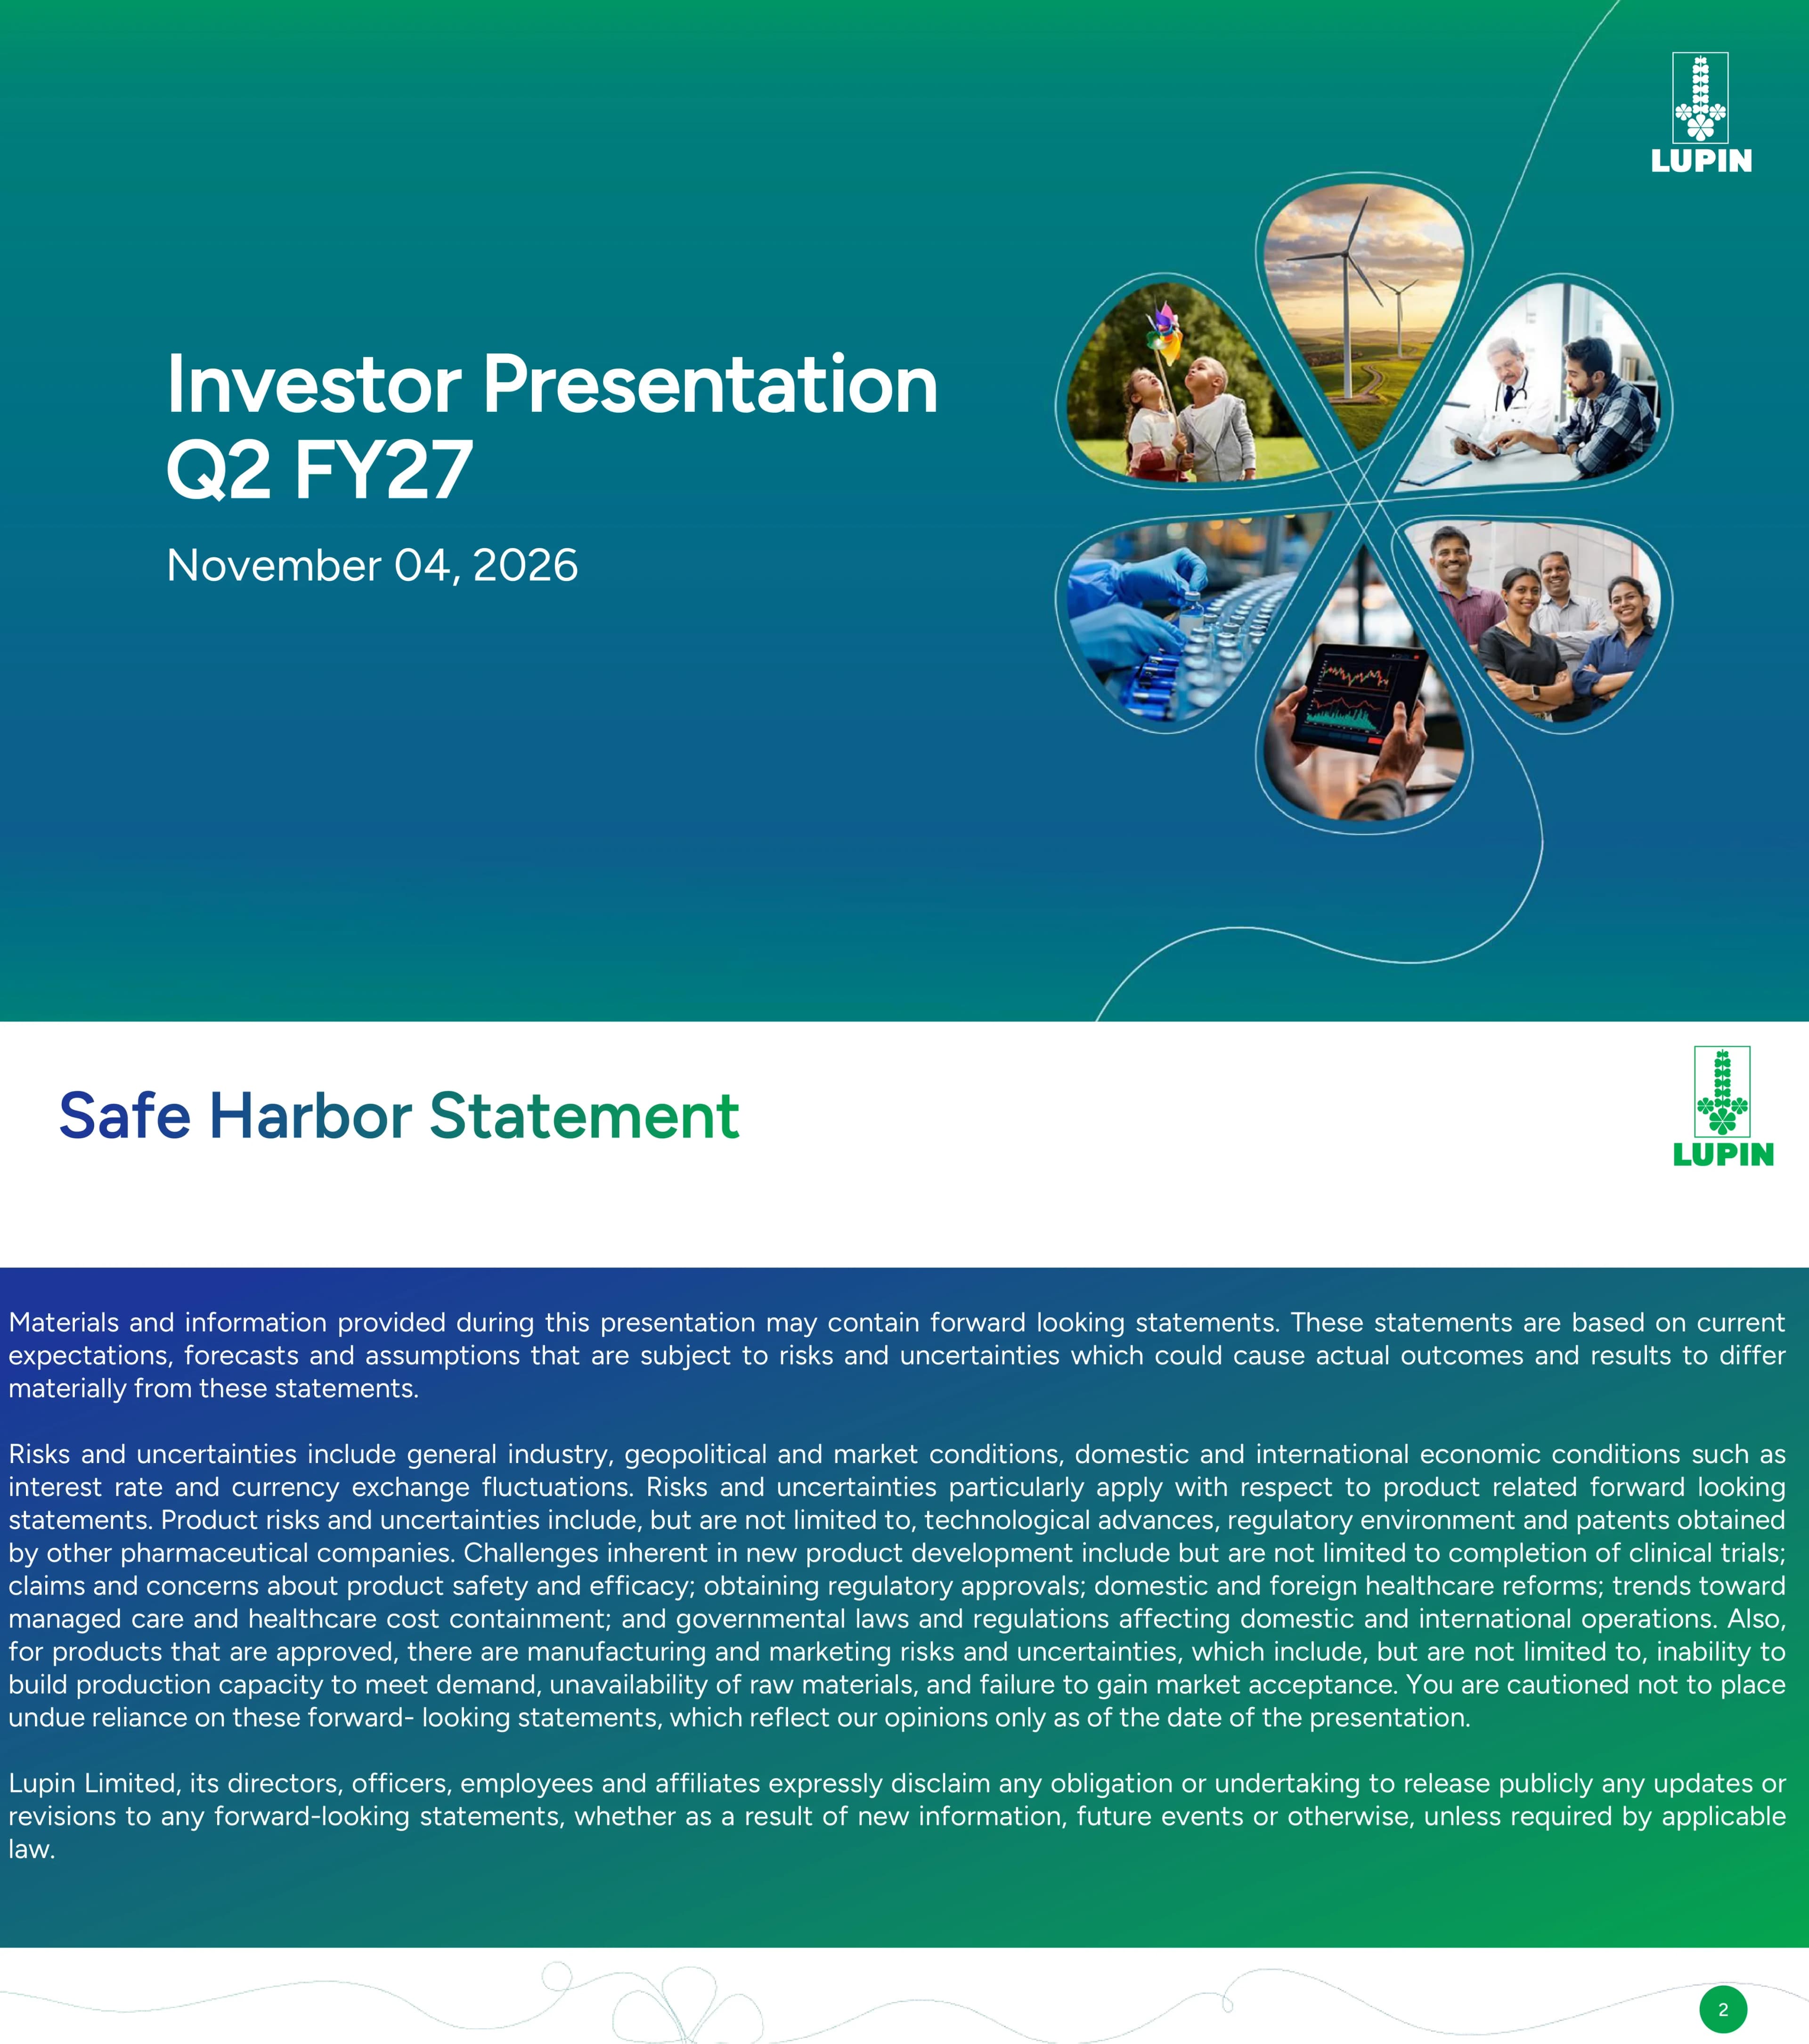
Cover slide titled 'Investor Presentation Q2 FY27', dated November 04, 2026, with the Lupin logo.
Full-bleed green-to-blue gradient background; large white title and date on the left; five-petal flower collage of photos (children with pinwheel, wind turbines, doctor and patient, vial production line, tablet with charts, team photo) on the right; logo top right.
Forward-looking statements disclaimer: results may differ due to industry, geopolitical, market, interest rate and currency conditions, product development, clinical trial, regulatory approval, healthcare reform and manufacturing risks; Lupin Limited disclaims any obligation to update forward-looking statements unless required by law.
Heading at top left with logo top right; full-width blue-to-green gradient band containing three justified paragraphs of white text; decorative line art footer with page number.
Section divider introducing the Q2 FY27 performance section.
Diagonal split layout: black-and-white office photo of two professionals reviewing documents on the left, blue-green gradient panel with white section title on the right.
Key metrics (values in INR): sales INR 77,855 mn (+14% YoY); EBITDA INR 19,574 mn (-8% YoY, 25.1% margin); net income INR 11,553 mn (-22% YoY, 14.8% margin, after adjusting NCI stake from PAT). Business performance: India INR 23,836 mn (+15% YoY), North America INR 31,696 mn (+10%), EMEA INR 9,913 mn (+40%), APAC INR 4,273 mn (+43%), LATAM INR 2,427 mn (-30%), ROW INR 2,624 mn (-4%), API INR 3,086 mn (+20%). Footnote: EBITDA margin excludes forex and other income, on net sales as base.
Two-column dashboard: left column of three dark-blue KPI cards with icons (sales, EBITDA, net income) and margin sub-panels; right side 'Business Performance' grid of seven regions, each with flag/globe icon, value and green up or red down YoY arrow.
Sales (excluding other operating income) and EBITDA margin trajectory: Q2 FY26 INR 68,314 mn / 31.3%, Q3 FY26 71,005 / 31.1%, Q4 FY26 73,919 / 29.4%, Q1 FY27 82,172 / 30.0%, Q2 FY27 77,855 / 25.1%. Key launches/approvals: US FDA tentative approval for Apixaban Oral Suspension 505(b)(2); Sugammadex Injection launched in the US. Business development: partnership with Tenpoint Therapeutics to commercialize YUVEZZI across the EU, UK, Switzerland, Norway and Iceland; MAA received for Ranibizumab in the UK and Australia; launched Formoflo-G MDI in India (described as the world's first fixed-dose triple combination inhaler for COPD); spin-out of two oncology programs to Kaveri Therapeutics; supply of developmental batches under a CDMO tech transfer deal. Compliance: Ankleshwar and Somerset EIR received with VAI status; Pithampur Unit II (OAI) response submitted, remediation in progress; Mandideep Unit I approval from ANVISA (Brazil); Tarapur WHO approval.
Split layout: left 'Financials' panel with a combined bar chart (sales) and line (EBITDA margin) over five quarters, latest bar highlighted green; right side stacked sections — two launch tiles (blue and green with grey captions), a rounded bullet box for business development, and two compliance columns (U.S. FDA / Others).
Sales mix (INR mn): United States 30,202 (39%, includes IP income), India 23,836 (31%), Other Developed Markets 11,823 (15%; Canada, Australia, Europe and others), Emerging Markets 8,908 (11%; LATAM, South Africa, Philippines and RoW), API 3,086 (4%). Key financials (INR mn) Q2 FY27 / Q2 FY26 / Q1 FY27: sales 77,855 / 68,314 / 82,172; EBITDA 19,574 / 21,376 / 24,635; net income 11,553 / 14,779 / 14,150.
Left half: donut chart of revenue mix with callout labels and leader lines; right half: three-column comparison table with blue row labels (Sales, EBITDA, Net Income) and quarter column headers, current quarter column shaded light green.
India business (Rx + OTC + diagnostics + others) grew 14.7% YoY. India sales (INR mn): Q2 FY26 20,777, Q3 FY26 20,387, Q4 FY26 19,082, Q1 FY27 23,796, Q2 FY27 23,836. India Rx grew 14.4% in H1 vs IPM growth of ~14.3% (13.8% in Q2 FY27); anti-diabetes (1.5x), derma (1.5x) and cardio (1.1x) grew faster than market; anti-diabetes segment +28.6% vs IPM 18.8% in H1; in-licensed share of India Rx sales ~6% in H1. Chronic leadership: #2 respiratory, #3 cardiac, #3 diabetes care (IQVIA MAT Sept'26); chronic growth 19.5% in H1 vs IPM 17.2%; chronic share ~66% in H1 vs ~65% in FY26; volume growth 6.1% in H1; total sales force ~11,400 (MRs ~8,800). Launches: 4 respiratory, 3 GI, 1 each in neuro, cardio, gynae, anti-infectives and ortho; Lupisert ranked #3 in new launches in CNS; 12 products launched in H1 FY27; plan for 20+ launches in FY27.
Four-quadrant layout: top left bar chart of India sales; bottom left bullet list on therapy outperformance; top right three blue ranking tiles with therapy icons plus bullets; bottom right horizontal strip of therapy icons with launch counts and bullets.
IRF (India Region Formulations) poised to outperform IPM by 1.2-1.3x: maximize chronic focus with ~70% share by FY31; dedicated semaglutide division across diabetology/endocrinology and gastroenterology/gynecology; build emerging therapies; target alliances and M&A of mid-size companies, brands and portfolios; in-house pipeline of innovative assets and biosimilars; in-license products including GLP-1s; partner in e-commerce, organized retail and institutional business; expand the extra-urban Uday division and hospital channel. Ecosystem: Lupin Life consumer healthcare (GI, VMS, cough/cold) grew ~57% YoY with its highest quarterly sales in six quarters; Lupin Diagnostics grew 32% YoY with 7+ lakh patients served in the quarter; LYFE digital cardiac offering (~15,000 patients onboarded in the quarter) and Atharv Ability neuro-rehab; Humrahi and JAI patient support programs; Lupin Life Sciences generics reach via retailers and channel partners.
Two panels: left lavender panel with three icon-led subsections (penetration and reach, innovative pipeline, expanding footprint) in bordered bullet boxes; right green panel with vertical tabs 'Business Verticals' and 'Empowering community', each row pairing an illustration, bullet text and a brand logo.
Leadership: ~5.0% generic TRx volume share in the US; #3 in the US by prescriptions; #1 in 61 products and top 3 in 113 products. Generic market share of key products: tiotropium ~36%, mirabegron ~16%, albuterol ~15%. US sales (US$ mn, includes IP income): Q2 FY26 314, Q3 FY26 350, Q4 FY26 371, Q1 FY27 366, Q2 FY27 317 (+1% YoY, -13% QoQ). Highlights: quarter affected by increased competition and loss of exclusivity on key products, partly offset by seasonal demand and volume growth; tentative approval for novel Apixaban Oral Suspension via 505(b)(2); plan to launch ~15 products in FY27 including one 505(b)(2), one biosimilar and three injectables. Investments: 15+ ANDA filings planned in FY27; 48 FTFs including 21 exclusive FTFs; pipeline of 45+ injectables and 30+ inhalation products; target of 100+ new product launches with ~70%+ of NPL revenue from complex products by FY32; at least 6 biosimilars by FY32; specialty (Xopenex, NaMuscla) and M&A/partnerships; continued cost optimization.
Three-column layout: left column of blue KPI tiles (rank, product leadership, market shares) with Rx and inhaler icons; centre green-headed panel with bar chart of US sales and YoY/QoQ arrows plus key highlights bullets; right column bullet list on complex generics and 505(b)(2) investments with an italic outlined call-out box.
R&D pivoting towards complex generics and biosimilars: inhalation (MDIs, DPIs, soft-mist inhalers, nasal sprays, nebules), injectables (peptide, iron colloid, depot, liposomal and 505(b)(2) products), and a vertically integrated commercial-stage biosimilars business. Long-term goals: 20 complex product launches in regulated markets by 2028 (inhalation, injectables, ophthalmics); by 2029 complete 6 biosimilar filings in regulated markets and launch 10 novel complex products in India. Quality track record (last 12 months): successful FDA inspections with EIRs for Nagpur Unit-II (injectable, VAI), Nagpur Unit-I (NAI), Goa (VAI), Pithampur Unit-III (VAI), Aurangabad (VAI), Somerset (VAI), Pune Biotech (BLA received) and Ankleshwar (VAI); remediation sites Tarapur, Mandideep Unit-1 and Pithampur Unit-II. Quality goals: inspection readiness across sites, participation in the US FDA Quality Maturity Management Program, and a digitally enabled quality function.
Two side-by-side rounded panels (lavender R&D panel with blue header, mint quality panel with green header), each split horizontally into an upper and lower subsection with centred underlined subheadings and bullet lists.
R&D spend (INR mn, % of sales): Q2 FY26 5,222 (7.6%), Q3 FY26 5,352 (7.5%), Q4 FY26 5,081 (6.9%), Q1 FY27 6,077 (7.4%), Q2 FY27 6,181 (7.9%). Capex (INR mn, % of sales): 3,474 (5.1%), 2,007 (2.8%), 3,052 (4.1%), 2,786 (3.4%), 2,230 (2.9%). Net debt to equity: (0.08), (0.14), (0.21), (0.12), (0.14), i.e. net cash throughout. Percentages calculated on net sales excluding other operating income.
Three equal framed chart panels with blue header tabs: R&D bar-and-line chart, capex bar-and-line chart, and a negative-value bar chart for net debt to equity; current quarter highlighted green.
P&L in INR mn: net sales Q2 FY27 77,855 vs Q2 FY26 68,314 (+14.0% YoY) and Q1 FY27 82,172 (-5.3% QoQ); other operating income 418 (0.5% of sales) vs 2,161 (-80.7%) and 597 (-30.0%); total revenue 78,273 vs 70,475 (+11.1%) and 82,769 (-5.4%); gross profit excluding other operating income 57,774 (74.2%) vs 50,066 (73.3%, +15.4%) and 61,280 (74.6%, -5.7%); EBITDA 19,574 (25.1%) vs 21,376 (31.3%, -8.4%) and 24,635 (30.0%, -20.5%); net income 11,553 (14.8%) vs 14,779 (21.6%, -21.8%) and 14,150 (17.2%, -18.4%).
Full-width financial table with a dark blue header row and nine columns (particulars, three periods each with % of sales, YoY and QoQ growth); period value columns shaded in green tones, current quarter darkest.
Half-year P&L in INR mn, H1 FY27 vs H1 FY26: net sales 160,028 vs 129,952 (+23.1%); other operating income 1,014 (0.6%) vs 3,207 (2.5%, -68.4%); total revenue 161,042 vs 133,159 (+20.9%); gross profit excluding other operating income 119,054 (74.4%) vs 93,985 (72.3%, +26.7%); EBITDA 44,209 (27.6%) vs 37,790 (29.1%, +17.0%); net income 25,703 (16.1%) vs 26,969 (20.8%, -4.7%).
Same table format as the previous slide with six columns (particulars, H1 FY27, % of sales, H1 FY26, % of sales, YoY growth) and green-shaded period columns.
Section divider introducing the company overview section.
Diagonal split: black-and-white photo of four colleagues around a laptop on the left; blue-green gradient panel with white title on the right.
Global presence: 14th largest generic company by sales (MAT June-26); US$3.2 bn annual sales in FY26 and US$922 mn EBITDA in FY26 (at US$1 = INR 88.47); 27,000+ employees ('Lupinytts'); reaching lives in 100+ countries. Local leadership: 3rd largest in the US by prescriptions, 8th in the India pharma market by sales, 5th largest generics company in Australia and 8th in South Africa; R&D: 430 ANDAs and NDAs filed with the US FDA, 94 US DMF filings and 924 active patent applications (as of 31 March 2026). FY26 geographic mix (INR mn): United States 116,783 (42%), India 81,140 (30%), Emerging Markets 34,828 (13%), Other Developed Markets 32,439 (11%), API 9,685 (4%). Sustainability: S&P Global ESG score 91/100, global No. 1 ESG rating in the pharma sector; 48% renewable energy share; five years of water positivity in a row.
Four rounded columns with blue header tabs: Global Presence (icon stats), Local Leadership (green panel with ranked list and R&D figures), Geographically Diverse (donut chart with labels), Growing Sustainability (green panel with S&P Global score and icons).
Strategic pillars by business: United States — complex platforms (inhalation, biosimilars, injectables) and specialty, plus scaled oral and ophthalmic platforms; Other Developed Markets — operating leverage across portfolio, capex and R&D in similarly regulated markets (US, UK, Europe, Canada, Australia); India — above-market growth, innovative brands via licensing, partnering and acquisitions, strategic adjacencies; Other Emerging Markets — partner of choice in South Africa, Brazil, Mexico, Philippines and Southeast Asia and leading partner for global institutions on TB care; API — scale, supply reliability and cost position serving internal and external customers and global public health. Foundation: best-in-class global quality and continuous improvement culture.
Five tall rounded cards alternating blue and green, each with a shield icon badge at top, bold heading and descriptive text; a full-width blue ribbon banner beneath with two foundation statements.
Goals vs FY2026 status: 42% GHG reduction by 2030 (Scope 1 and 2 vs FY23) — ~41% achieved; 50% recycling by 2030 — ~45%; biodiversity assessment of 100% of global sites by 2030 — 66% completed; 15% women in top management by 2030 — ~12%; 50,000 employee volunteering hours by 2030 — 35,400+; 100% supplier assessment on a 3-year cycle — 17% ongoing engagement; education and awareness for 3 million patients and 50K doctors by 2030 — 980,000 patients and 73,500 doctors; 3 million Lives & Livelihood beneficiaries — 2.5+ million. Q2 FY27 highlights: Zero Waste to Landfill certification (platinum for 7 sites, gold for 1); We-Sync PwD inclusion and iMPACT 3.0 women's leadership programs; ESG assessments covering 130+ suppliers with seven capability-building programs; screening of 105,853 individuals for NCDs and 756 health camps.
Left: three-column table of icon-labelled topics, goals (lavender cells) and FY2026 status (mint cells). Right: blue-green gradient panel 'Key Highlights for Q2 FY27' divided into four quadrants, each with a white logo or icon and caption.
Purpose: 'We catalyze treatments that transform hope into healing'; ESG framework across Planet (climate change, water, waste, biodiversity), People (diversity and inclusion, volunteering, well-being and safety, supplier sustainability) and Patients (product launches and quality, patient assistance, education and awareness, diagnosis and rehabilitation). ESG ratings: S&P Global 91/100 in 2025 (17/100 in 2021), No. 1 in pharma globally; 3rd consecutive year in the S&P Global Sustainability Yearbook; Sustainalytics 22.11 medium risk in 2026 (42.69 severe in 2019); CDP 'A' leadership in climate and water 2025 (F in 2021); MSCI upgraded to BBB in 2025 (BB in 2024); NSE Sustainability 71/100 for FY2025; Crisil ESG 69 and Crisil Core ESG 65 for 2026. Aligned frameworks shown as logos: CDP, SASB, SBTi, The Climate Pledge, IBBI, GRI, ISO, TCFD, MSCI, EcoVadis, S&P Global, IR, Sustainalytics, UN Global Compact, TNFD and the UN SDGs.
Top: wide green band with a dark purpose box and three pillar columns (Planet, People, Patients) with icons and underlined lists. Middle: white rounded ratings strip with seven rating-agency logos and scores separated by vertical rules. Bottom: two rows of framework logos.
ESG and sustainability: global No. 1 in pharma and No. 1 in India across sectors in S&P Global ESG ratings; ASSOCHAM Sustainable Pharmaceutical Excellence Award 2026; debut in the Dow Jones Best-in-Class World and Emerging Markets indices 2026; S&P Global Sustainability Yearbook 2026; SBTi validation of emission targets; LEED Platinum for the Pune Research Park; Sustainable Organization of the Year; Mandideep environmental Medal of Honor from the Madhya Pradesh Chief Minister; TIME and Statista World's Most Sustainable Companies 2026; Zero Waste to Landfill certification. Operational excellence: Manufacturing Today Excellence in Technology 2026; Kinaxis 2026 Impact Award for supply chain; Great Place To Work India's Best Employers Among Nation-Builders 2026; gold medals for Tarapur, Jammu, Ankleshwar and CSN at the National Awards for Manufacturing Competitiveness; ISO 14001 and ISO 45001 for all 12 India manufacturing sites, R&D center and corporate office; Pithampur CII 5S awards; Tarapur digitization award. Patient-centric: Lupin Diagnostics Pathology Lab of the Year at the ET Healthcare Awards 2026; Asia Book of Records entries for bone mineral density camps and an asthma awareness initiative with 8,500+ doctors; Humrahi recognized at the CII WR Health Innovation Awards 2026; LupinLife Best Impact Creator in Healthcare; Lupin Digital Health award at the BW Healthcare Awards 2026.
Three equal columns with blue header tabs (ESG & Sustainability Leadership, Operational & Organizational Excellence, Patient-Centric Healthcare Excellence), each containing a dense bullet list with diamond-cross bullet markers on a light grey background.
Closing slide with QR codes for Lupin.com and MadeInIndia.com, the registered office address in Santacruz (East), Mumbai, phone and fax numbers, and links to lupin.com, X, LinkedIn, Facebook and YouTube.
Green-to-blue gradient background with large white 'THANK YOU!' headline on the left, two QR codes, contact block and social icon list below; large outlined five-petal flower line drawing on the right; logo top right.
Common questions about this slide and the underlying presentation content.
It is Lupin Limited's investor presentation for the quarter ended 30 September 2026, dated November 4, 2026. Its 20 slides cover key growth metrics, regional performance (India, North America, EMEA, APAC, LATAM, ROW, API), US and India business reviews, R&D and quality, quarterly trends in R&D, capex and net debt, the Q2 and H1 FY27 P&L tables, a company overview, sustainability goals, ESG ratings and awards.
According to the deck, net sales were INR 77,855 million, up 14.0% YoY; EBITDA was INR 19,574 million at a 25.1% margin, down 8.4% YoY; and net income (after adjusting the NCI stake) was INR 11,553 million at a 14.8% margin, down 21.8% YoY. For H1 FY27, net sales were INR 160,028 million, up 23.1%.
Lupin follows the Indian fiscal year, so FY27 runs from April 2026 to March 2027. Q2 FY27 is July to September 2026, and H1 FY27 is April to September 2026.
Lupin (NSE: LUPIN, BSE: 500257) filed this investor presentation with BSE and NSE, India's stock exchanges. The PDF here is the company's own presentation with the exchange cover letter removed. Slide content is unchanged.
Most figures are in Indian rupees, in millions (INR mn), as stated on the slides. The US sales trend on slide 9 is in US$ million, and the company overview on slide 15 gives FY26 sales of US$3.2 billion and EBITDA of US$922 million at an exchange rate of INR 88.47 per US dollar.
US sales were US$317 million, up 1% YoY and down 13% QoQ. The deck attributes the quarter to increased competition and loss of exclusivity on key products, partly offset by seasonal demand. Lupin reports a ~5.0% generic TRx share, a #3 rank by prescriptions, and a pipeline of 45+ injectables and 30+ inhalation products.
Yes. The original PDF is available to download from this page, and all 20 slides are also shown as images with a page-by-page summary. Use it to research Lupin's results or as a design reference for your own earnings presentation.
The layout patterns work well as a reference: KPI cards with growth arrows, regional performance grids, donut charts for revenue mix, five-quarter trend charts and shaded P&L tables. You can build a similar deck with 2Slides by describing your own data and content. The Lupin branding and figures belong to Lupin Limited.

Create Your Own Slides
Turn your ideas into professional presentations in seconds with 2slides AI.
Reference professional designs, choose your style, and generate slides with perfect text rendering. Powered by Nano Banana—start creating your presentation now.
Your AI Agent for slides. Save time, shine faster with intelligent presentation creation.


© 2026 2slides. All rights reserved.