
The LEGO Group Annual Report 2024 - Corporate annual report covering management review, consolidated and parent company financial statements, and auditor report
Quick Navigation
Tags
Share the slides
The LEGO Group Annual Report 2024 - Corporate annual report covering management review, consolidated and parent company financial statements, and auditor report
Detailed view of each slide page, including layout, key content and visual elements.
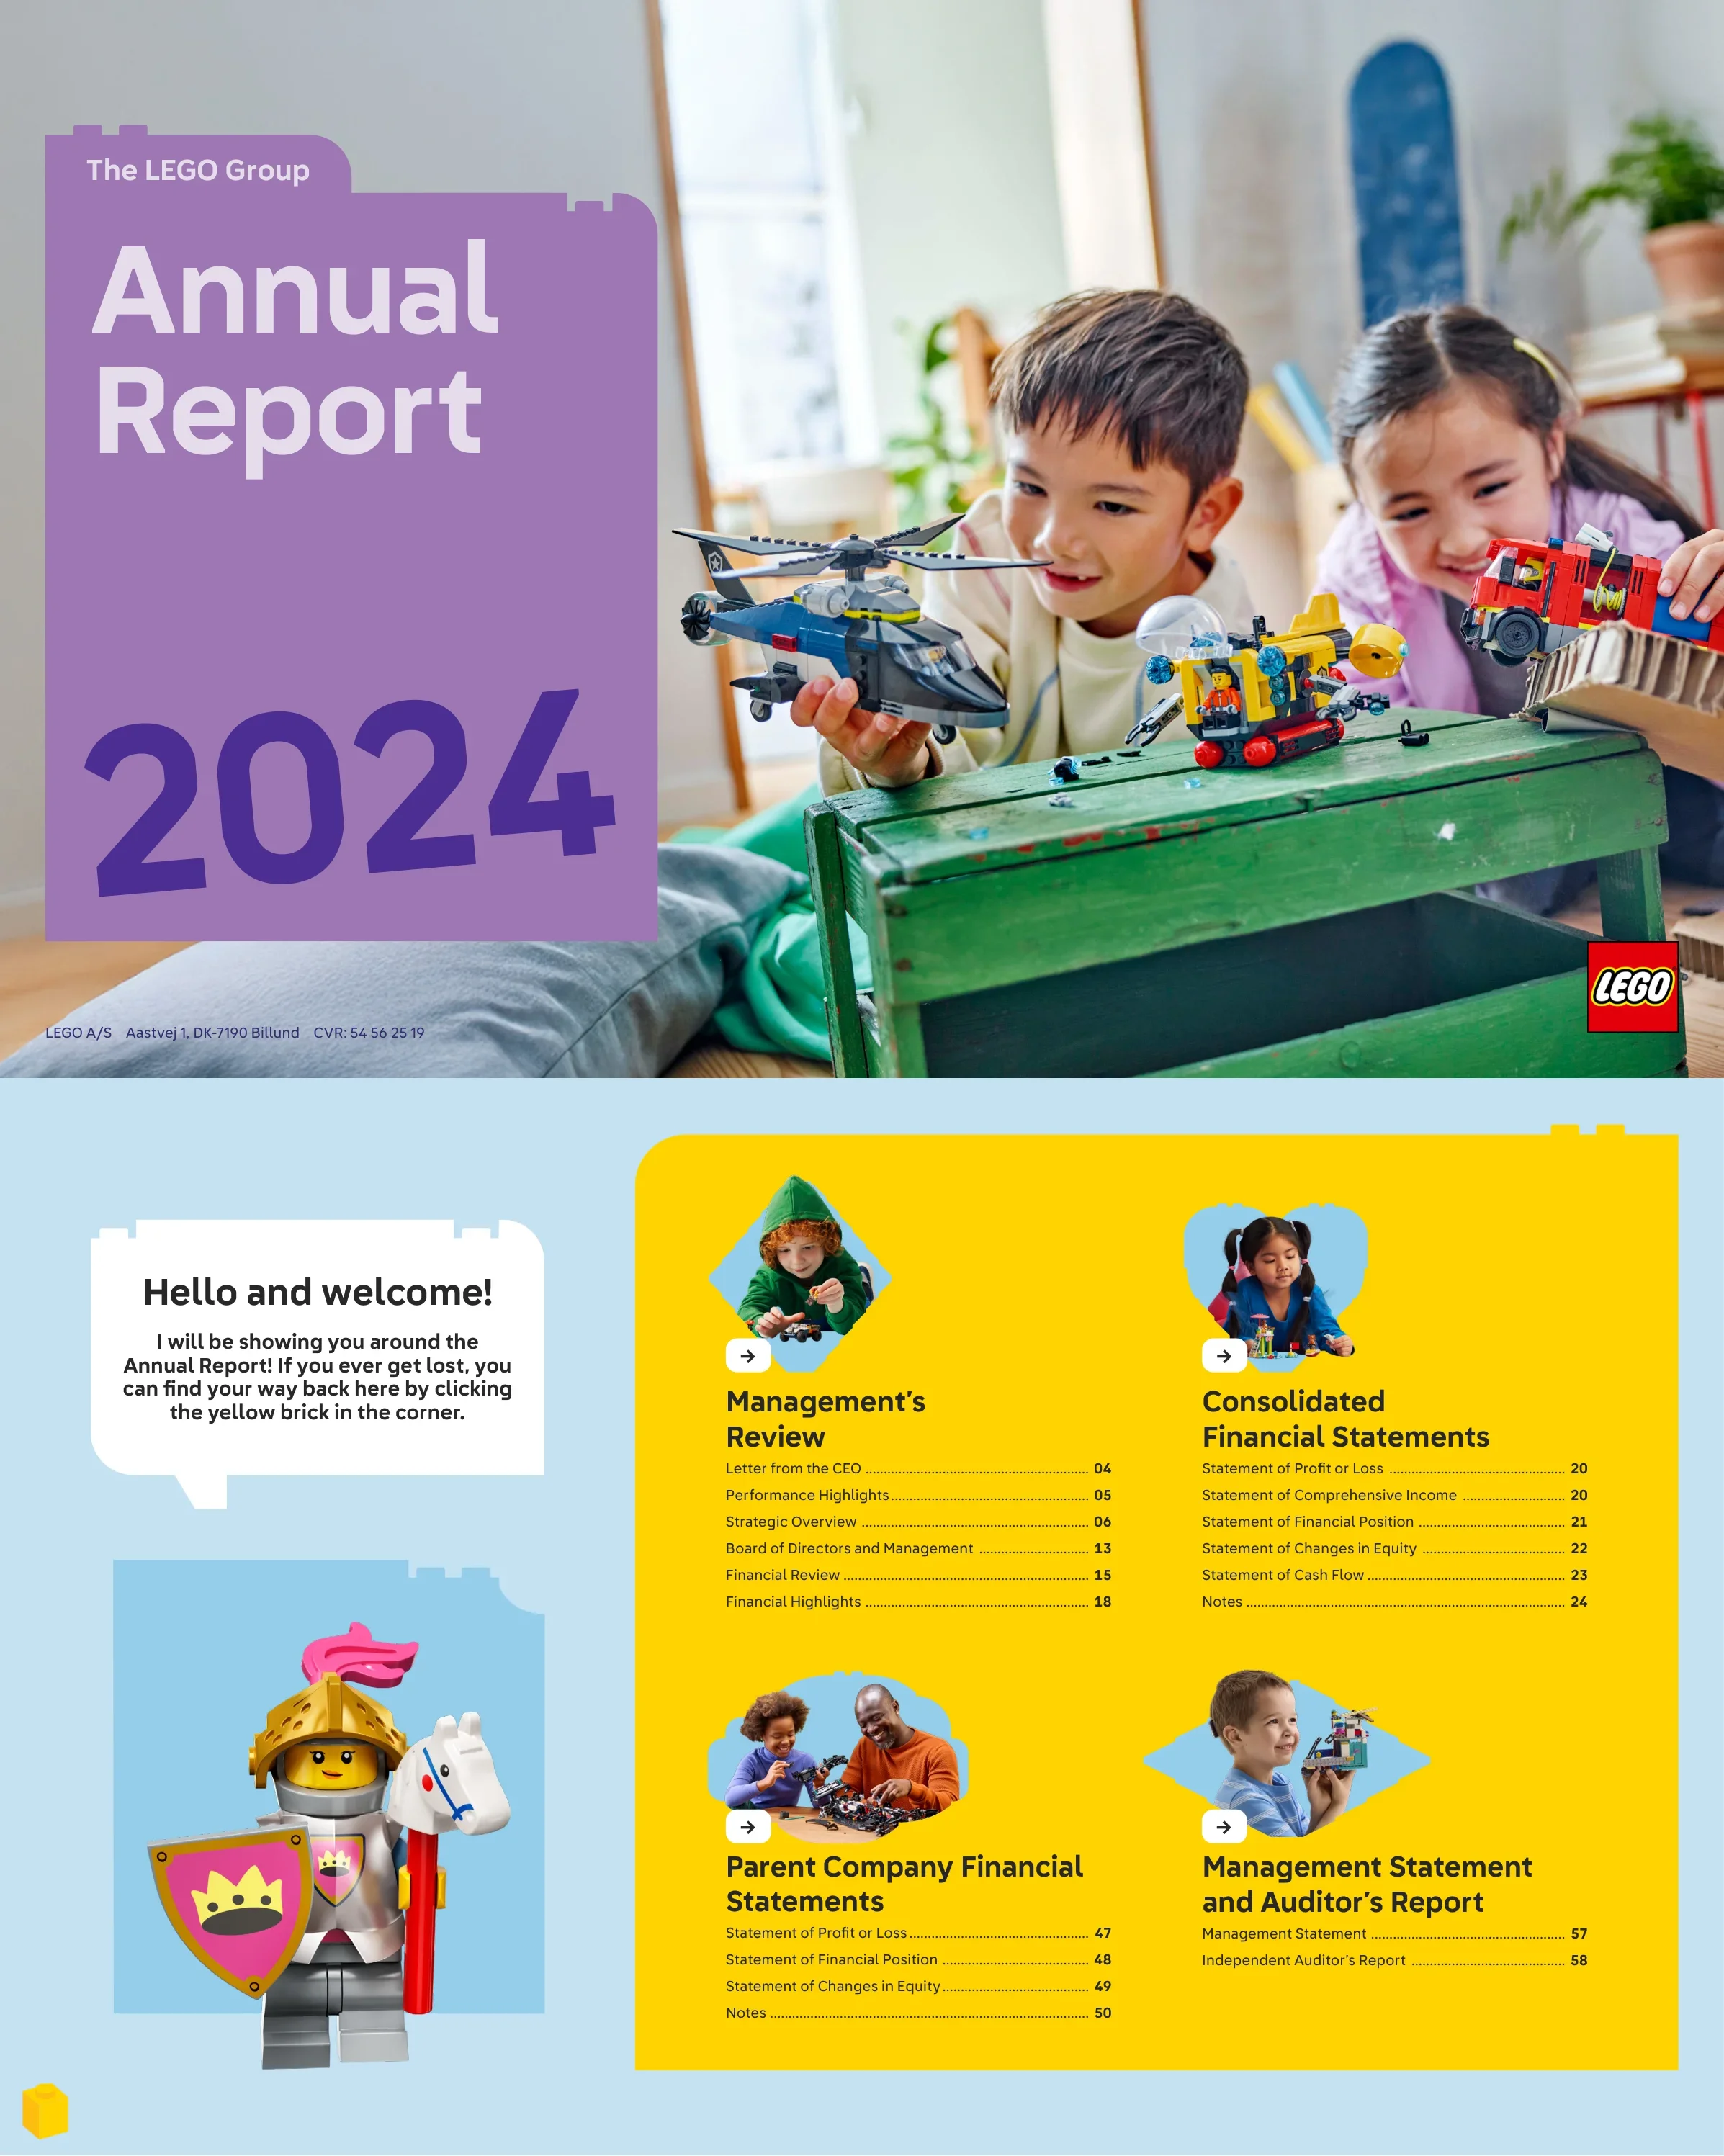
Title cover with LEGO logo, purple brand panel with Annual Report 2024, and lifestyle photography of two children playing with LEGO sets
Split layout with purple branded panel left containing title text, lifestyle photo right
Interactive TOC with LEGO knight minifigure guide introducing four sections: Management Review, Consolidated Financial Statements, Parent Company Financial Statements, Management Statement and Auditor Report
Light blue background with knight minifigure left, four section cards with photos and page listings right on yellow background
Section opener for Management Review with six subsection listings
Pink background with yellow title banner, orange subsection list, child photo in diamond frame right
CEO Niels B. Christiansen letter highlighting record results, diverse portfolio, sustainable materials (50% from sustainable sources), Vietnam factory, UN International Day of Play
Three-column text with CEO headshot right, signature, and yellow callout quote box bottom right
Revenue DKK 74.3B (+13%), Operating Profit DKK 18.7B (+10%), 840 products (46% new), 1,069 stores, 12M+ children impacted, 52% ROIC, FCF DKK 10.2B
Dense multi-color dashboard with financial charts left (blue), strategic initiatives center and right (red, pink, orange, green)
Six strategic pillars listed with color coding; UN International Day of Play adoption; mission to inspire builders of tomorrow
Split with numbered color-coded pillar list left and large child photo in yellow circle right
840 products, 390 new, 550+ designers, LEGO Fortnite (87M players), LEGO Star Wars 25th anniversary, Braille Bricks in 11 languages, NIKE and F1 partnerships
Split with red title card left and multi-column editorial with product photos right
1,069 branded stores (74 new), Creativity Workshops in 15 countries, LEGO Insiders membership, Minifigure Factory online, Jakarta largest SE Asia store
Pink title card left with store opening and retail experience photos right
50% materials from sustainable sources, 47% mass balance certified, arMABS recycled material, paper-based packaging (93% paper by weight), 12M+ children impacted, 7,000 volunteers
Orange title card left with sustainability center photos, carbon and volunteering text right
Five factories and four RDCs globally, Mexico factory expansion (+2 moulding modules), Hungary +60%, Vietnam equipment testing, US factory 2027, Belgium RDC opened
Red title card left with factory and distribution center photos, LEGO rocket minifigure decoration
LEGO Play app (5M+ downloads), LEGO Insiders app, retail partner automation, supply chain planning tools, cybersecurity enhancement
Magenta title card left with four audience columns (Consumers, Shoppers, Retail partners, Colleagues) with pink rounded cards
Innovation Campus groundbreaking, Boston Americas Hub, Copenhagen Hub planned 2027, employee satisfaction score 81, Sunflower Lanyard for invisible disabilities
Purple title card left with campus renderings and office photos right
Eight board members with photos and bios: Thomas Kirk Kristiansen (Chair), Soren Thorup Sorensen, Ebi Atawodi, Fiona Dawson, Jorgen Vig Knudstorp, Jan Thorsgaard Nielsen, Ilkka Paananen, Anne Sweeney
Two-row grid of eight headshot photos with yellow header banner
Seven ELT members: Niels B. Christiansen (CEO), Jesper Andersen (CFO), Atul Bhardwaj (CDTO), Colette Burke (CCO), Julia Goldin (CPMO), Carsten Rasmussen (COO), Loren I. Shuster (CPO)
Two-row grid of seven headshots with yellow Executive Leadership banner and role descriptions
Consumer sales +12%, Revenue DKK 74.3B (+13%, +14% constant currency), Operating Profit DKK 18.7B (+10%), operating margin 25.2%, net profit DKK 13.8B
Green background with 3D LEGO brick bar charts for consumer sales, revenue, and operating profit
Tax rate 23.6%, assets DKK 68.7B, PPE DKK 8.8B investment, FCF DKK 10.2B (+47%), R&D 46% new products, People Promise, Partner Promise, ESG governance, risks
Dense three-column text with green headers and tax contribution LEGO brick visualization
Total Tax Contribution DKK 15.1B (taxes borne DKK 6.3B + taxes collected DKK 8.8B), 2025 outlook: single-digit revenue growth
Split with tax contribution LEGO brick 3D chart and data tables left, governance and outlook text right
Five-year financial summary (2020-2024): P&L, balance sheet, cash flow, employees, growth rates, financial ratios including margins, ROE, ROIC
Yellow castle banner left with comprehensive financial data table right on blue chevron background
Section opener listing six financial statement components
Blue background with yellow title banner, dark green subsection list, child photo in diamond frame
Revenue DKK 74,325M, Gross Profit DKK 50,755M, Operating Profit DKK 18,741M, Net Profit DKK 13,792M; Comprehensive Income DKK 13,109M
Dual financial tables with blue headers and LEGO knight minifigure navigation guide
Total Assets DKK 68,691M, Total Equity DKK 41,771M, Total Liabilities DKK 26,920M
Dual balance sheet tables with blue headers
Equity movements for 2024 and 2023, DKK 9,000M dividend, net profit DKK 13,792M
Equity reconciliation table with accounting policies sidebar
Operating cash flow DKK 19,150M, Free Cash Flow DKK 10,193M, adjusted FCF DKK 9,135M
Cash flow statement with FCF reconciliation
Index of consolidated notes: Basis of preparation, Operating Profit, Operating assets/liabilities, Capital structure, Other disclosures
Yellow LEGO castle banner with blue note index below
IFRS basis, DKK functional currency, consolidation practice, foreign currency translation, financial ratio definitions
Three-column text with financial ratio definitions sidebar
IFRS 18 impact assessment, key accounting estimates (tax provisions, inventories, trade receivables)
Dual note layout with key estimates callout
Revenue DKK 74,325M by type and region (Americas DKK 35,408M, EMEA DKK 28,853M, Asia Pacific DKK 9,242M)
Revenue tables with accounting policies
Total expenses DKK 55,584M, production costs DKK 23,570M, sales DKK 23,438M, admin DKK 6,100M
Expense classification tables
Employee costs DKK 15,748M, 26,765 FTE, 31,282 headcount; income tax DKK 4,250M, effective rate 23.6%
Dual tables with knight minifigure navigation tip
Deferred tax movements, Pillar Two impact assessment, deferred tax assets/liabilities breakdown
Deferred tax tables with OECD policy discussion
PPE carrying value DKK 31,104M with DKK 8,817M additions across land, plant, fixtures, and construction
Detailed PPE movement table with accounting policies
Prior year comparative PPE data, depreciation schedule
Comparative PPE tables with depreciation schedule callout
Inventories DKK 6,052M, trade receivables net DKK 10,834M
Dual tables with accounting policies
Credit risk aging analysis with weighted average loss rates
Credit risk tables for 2024 and 2023
Other debt DKK 10,197M, deferred income DKK 1,635M
Dual tables with accounting policies
Financial income DKK 281M, expenses DKK 976M; share capital DKK 20M, DKK 9,000M dividend
Financial and share capital tables
ROU assets DKK 6,385M for 2024, DKK 5,216M for 2023
Side-by-side lease tables
Lease liabilities DKK 6,279M, maturity profile, P&L impact DKK 406M
Lease liability and P&L tables with policies
Lease policies continued, financial risk overview (credit Low, currency High, commodity Low, interest Low, liquidity Low)
Split with lease policies and risk assessment
Currency exposure across 8 currencies with sensitivity analysis
Large currency exposure table
Exchange rate sensitivity, hedging activities DKK 12,421M contracts (USD, GBP, CAD, AUD)
Sensitivity and hedging tables with policies
Audit fees DKK 29M, ELT remuneration DKK 221M (7 members)
Dual tables
Contingent liabilities DKK 16,273M, related party transactions with KIRKBI, Koldingvej 2
Contingent liability and related party tables
KIRKBI Invest, Motion JVco, LEGO Foundation transactions; loan agreement DKK 8,152M; no post-period events
Related party detail and loan tables
Complete subsidiary listing: Manufacturing (7 countries), Sales & Distribution (30+ countries), Other entities
Three-column entity listing
Section opener for parent company statements
Green background with yellow title banner, dark green subsection list, father-son LEGO Technic photo
Parent revenue DKK 649M, net profit DKK 13,721M
P&L table with knight minifigure guide
Total assets DKK 41,936M, equity DKK 41,385M
Dual balance sheet tables
Equity movements 2024 and 2023
Equity reconciliation table
Notes index: Basis, P&L, Financial Position, Other disclosures
Yellow castle banner with green note index
Parent accounting policies, employee costs DKK 153M, 5 employees, executive remuneration DKK 71M
Dual note tables
Financial income DKK 218M, expenses DKK 106M, income tax DKK 110M
Financial tables with tax policies
Intangible assets fully amortized, minimal PPE DKK 5M
Asset movement tables
Investments in subsidiaries DKK 40,578M, share capital 205 shares, deferred tax DKK 51M
Three note tables
Parent guarantees DKK 954M, related party transactions, proposed dividend DKK 9,000M
Three notes with tables
Section opener for management statement and auditor report
Orange background with yellow title banner, blue subsection list, boy with LEGO helicopter photo
Board adoption dated Billund 5 March 2025, signed by CEO and Board of Directors
Statement text left, LEGO castle illustration center, Board grid right on peach background
PricewaterhouseCoopers unqualified opinion on FY2024 financial statements
Formal audit report with castle illustration decorations
Auditor responsibilities, PwC signatures (Claus Lindholm Jacobsen, Mads Melgaard), dated Aarhus 5 March 2025
Continuation of audit report with PwC signoff and castle star illustration
LEGO A/S corporate details (Billund, CVR 54 56 25 19), design by e-Types, trademark notices
Purple background with corporate details and trademark disclaimers
Common questions about this slide and the underlying presentation content.
This is a 60-page corporate annual report from The LEGO Group for fiscal year 2024, covering four major sections: Management Review (CEO letter, performance highlights, six strategic pillars, board profiles, financial review), Consolidated Financial Statements with full IFRS notes, Parent Company Financial Statements, and Management Statement with PricewaterhouseCoopers Independent Auditors Report.
The report features LEGO's distinctive playful brand identity with four color-coded sections: pink for Management Review, blue for Consolidated Financial Statements, green for Parent Company Statements, and orange for the Auditor Report. A charming LEGO knight minifigure character serves as a navigation guide throughout. Each section uses diamond-shaped photo frames, LEGO brick decorative elements, and vivid child photography while maintaining professional corporate formatting.
LEGO achieved record results in 2024: Revenue of DKK 74.3 billion (+13%), Operating Profit of DKK 18.7 billion (+10%), Net Profit of DKK 13.8 billion (+5%), Free Cash Flow of DKK 10.2 billion (+47%), and a Return on Invested Capital of 52%. Consumer sales grew 12% in a global toy market that declined 1%. The company had 31,282 employees and operated 1,069 branded stores worldwide.
LEGO outlines six strategic pillars: 1) Innovating play and brand (840 products, LEGO Fortnite with 87M players, NIKE and F1 partnerships), 2) Creating memorable brand experiences (1,069 stores, Creativity Workshops), 3) Building a sustainable future (50% sustainable materials, paper-based packaging), 4) Expanding global supply chain (5 factories, Vietnam opening 2025, US factory 2027), 5) Advancing digital ambitions (LEGO Play app 5M+ downloads), 6) Providing playful and inclusive workplaces (Innovation Campus, Boston Hub).
The 2024 report is more compact at 60 pages (vs 87 pages for 2025), as the 2025 version added a full Sustainability Statement section aligned with ESRS standards. The 2024 report integrates sustainability content within the Management Review. Both share LEGO's distinctive color-coded design system and knight minifigure guide, but use different color palettes for their sections. The 2024 report uses a purple cover while the 2025 uses a yellow/green cover.
This report is excellent design inspiration, especially for brands that want to inject personality into formal corporate documents. The color-coded section system, navigation character concept, diamond-shaped photo frames, 3D LEGO brick data visualizations, and balance of playful imagery with rigorous financial disclosure are all transferable design patterns.
The report features 3D LEGO brick bar charts for revenue and operating profit trends, pie charts for sustainable material composition, five-year trend tables, color-coded KPI dashboards on the Performance Highlights page, and clean blue/green-accented financial tables. The 3D brick charts are particularly distinctive, using LEGO bricks as the bar elements in different colors for each year.
The report was designed for interactive PDF viewing with a LEGO knight minifigure serving as a navigation guide who appears at section transitions with tips like 'click the yellow brick to return to the beginning' and 'follow the arrow to the next page.' Each section uses colored navigation bars at the bottom of pages, and the table of contents features clickable arrow buttons linking to each section.

Create Your Own Slides
Turn your ideas into professional presentations in seconds with 2slides AI.
Reference professional designs, choose your style, and generate slides with perfect text rendering. Powered by Nano Banana—start creating your presentation now.
Your AI Agent for slides. Save time, shine faster with intelligent presentation creation.




© 2026 2slides. All rights reserved.