
Part of Investor presentation examples · Japanese investor presentation examples
Kobe Steel H1 FY2026 Earnings Presentation: a 38-page Japanese-language (決算説明資料) deck from Kobe Steel, Ltd. (KOBELCO, securities code 5406), dated November 10, 2026, whose original was published on TDnet (Tokyo Stock Exchange timely disclosure). It covers the second-quarter / first-half results and the full-year outlook. FY2026 = fiscal year ending March 2027; H1 = April–September 2026. Amounts are in ¥100 million (億円) unless noted.
Uses this deck’s cover as a style reference for slides made from your own content. Or pick any page below to use its layout as the reference.
Quick Navigation
Tags
Share the slides
Kobe Steel H1 FY2026 Earnings Presentation: a 38-page Japanese-language (決算説明資料) deck from Kobe Steel, Ltd. (KOBELCO, securities code 5406), dated November 10, 2026, whose original was published on TDnet (Tokyo Stock Exchange timely disclosure). It covers the second-quarter / first-half results and the full-year outlook. FY2026 = fiscal year ending March 2027; H1 = April–September 2026. Amounts are in ¥100 million (億円) unless noted.
Detailed view of each slide page, including layout, key content and visual elements.
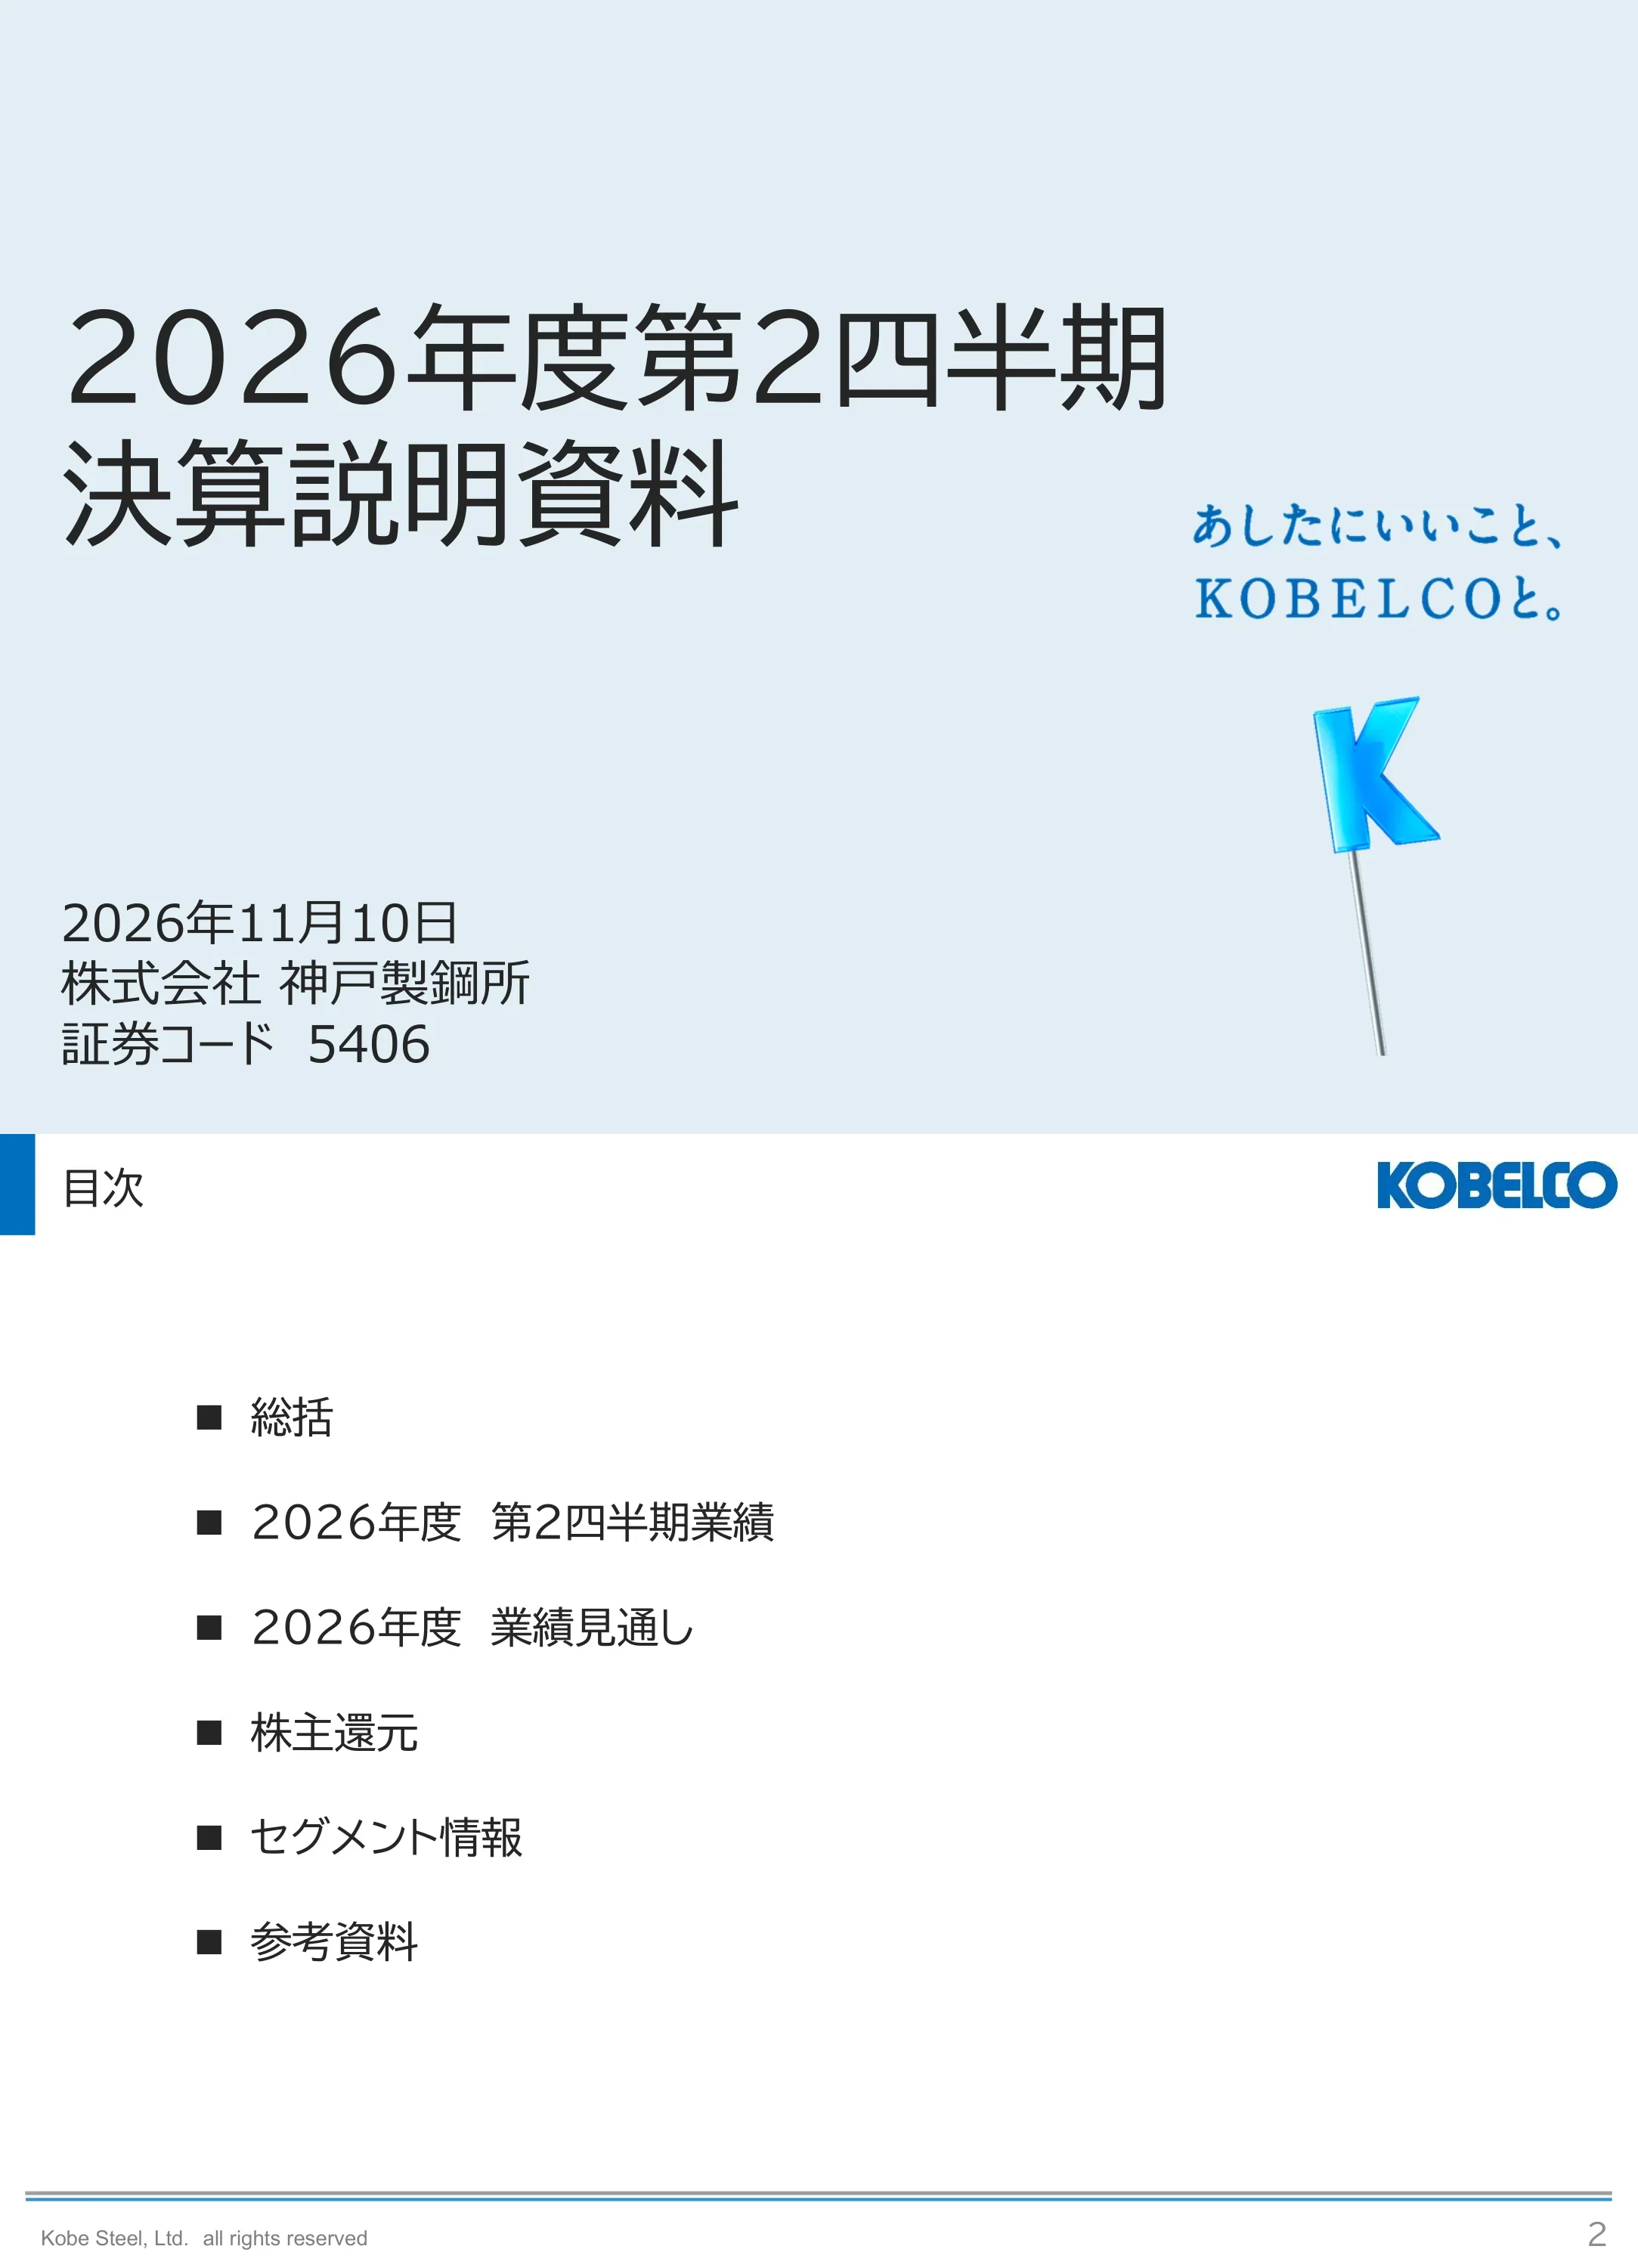
Title slide for Kobe Steel's second-quarter FY2026 earnings presentation, dated November 10, 2026, with the company name (株式会社 神戸製鋼所) and securities code 5406. The KOBELCO tagline and a blue K pin logo appear at right.
Light blue full-bleed background; large left-aligned two-line title in the middle, date, company name and code at lower left, tagline and K-pin graphic at right.
Lists six sections: Summary (総括), FY2026 Q2 results, FY2026 outlook, shareholder returns, segment information and reference materials.
Title with blue side bar at top left, KOBELCO logo top right, six square-bulleted items stacked vertically with generous spacing, footer rule with copyright and page number.
H1 ordinary profit was flat YoY at ¥57.2 billion as a worse steel metal spread was offset by better inventory valuation effects, while net profit fell to ¥42.5 billion on the absence of last year's policy-shareholding sale gains. FY2026 outlook is ordinary profit ¥135 billion and net profit ¥105 billion; Middle East impact is about -¥14.5 billion for the year (-¥2.5 billion vs. previous). Interim dividend is ¥40 per share, annual ¥80 (payout ratio 30.2%).
Three blue-headed text blocks (H1 results, FY outlook, shareholder returns), each with bullet paragraphs and bold key figures.
H1 FY2026: net sales ¥1,259.8 billion (+¥78.3 billion YoY), ordinary profit ¥57.2 billion (-¥0.4 billion; ¥29.7 billion excluding inventory valuation, -¥34.4 billion), net profit ¥42.5 billion (-¥20.2 billion). FY2026 outlook: net sales ¥2,750 billion (+¥60 billion vs. previous), ordinary profit ¥135 billion (+¥15 billion), net profit ¥105 billion (+¥5 billion); ROIC about 6.0%, ROE about 8.0%, equity ratio about 49%, D/E about 0.55x; interim dividend ¥40, annual ¥80.
Two side-by-side KPI tables (H1 results left, full-year outlook right) with YoY and vs.-previous deltas, and a lower blue-labeled panel for financial indicators and shareholder returns.
A -¥9.5 billion impact (higher crude oil and energy prices) already appeared in H1; because cost increases lag in being passed to selling prices, the full-year impact is estimated at -¥14.5 billion (H1 -¥9.5 billion, H2 -¥5.0 billion; previous estimate -¥12.0 billion). The largest item is logistics, energy and material cost at -¥13.0 billion. Segment split: Steel -¥6.5 billion, Aluminum Rolled -¥3.0 billion, Advanced Materials -¥2.0 billion, Welding -¥0.5 billion, Machinery -¥0.5 billion, Construction Machinery -¥2.0 billion.
Boxed two-bullet callout on top, then a risk-impact table with H1 / H2 / full-year columns (full-year column highlighted) and a previous-estimate reference column, with a segment breakdown line at the bottom.
H1 FY2026 vs. H1 FY2025: net sales 12,598 vs. 11,814 (+783), operating profit 609 (-15), ordinary profit 572 (-4), ordinary profit excl. inventory valuation 297 (-344), extraordinary income 28 (-151), net profit 425 (-202); full-year outlook 27,500 / 1,650 / 1,350 / 1,015 / 50 / 1,050. Sales rose on higher aluminum and copper prices; ordinary profit was flat as the steel metal spread worsened but inventory valuation improved; net profit fell on lost policy-shareholding sale gains. Unit: ¥100 million.
Wide financial table (FY2025 H1/H2/full year, FY2026 outlook H1/H2/full year, change column) with the H1 columns boxed in teal, followed by three labeled commentary bars for sales, ordinary profit and net profit.
Ordinary profit moved from ¥57.6 billion to ¥57.2 billion (-¥0.4 billion): volume/mix +60, steel sales and raw material price -345, non-steel sales and procurement price +100, cost -40, equity-method +35, power -92, inventory valuation +340 and other -62 (¥100 million units). Call-out tables break each driver down by segment, and Middle East impact totals -95.
Waterfall chart with gray start/end bars, blue (positive) and red (negative) hatched floating bars, a top arrow showing the net change, and boxed segment call-out tables connected by leader lines; circled key bars in red.
H1 FY2026 vs. H1 FY2025 ordinary profit: Steel -37 vs. 85 (-122; excl. inventory -167 vs. 165, -332), Aluminum Rolled 51 vs. -19 (+71), Advanced Materials 121 vs. 8 (+112, semiconductor equipment demand), Welding 48 (+28), materials total 184 (+89); Machinery 139 (-46), Engineering 75 (+45), Construction Machinery 44 (+8), machinery total 260 (+7); Power 142 vs. 235 (-92). Unit: ¥100 million.
Segment table with colored row labels (blue materials, teal machinery, purple power), three numeric columns (prior H1, current H1, difference) and a right-hand commentary column; red circles highlight the largest changes.
Demand versus the previous outlook for end markets: automotive (domestic flat, overseas down on lower Japanese-brand sales in China), IT/semiconductor (HDD flat, semiconductor-related up), shipbuilding flat, aircraft flat, beverage cans flat, construction/civil engineering flat. Units affected by demand are listed in blue brackets for each market.
Six-row text table with the end market at left and a blue parenthetical list of affected products above a one- or two-line assessment with bold direction words.
Machinery: energy and chemicals flat (investment delays amid global uncertainty), general industry strong domestically and weak overseas on China. Construction machinery and hydraulic excavators: Japan down, China flat, North America up, Europe up, Southeast Asia (Indonesia, Vietnam) up versus the previous outlook.
Two stacked sections (Machinery; Construction Machinery & Hydraulic Excavators) of label-plus-assessment rows divided by thin rules.
Current vs. previous full-year outlook: net sales 27,500 vs. 26,900 (+600), operating profit 1,650 (+150), ordinary profit 1,350 vs. 1,200 (+150), excl. inventory valuation 1,015 vs. 995 (+20), extraordinary income 50 (-50), net profit 1,050 vs. 1,000 (+50). H2 ordinary profit is 777. Drivers: higher selling prices from raw material costs, inventory valuation gains in materials businesses; net profit rises despite lower extraordinary income due to overseas subsidiary liquidation timing. Unit: ¥100 million.
Table comparing previous outlook (teal header) and current outlook (blue header) by H1/H2/full year with a change column, followed by three labeled commentary bars.
Ordinary profit rises by ¥15.0 billion from 1,200 to 1,350: volume/mix +55, steel pricing +5, non-steel pricing +10, cost -30, equity-method ±0, power ±0, inventory valuation +130 (steel -20, aluminum +20, copper +130) and other -20. Middle East impact is -25 within the changes.
Waterfall chart from 1,200 (previous) to 1,350 (current) with call-out tables for volume, pricing, cost and inventory valuation, and a Middle East impact box at top right.
Ordinary profit outlook, current vs. previous: Steel 120 vs. 140 (-20), Aluminum Rolled 75 (+20), Advanced Materials 240 (+130), Welding 75 (+10), materials total 510 (+140); Machinery 400 (flat), Engineering 160 (+45), Construction Machinery 120 vs. 160 (-40), machinery total 680 (+5); Power 300 (flat); Other/adjustments -140 (+5). Unit: ¥100 million.
Segment table with prior, current and difference columns and a commentary column; key changes circled in red; steel, aluminum and copper rows show an inventory-excluded sub-line.
Ordinary profit is expected to rise by ¥20.5 billion from H1 (572) to H2 (777): volume/mix +285, steel pricing +340, non-steel pricing -70, cost +35, equity-method -25, power +14, inventory valuation -215 and other -160 (steel dismantling costs concentrated at period end and company-wide crude and raw material risk). A box notes steel metal spread improvement and machinery sales concentrated in H2.
Callout box on top, net-change arrow, then a waterfall chart with segment call-out tables and a Middle East impact box (+45).
Four small waterfalls from H1 to H2 outlook: Steel -37 to 157 (steel pricing +340, inventory -160), Aluminum Rolled 51 to 23 (inventory -45), Advanced Materials 121 to 118, Construction Machinery 44 to 75 (volume +80, pricing -70). Unit: ¥100 million.
2x2 grid of mini waterfall charts separated by thin cross lines, each with a segment title and labeled bars.
Operating cash flow worsens on machinery payment timing while investing cash flow improves on delayed capex payments, leaving free cash flow at ¥0 (same as previous). FY2026 operating CF 1,700 (previous 1,800), investing CF -1,700, interest-bearing debt 7,550, equity ratio about 49% (FY2025 46.4%), D/E about 0.55x (FY2025 0.61x), cash 1,400. Unit: ¥100 million.
Callout box at top and three charts below: cash-flow bars with FCF line, total assets / net assets bars with equity-ratio line, and debt / cash bars with D/E line, each comparing FY2025, FY2026 previous and FY2026 current.
Interim dividend of ¥40 per share resolved as previously announced; year-end dividend policy unchanged. FY2026: interim ¥40 and year-end ¥40 (policy), total ¥80, payout ratio 30.2% (FY2025: ¥80, 33.6%). Medium-term plan (FY2024–2026) targets a payout ratio of about 30%. The chart shows dividends from FY2019 to FY2026 peaking at ¥100 in FY2024.
Blue banner across top, left gray panel with policy text and a dividend table, right-hand bar chart of annual dividends with a payout-ratio line.
Divider slide introducing the segment information section; no figures.
Blank white slide with the section title centered in blue and the KOBELCO logo at top right.
Master table of sales and ordinary profit by segment across FY2025, previous outlook and current outlook. Current FY2026 outlook: Steel & Aluminum sales 10,780, Advanced Materials 4,250, Welding 1,050, Machinery 2,850, Engineering 2,000, Construction Machinery 4,490, Power 2,450, total sales 27,500; ordinary profit 1,350 including Steel & Aluminum 195, Advanced Materials 240, Welding 75, Machinery 400, Engineering 160, Construction Machinery 120, Power 300 and adjustments -195. Unit: ¥100 million. Small text is dense but legible.
Very dense table with three column groups (FY2025, previous outlook, current outlook), two change columns, sales rows on top and ordinary profit rows below, plus inventory-excluded and net profit rows.
Steel H1 FY2026: sales 4,096 (-82 YoY), ordinary profit -37 vs. 85 (-122), -167 excl. inventory valuation; full-year outlook sales 8,650, ordinary profit 120 (-20 vs. previous, 20 excl. inventory). Crude steel output 3.0 million tons in H1, steel sales volume 2.29 million tons, unit price ¥136 thousand per ton. Two waterfall charts explain the H1 YoY and outlook changes. Unit: ¥100 million.
Top data table with prior year, previous outlook, current outlook and change columns (including volume and price rows), and two waterfall charts below.
Explains that principal raw material costs (iron ore, coking coal) are priced on quarterly market averages, other costs fluctuate with markets and geopolitical risk, and selling price pass-through lags, so the metal spread temporarily narrows when costs rise and widens when costs fall.
Callout box with three bullets above a conceptual stacked-bar chart showing main raw material and other costs, a dashed total-cost line and a solid selling-price curve, with annotated arrows.
Aluminum rolled: H1 FY2026 sales 1,003 (+121 YoY), ordinary profit 51 vs. -19 (+71; -3 excl. inventory); full-year outlook sales 2,130 (+100 vs. previous), ordinary profit 75 (+20, 10 excl. inventory). Sales volume H1 138 thousand tons, outlook 285 thousand tons. Waterfalls show inventory valuation +45 for H1 and +20 for the outlook revision. Unit: ¥100 million.
Data table above two waterfall charts (H1 YoY and outlook vs. previous).
H1 FY2026 sales 1,955 (+412 YoY), ordinary profit 121 vs. 8 (+112; 31 excl. inventory); full-year outlook sales 4,250 (+400 vs. previous) and ordinary profit 240 (+130, 70 excl. inventory). Aluminum extrusion volume 39 thousand tons and copper strip 60 thousand tons. Growth reflects semiconductor equipment demand (aluminum castings and forgings), partly offset by lower China auto demand (suspension). Unit: ¥100 million.
Table with volume rows on top, two waterfall charts below with text callouts about semiconductor equipment and China auto demand.
Welding H1 FY2026 sales 523 (+62 YoY), ordinary profit 48 vs. 20 (+28); full-year outlook sales 1,050 (+20 vs. previous), ordinary profit 75 (+10). Welding material volume 118 thousand tons in H1 and 235 thousand tons for the year. Commentary covers volume (domestic up, overseas flat), price (up on weaker yen) and cost (procurement cost up).
Table at top, then two columns (H1 YoY and outlook vs. previous) of three labeled commentary rows for volume, price and cost.
Machinery H1 FY2026 sales 1,289 (flat YoY), ordinary profit 139 vs. 186 (-46); full-year outlook sales 2,850 (+50), ordinary profit 400 (flat vs. previous). Orders 1,206 in H1 (-27 YoY) and 2,800 for the outlook (+100), with order backlog 2,308. Outlook orders rise on strong demand for isostatic press (IP) equipment; H1 profit fell on lower energy and chemical unit sales. Unit: ¥100 million.
Table with sales, profit, orders and backlog, then two columns of labeled commentary rows for orders and ordinary profit.
Engineering H1 FY2026 sales 827 (+87 YoY), ordinary profit 75 vs. 29 (+45); full-year outlook sales 2,000 (-10 vs. previous), ordinary profit 160 (+45). Orders H1 1,774 (+889 YoY) on large waste-treatment and water-treatment projects, outlook 2,350 (flat), backlog 4,934. Profit improves on higher direct reduced iron-related sales and better project margins. Unit: ¥100 million.
Table with sales, profit, orders and backlog, followed by two columns of commentary rows for orders and ordinary profit.
Construction machinery H1 FY2026 sales 2,025 (+144 YoY), ordinary profit 44 vs. 36 (+8); full-year outlook sales 4,490 (-30 vs. previous), ordinary profit 120 (-40). Hydraulic excavator volume 10.1 thousand units in H1 (22.0 thousand for the year) and rough terrain cranes 119 units. Waterfalls show higher allowance for doubtful accounts (e.g. European dealers) weighing on the outlook. Unit: ¥100 million.
Table with unit-volume rows and a footnote, then two waterfall charts (H1 YoY and outlook vs. previous) with callouts.
Power H1 FY2026 sales 1,144 (+10 YoY), ordinary profit 142 vs. 235 (-92); full-year outlook sales 2,450 (+120 vs. previous) and ordinary profit 300 (flat). H1 profit fell on the extended periodic inspection of Kobe Power Plant Unit 3 and fading coal-price related gains; one-off items of 10 (fuel adjustment timing) and 10 (power sale price) in H1 FY2025 do not recur. Unit: ¥100 million.
Table with one-off items rows, then two columns of commentary rows for power volume, unit price and ordinary profit.
Divider slide introducing the reference materials section; no figures.
Blank white slide with a centered blue section title and KOBELCO logo.
FY2026 current assumptions: USD ¥157.5 for the year (H1 160.0, H2 155.0; FY2025 151.1), RMB ¥23.3 (H1 23.6, H2 23.0), EUR ¥182.3 (H1 184.6, H2 180.0). Sensitivity for a ¥1 weaker yen against USD: Steel roughly no impact, Construction Machinery about +¥0.2 billion; against EUR: Construction Machinery about +¥0.1 billion.
Three-row FX table with gray (FY2025), teal (previous) and blue (current) column groups, followed by a text block on FX sensitivity.
Iron ore: FY2026 Q3 price settled at $87 per ton and Q4 assumed at the same level. Coking coal: Q2 price settled at $236 and H2 assumed at Q2 level. Thermal coal: market rose to $130–$150 from July to September 2026, with H2 assumed at the current level. Two charts show iron ore and coking coal market prices vs. quarterly contract prices from March 2025.
Three assumption rows at top and two line charts below (iron ore FOB, coking coal FOB) showing market price in blue and quarterly contract price in red steps, with labeled price call-outs and arrows for assumptions.
FY2026 current outlook of inventory valuation effects: Steel total 100 (H1 130, H2 -30) from iron ore carry-over -15, total average 70 and lower-of-cost 30; Aluminum Rolled 65 (H1 55, H2 10); Advanced Materials 170 (H1 90, H2 80). FY2025 comparatives were -95 for steel, 25 for aluminum and 25 for copper. Unit: ¥100 million.
Three stacked tables (Steel, Aluminum Rolled, Advanced Materials) with FY2025, previous and current column groups and rows for total average, lower-of-cost and carry-over methods.
Full-year ordinary profit is forecast to rise by ¥13.6 billion from 1,213 (FY2025) to 1,350: volume/mix +140, steel pricing -245, non-steel pricing +20, cost -25, equity-method +15, power -47, inventory valuation +375 and other -97. Call-out tables show segment splits and FX effects (+50 total).
Full-width waterfall chart from FY2025 to FY2026 with segment call-out tables and leader lines.
Capex: FY2026 outlook ¥160.0 billion on a recognition basis and ¥165.0 billion paid, depreciation ¥125.0 billion. Equity ratio about 49% (FY2025 46.4%), interest-bearing debt ¥755.0 billion, D/E about 0.55x, operating CF ¥170.0 billion, investing CF -¥170.0 billion, FCF 0, cash ¥140.0 billion, EPS ¥264.67, ROE about 8.0% and ROIC about 6.0%. FY2023–FY2025 actuals are shown for comparison.
Four stacked bordered tables (capex/depreciation, balance sheet, cash flow, per-share and returns) with columns for FY2023–FY2025 actuals and FY2026 previous/current outlook; footnotes define D/E, ROE and ROIC.
Two bar charts show ordinary profit and net profit attributable to owners of parent from FY00 to FY26 (outlook). Ordinary profit peaked at ¥183.2 billion in FY06, with FY25 at 1,213 and the FY26 outlook at 1,350; net profit shows 937 in FY25 and 1,050 in FY26 outlook, with a low of -680 in FY19. Unit: ¥100 million.
Two stacked bordered panels each containing a 27-bar column chart with data labels; the FY26 bar is shaded lighter to mark it as forecast.
Kobe Steel states it actively engages with capital markets and discloses the content on its website (FY2025 edition published June 2026). Major external recognitions listed: FTSE4Good Index Series, FTSE JPX Blossom Japan Sector Relative Index, FTSE JPX Blossom Japan Index, CDP Climate A List 2025, MSCI Japan ESG Select Leaders Index and MSCI Japan Empowering Women Index (WIN) 2026 constituent, and a first Excellence Award at the Nikkei Integrated Report Awards 2025.
Top section with text and a document thumbnail, then a grid of index logos with names, with CDP and Nikkei award panels in a right column and an MSCI disclaimer at the bottom (small text, legible only in part).
KOBELCO's philosophy in four boxes: the future it wants to realize (a safe, secure and prosperous world where people can realize dreams and hopes), its mission (use individuality and technology to keep tackling social issues), its Three Commitments (trusted technology, products and services; valuing every employee; creating new value through continuous change) and its Six Pledges (ethics and professionalism, contributing through excellent products, a workplace that is easy to work in, coexistence with local communities, environmental contribution, respect for stakeholders).
Four horizontal bands, each with a blue label block at left and an outlined white content panel at right with numbered lists; a Quality Charter tag sits inside the fourth band.
Standard disclaimer that forward-looking statements are based on information currently available and may differ materially from actual results, and that the company has no obligation to revise them. Listed risk factors: economic conditions and demand in major markets, political conditions and trade regulations, exchange rate fluctuations, raw material availability and prices, competitors' products and M&A activity, and strategic changes by alliance partners.
Text-only slide with two square-bulleted paragraphs and a bulleted risk-factor list, plus the standard header and footer.
Common questions about this slide and the underlying presentation content.
It covers the first half (April–September 2026) of fiscal year FY2026, which ends March 2027. The 38 pages include a summary, H1 results, a revised full-year outlook, shareholder returns, eight segment pages (Steel, Aluminum Rolled, Advanced Materials, Welding, Machinery, Engineering, Construction Machinery, Power) and reference data such as FX and raw material assumptions.
The deck is in Japanese and its original, titled 2026年度第2四半期 決算説明資料, was published on TDnet, the Tokyo Stock Exchange's timely disclosure system, on November 10, 2026 by Kobe Steel, Ltd. (securities code 5406). Gallery descriptions here are in English; the slides themselves remain in Japanese.
For H1 FY2026, net sales were ¥1,259.8 billion (+¥78.3 billion YoY), ordinary profit ¥57.2 billion (-¥0.4 billion) and profit attributable to owners of parent ¥42.5 billion (-¥20.2 billion). The FY2026 outlook is net sales ¥2,750 billion, ordinary profit ¥135 billion and net profit ¥105 billion, with ROIC about 6.0% and ROE about 8.0%.
An interim dividend of ¥40 per share was resolved and the annual dividend policy stays at ¥80 per share (payout ratio 30.2%). The medium-term management plan for FY2024–2026 targets a payout ratio of about 30%.
Page 5 estimates a full-year Middle East impact of about -¥14.5 billion from higher crude oil and energy costs, split by segment. Inventory valuation effects, which lift ordinary profit as aluminum and copper prices rise, are detailed in the bridges and on page 32.
Yes. Use the download options on this gallery page to get the slides as a PDF or an editable PPTX where available. The original disclosure is a PDF published by Kobe Steel via TDnet.
Yes. The deck uses repeatable building blocks: KPI tables with YoY and vs.-previous columns, profit waterfall charts with call-out tables, segment tables with commentary columns, and section divider slides. Replace the numbers and branding with your own and keep the blue-and-gray structure.
FY2026 is the fiscal year ending March 2027, and H1 (上期) is the first half, April–September 2026. H2 (下期) is October 2026 to March 2027. Amounts are in units of ¥100 million (億円) unless stated otherwise.

Create Your Own Slides
Turn your ideas into professional presentations in seconds with 2slides AI.
Reference professional designs, choose your style, and generate slides with perfect text rendering. Powered by Nano Banana—start creating your presentation now.
Your AI Agent for slides. Save time, shine faster with intelligent presentation creation.


© 2026 2slides. All rights reserved.