
Part of Investor presentation examples · Japanese investor presentation examples
Kawasaki Heavy Industries H1 FY2026 Earnings Presentation: a 55-page Japanese-language investor deck (決算説明資料, 2026年度第2四半期決算説明資料) whose original was published on TDnet (Tokyo Stock Exchange timely disclosure) on November 10, 2026. FY2026 is the fiscal year ending March 2027, so H1 covers April to September 2026. It reports record H1 results, with revenue of ¥1,084.4 billion and operating profit of ¥73.8 billion, and raises full-year operating profit guidance by ¥5.0 billion to ¥185.0 billion.
Uses this deck’s cover as a style reference for slides made from your own content. Or pick any page below to use its layout as the reference.
Quick Navigation
Tags
Share the slides
Kawasaki Heavy Industries H1 FY2026 Earnings Presentation: a 55-page Japanese-language investor deck (決算説明資料, 2026年度第2四半期決算説明資料) whose original was published on TDnet (Tokyo Stock Exchange timely disclosure) on November 10, 2026. FY2026 is the fiscal year ending March 2027, so H1 covers April to September 2026. It reports record H1 results, with revenue of ¥1,084.4 billion and operating profit of ¥73.8 billion, and raises full-year operating profit guidance by ¥5.0 billion to ¥185.0 billion.
Detailed view of each slide page, including layout, key content and visual elements.
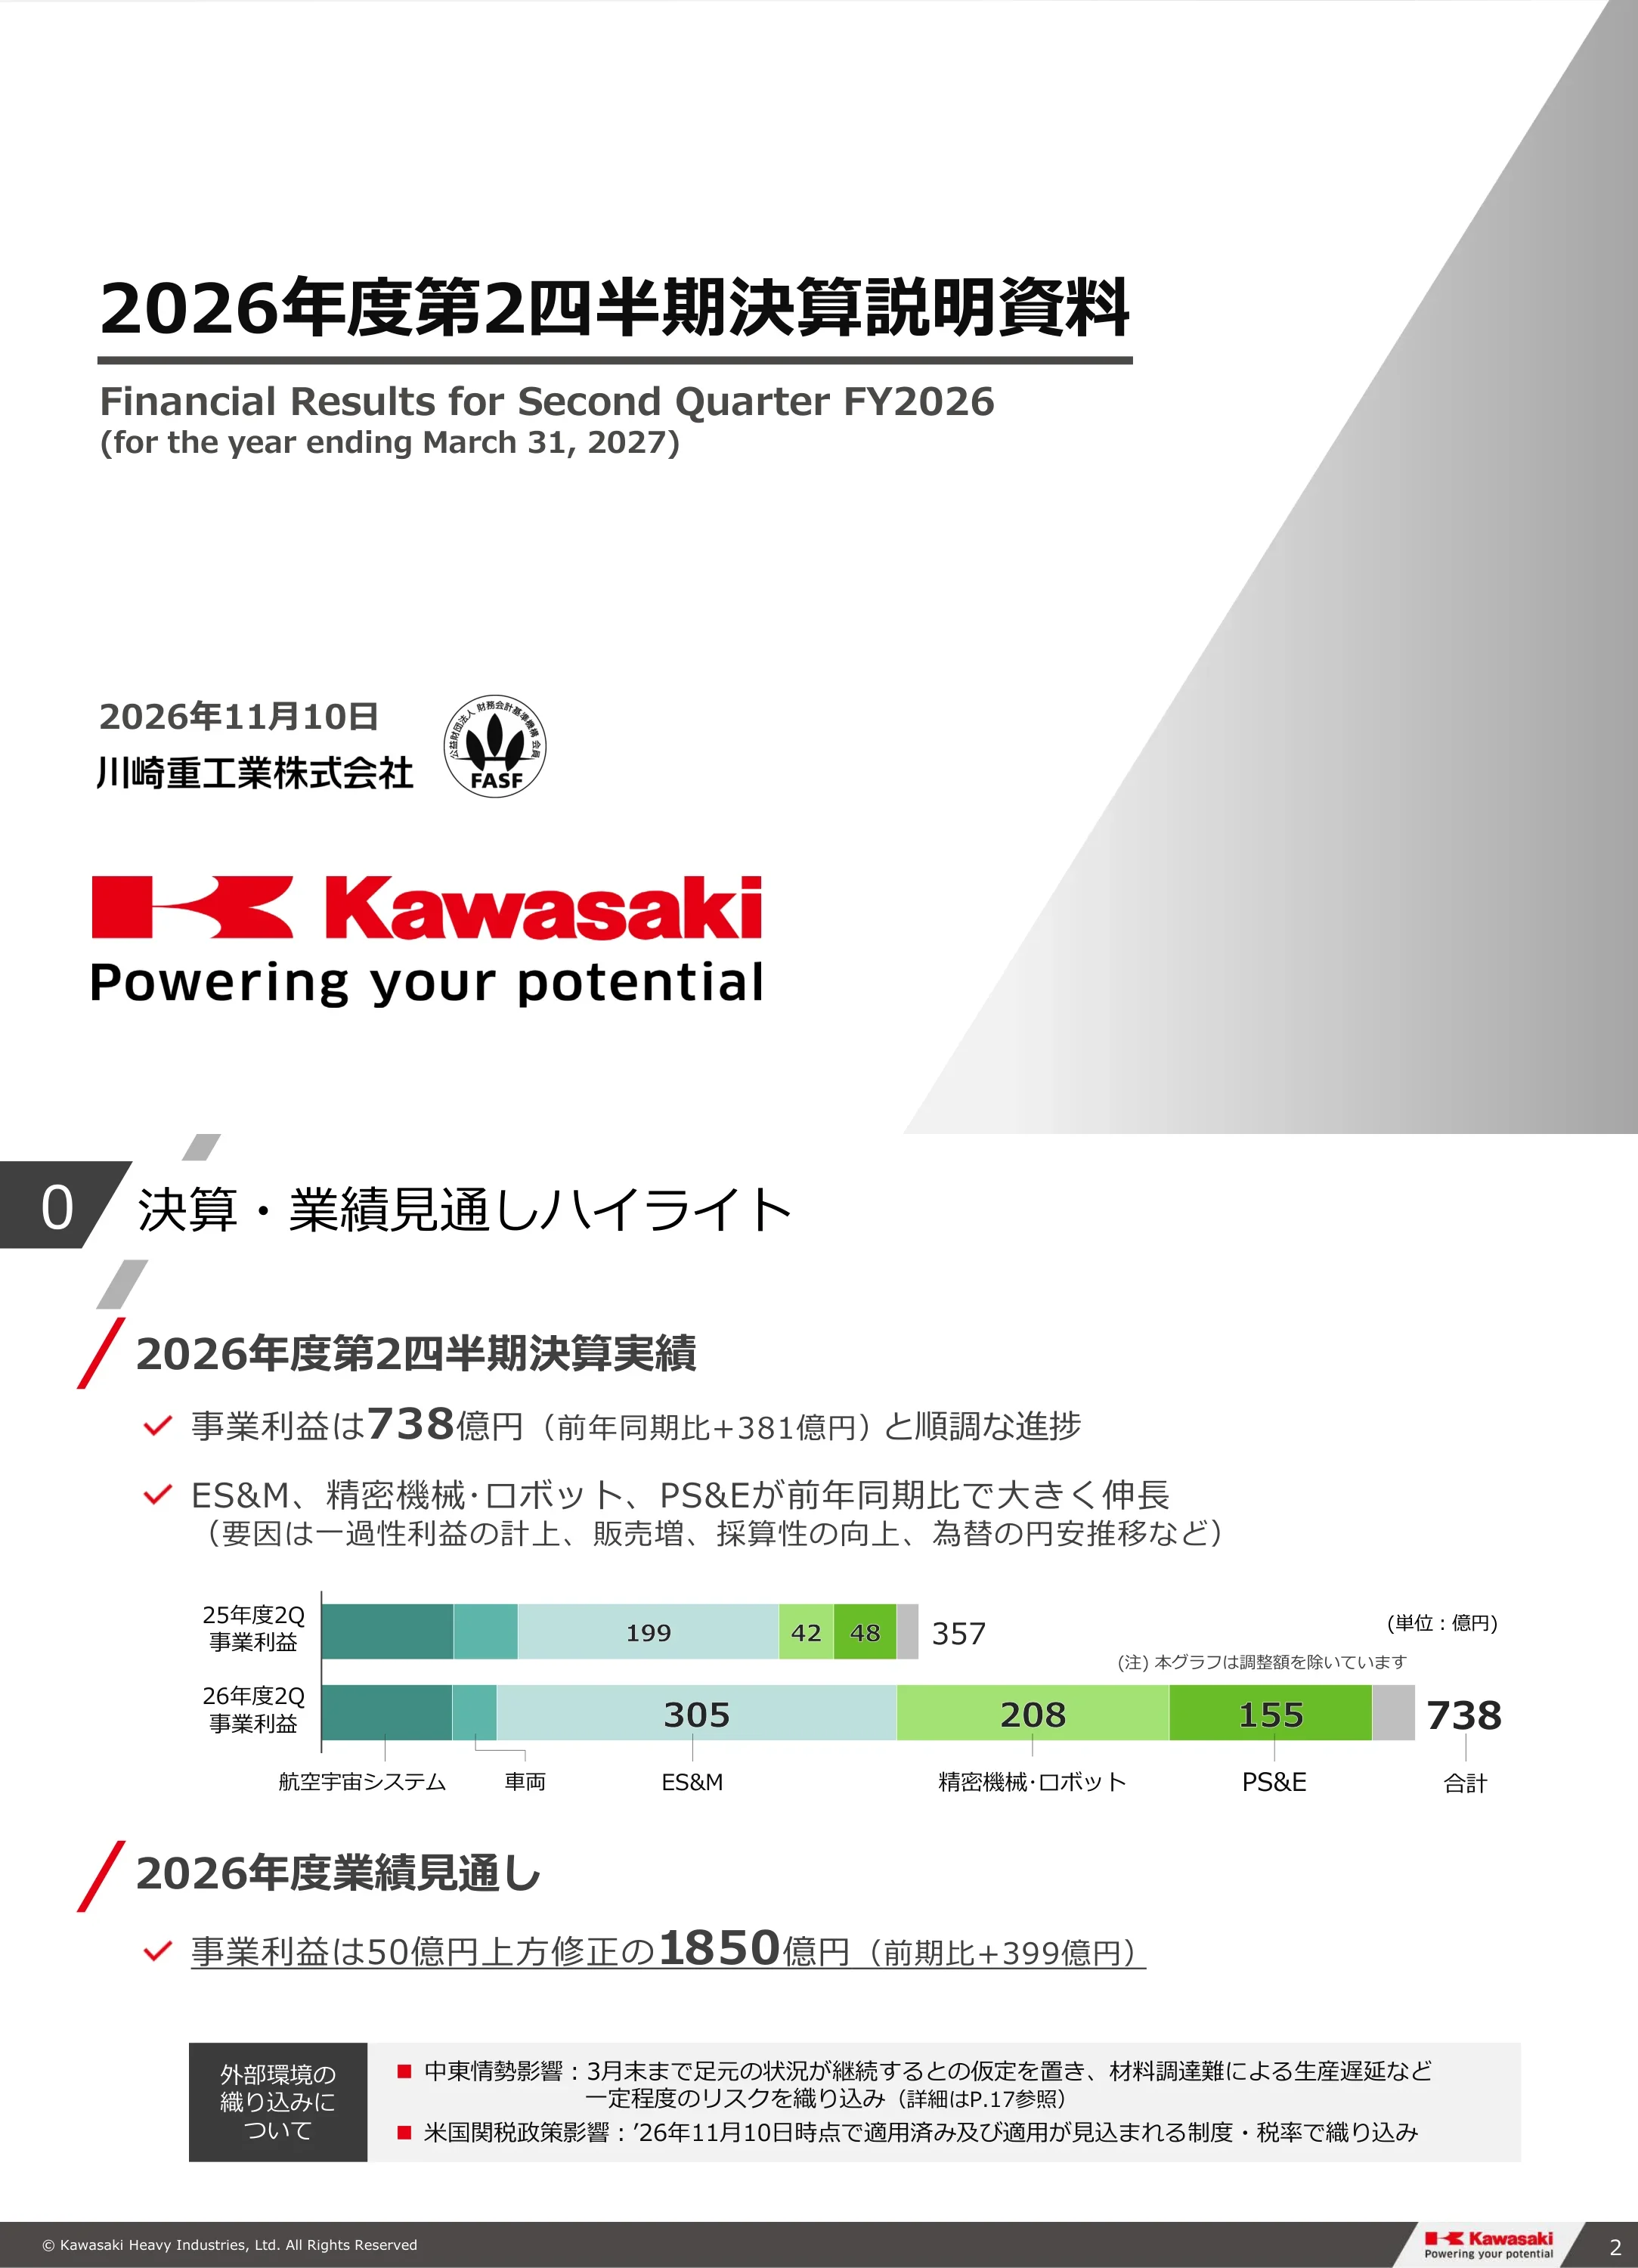
Title slide reading 2026年度第2四半期決算説明資料 (Financial Results for Second Quarter FY2026, for the year ending March 31, 2027), dated November 10, 2026, issued by Kawasaki Heavy Industries, Ltd. (川崎重工業株式会社).
Left-aligned large Japanese title with a rule and English subtitle, date and company name below, Kawasaki logo and tagline at bottom left, grey diagonal gradient wedge on the right.
H1 FY2026 operating profit was ¥73.8 billion (738 in ¥100 million units, 億円), up ¥38.1 billion year on year, with ES&M, Precision Machinery and Robot, and PS&E growing strongly. The full-year operating profit forecast is raised by ¥5.0 billion to ¥185.0 billion (up ¥39.9 billion on the prior year); Middle East and US tariff assumptions are noted.
Section tag and title on top, two checkmark bullets, a horizontal stacked bar comparing H1 FY2025 (357) with H1 FY2026 (738) by segment, then a forecast bullet and a grey assumptions box at the bottom.
Agenda in four sections with page numbers: 1 H1 FY2026 results (summary p.5, segments p.6, P&L p.7, profit drivers p.9, balance sheet p.11, cash flow p.13); 2 FY2026 forecasts (p.16-18); 3 Details by segment (Aerospace p.21, Rolling Stock p.25, ES&M p.29, Precision Machinery and Robot p.33, PS&E p.37); 4 Shareholder returns and other (p.42-47). A cautionary note on forward-looking statements and IFRS adoption from FY2022 Q1 appears below.
Four numbered parallelogram section headers arranged in a 2x2 grid, each with a list of topics and page numbers; a boxed disclaimer paragraph at the bottom.
Section divider for the H1 FY2026 results section, with the English subtitle Financial Results for Second Quarter FY2026 (for the year ending March 31, 2027). No figures.
Centered green parallelogram with the number 1, large title, horizontal rule and subtitle on a white background.
Orders ¥1,041.2 billion (10,412, +257), revenue ¥1,084.4 billion (10,844, +881), operating profit ¥73.8 billion (738, +381, margin 6.8%, +3.2pt), profit before tax 567 (+214) and profit attributable to owners of the parent 309 (+88). Record Q2 revenue and profits were helped by a US IEEPA tariff refund, a dispute settlement and a weaker yen (sales-weighted rate 158.18 yen per USD).
Two highlight bullets on a grey band, a left-hand financial table (H1 FY2025, Q1, Q2, cumulative, YoY) with the cumulative column outlined in red, and two quarterly bar charts on the right for revenue and operating profit with margins.
Segment table of orders, revenue and operating profit in ¥100 million units. Aerospace Systems revenue 2,826 (+400), operating profit 100 (-1); Rolling Stock 1,099 (-94), profit 34 (-15); ES&M profit 305 (+106); Precision Machinery and Robot profit 208 (+166); PS&E revenue 3,189 (+261), profit 155 (+107); total orders 10,412, revenue 10,844, profit 738.
Three checkmark callouts on a grey banner explaining numbered drivers, then a wide table grouped into Orders, Revenue and Operating profit with prior year, current year and change; red boxes mark the three profit drivers.
Revenue 10,844 (+881), gross profit 2,151 (+338, 19.8% margin), SG&A 1,678 (+128, 15.5% of revenue), share of profit of equity-method investees 156 (+41) and other income and expenses 108 (+129), leading to operating profit of 738 (+381, 6.8%). Notes cite fixed-cost control, strong results at the China shipbuilding JV and a robot dispute settlement.
Left-hand P&L table with prior year, current year, ratio and change columns and numbered red outline boxes; right-hand grey panel with three explanatory notes.
Below operating profit: net financial expense of 170 (-167 YoY) including an FX loss of 68 versus a 76 gain a year earlier, profit before tax 567 (5.2%), income tax 236, profit attributable to owners of the parent 309 (2.9%). The note lists period-end rates of 159.93 and 157.33 yen and a sales-weighted 158.18 yen per USD.
Same table layout as the previous page continuing from financial income and expenses to net profit, with one numbered callout and a grey side panel for the FX explanation.
Operating profit rose by ¥38.1 billion (+381) from 357 to 738. Drivers: FX +237, sales volume +83, US tariff cost increase -62, sales mix and other +154 (price adjustment +169, IEEPA tariff refund in PS&E +93, inflation and product mix -108), equity-method income +41, SG&A -72.
Two highlight bullets, then a waterfall bridge chart from the FY2025 H1 bar to the FY2026 H1 bar with a breakdown table under the sales-mix bar and footnotes.
Matrix of H1 operating profit drivers per segment, in ¥100 million: Aerospace 101 to 100, Rolling Stock 49 to 34, ES&M 199 to 305, Precision Machinery and Robot 42 to 208, PS&E 48 to 155, other 17 to 33, adjustments -101 to -99. Footnotes mention a 31 gain on a plant-subsidiary share sale, a robot dispute settlement and the 93 IEEPA refund.
A full-width table with segments as rows and columns for starting profit, FX, sales volume, tariffs, mix, equity-method income, SG&A, total change and ending profit, followed by six footnotes.
Total assets ¥3,347.4 billion (33,474, +228 from March 2026). Cash 876 (-277), receivables 9,426 (-937), inventories 9,232 (+1,010), current assets 22,694, non-current assets 10,779. Charts show fixed assets of 6,245 (turnover 1.74) and inventories of 9,232 (turnover 1.17) at September 2026.
Balance sheet asset table with change column and numbered callouts, a grey explanation panel at right, and two small bar-plus-line charts at the bottom.
Total liabilities 22,737 (-1,023), interest-bearing debt 6,688 (+627, due to the July 2026 equity and convertible bond issue), equity attributable to owners of the parent 10,048 (+1,267), total equity 10,736 (equity ratio 32.1%). Net D/E ratio is 56.4% and the cash conversion cycle is 173 days, lengthened by aerospace receivable turnover.
Liabilities and equity table at left with numbered callouts, a stacked debt chart with Net D/E line along the bottom, and right-hand panels for explanations and the cash conversion cycle table.
Operating cash flow was -88.0 billion yen (-880) as working capital absorbed 607; investing cash flow -494; free cash flow -1,375; financing cash flow +1,095 including new share issuance of 934 and convertible bonds of 1,010 (¥100 million units). The plant business transfer of its Earth Technica Co., Ltd. (アーステクニカ) shares is cited at 70 in the notes.
Cash flow table with prior year, current year and change, three numbered red callouts, and a grey explanation panel with fundraising amounts.
Bar and line chart of H1 operating cash flow, investing cash flow, free cash flow and working capital from FY2017 to FY2026. H1 FY2026 free cash flow was -1,375 and working capital reached 11,394, but a positive full-year FCF is expected. Text bullets note the yen-driven increase in foreign-currency receivables and inventories.
Two checkmark bullets on top, then a ten-period bar chart with a red FCF line and profit before tax figures in brackets, and an explanatory formula footnote.
Section divider for the FY2026 forecasts (for the year ending March 31, 2027). No figures.
Centered green parallelogram numbered 2, title, rule and English subtitle on white.
Full-year operating profit forecast raised ¥5.0 billion from August to 1,850 (+399 YoY, margin 7.2%); revenue 25,600; orders 24,900 (+700 from prior forecast); profit before tax 1,610; profit attributable to owners 1,180; after-tax ROIC 8.9%; free cash flow 200 (disclosed for the first time). H2 forecast: operating profit 1,112 at an assumed 150 yen per USD.
Two highlight bullets, then a large table with FY2025 actual, previous forecast, revised forecast (red outline), changes, H1 actual and H2 forecast (red outline).
Bridge from the August forecast of 1,800 to the new 1,850 (+50): FX +69, sales volume -8, equity-method income +45, aircraft engine receivable valuation loss -20, sales mix and SG&A -36. Notes assume Middle East conditions continue through March (about -30 already included) and US tariffs of about -280 are factored in; assumed rates 150 yen per USD and 180 yen per EUR.
Header with note, highlight banner, waterfall chart with two framed callouts for FX assumptions, and two text boxes on Middle East and US tariff impacts below.
Segment forecasts in ¥100 million: Aerospace revised down (revenue 7,100, profit 680, -40) on Boeing-related delays; ES&M revised up (orders 5,600 +600, profit 750 +60); Precision Machinery and Robot revenue 3,200 (+100), profit 330 (+20); Rolling Stock profit 100 and PS&E profit 300 unchanged; total profit 1,850 (+50).
Two numbered highlight bullets, then a table of orders, revenue and operating profit by segment with prior forecast, revised forecast (red outline) and revision amount.
A slide labelled 空白スライド (Intentionally blank slide) with no data.
Centered title and subtitle with rule on a white page, no other content.
Section divider for the segment detail pages (Details by Segment). No figures.
Centered green parallelogram numbered 3, title, rule and English subtitle.
H1 orders 2,041 (-810), revenue 2,826 (+400), operating profit 100 (-1). Full-year forecast revised: orders 6,400 (+100), revenue 7,100 (-100) and operating profit 680 (-40) because of delayed Boeing and Ministry of Defense deliveries and receivable valuation losses.
Grey top panel with two columns (H1 results YoY and FY forecast vs prior) with arrow icons for orders, revenue and profit; three bar charts below for orders, revenue and operating profit FY2022-FY2026.
Table of orders, revenue and profit with sub-lines for aerospace and aircraft engines: H1 orders 2,041, revenue 2,826, profit 100 (3.6%); FY forecast orders 6,400, revenue 7,100, profit 680 (9.6%); H2 profit 580. Supplemental tables list Boeing delivered units (767: 10, 777: 14, 777X: 10, 787: 42 in H1) and engine units (V2500: 15, PW1100G: 347).
Upper financial table with red-outlined H1, revised forecast and H2 columns, lower-left waterfall for profit drivers (+83 FX, +37 volume, -82 mix, -38 SG&A) and lower-right supplemental delivery tables.
Quarterly revenue and operating profit from FY2022 to Q2 FY2026, split into aerospace and aircraft engines. Q1 FY2026 revenue was 1,376 and Q2 was 1,450; operating profit was 16 (1.2%) in Q1 and 83 (5.8%) in Q2. FY2025 Q4 reached 2,248 revenue and 317 profit.
Two stacked-column charts, quarterly revenue on top and quarterly operating profit with a margin line below, grouped by fiscal year.
Left: commercial air travel demand is moving from recovery to growth; defense demand is expected to grow as defense spending accelerates; Japan's growth strategy covers aerospace and defense industry. Right: strengthening supply chain and production systems, defense transformation initiatives (stand-off electronic warfare aircraft, KJ300 engine) and technology strategy. A boxed note says the PW1100G-JM engine loss estimate is unchanged.
Two-column text slide with bullet headings on the left, three checkmarked initiative blocks with small photos (missile, C-2 aircraft, KJ300 engine) on the right, and a supplementary box at bottom left.
H1 orders 573 (+295) on new domestic rolling stock, revenue 1,099 (-94), operating profit 34 (-15). Full-year forecast kept: orders 1,300, revenue 2,300, operating profit 100 (no change).
Grey top panel with two columns of arrow-icon metrics, three bar charts for orders, revenue and operating profit FY2022-FY2026 below.
Table: H1 orders 573 (domestic and Asia 521, North America 52), revenue 1,099 (domestic and Asia 254, North America 844), operating profit 34 (3.1%). Full-year forecast orders 1,300, revenue 2,300, profit 100 (4.3%). Supplement: New York subway R211 project at September 2026 end with all 535 base cars completed, 510 of 640 Option 1 cars delivered, and 435 Option 2 cars ordered in January 2025.
Top table with red outlines, lower-left small waterfall (FX +23, volume -16, mix -10, SG&A -12) and lower-right bar chart of parts, overhaul and aftermarket revenue with R211 status bullets.
Quarterly revenue split between domestic/Asia and North America, and operating profit with margins, FY2022 to Q2 FY2026. Q1 FY2026 revenue 601 and Q2 498; profit 4 (0.8%) and 29 (5.9%).
Two stacked-bar charts: quarterly revenue on top and quarterly operating profit with a margin line below.
Domestic demand remains firm and overseas demand is expected from urban transit investment. The Dhaka Line 6 project is complete (all 144 cars delivered), and 378 NYCT R268 subway cars were ordered in December 2025 (about ¥225.0 billion, final delivery FY2030). Initiatives cover quality, aftermarket and the GreenDEC battery train. A note on the Middle East impact is included.
Left bullet list of market outlook with a supplementary box; right side has a project status table, a photo of a battery railcar, and checkmarked initiatives.
H1 orders 2,272 (-102), revenue 1,852 (-20), operating profit 305 (+106) helped by a subsidiary share sale gain and higher equity-method income. Full-year forecast: orders 5,600 (+600, LPG/ammonia carriers), revenue 4,700 (unchanged), profit 750 (+60).
Grey top panel with arrow-icon metrics for results and forecast, three FY2022-FY2026 bar charts below with August forecast tags.
Table with Energy, Plant and Marine Propulsion and Ship and Offshore sub-lines: H1 orders 2,272, revenue 1,852, profit 305 (16.5%) including equity income 158; forecast orders 5,600, revenue 4,700, profit 750 (16.0%), equity income 320. Waterfall: 199 to 305 (FX +8, volume -7, mix +62, equity +42, SG&A +1).
Top financial table with red outlines, lower-left profit waterfall, lower-right supplemental charts of energy product sales and plant environment sales with O&M ratio.
Quarterly revenue (energy/plant/ship propulsion vs shipbuilding) and operating profit with margins. Q1 FY2026 revenue 869 and Q2 983; operating profit 120 (13.9%) and 185 (18.8%).
Stacked quarterly revenue chart above, operating profit bars with margin line below.
Business environment by area: domestic power infrastructure and incinerator replacement demand, overseas data center gas turbine demand, high ship prices and submarine orders. Initiatives: an electric tugboat propulsion order and a next-generation digital shipyard with NVIDIA technology aiming at 1.5x productivity and 10-20% lower lifecycle cost.
Left side has three small grey-header tables; right side has two checkmarked initiative sections with example boxes and photos (electric tug image, signing ceremony, shipbuilding AI robot).
H1 orders 1,789 (+526), revenue 1,468 (+298) and operating profit 208 (+166) on hydraulics for Chinese construction machinery, semiconductor robots and a dispute settlement. Forecast raised: revenue 3,200 (+100), operating profit 330 (+20); orders 3,300 unchanged.
Grey top panel with arrow icons and short explanations, three bar charts below for orders, revenue and operating profit with August forecast tags.
Table with hydraulic and robot sub-lines: H1 orders 1,789 (hydraulics 1,044, robots 745), revenue 1,468, operating profit 208 (14.2%); forecast revenue 3,200, profit 330 (10.3%). Waterfall: 42 to 208 (FX +28, volume +58, mix +119, equity -4, SG&A -35). Supplement shows China hydraulic sales and robot sales by field (semiconductor 263 in H1).
Financial table with red outlines, lower-left profit waterfall, lower-right stacked bar chart for China hydraulics and a robot-by-field table.
Quarterly revenue split between hydraulics and robots plus operating profit with margins. Q1 FY2026 revenue 695 and Q2 772; operating profit 52 (7.6%) in Q1 and 156 (20.2%) in Q2.
Stacked quarterly revenue bars above and operating profit bars with a margin line below; the Q2 profit bar has a break mark.
Hydraulic markets: strong China mining and export demand, US pipeline and AI data center projects, India infrastructure. Robots: semiconductor and general memory demand rising. Initiatives include a 7.5 billion yen (75億円) capacity investment (1.5x in FY2027, 2x in FY2029), a technical cooperation agreement with Bosch Rexroth (September 2026) and the hinotori surgical robot.
Left side shows market sub-tables for hydraulics and robots; right side has initiative blocks, a photo of the signing and an investment decision callout box.
H1 revenue 3,189 (+261) and operating profit 155 (+107) due to the IEEPA tariff refund, lower promotion costs and weaker yen. Forecast unchanged: revenue 7,300, operating profit 300. Orders are not shown because the segment mostly produces to forecast.
Grey top panel with arrow icons, a text note replacing the orders chart, and two bar charts for revenue and operating profit with August forecast tags.
H1 revenue 3,189 (advanced-market motorcycles 1,041, emerging-market motorcycles 538, ATV and PWC 961, general engines 647), operating profit 155 (4.9%). Forecast revenue 7,300 and profit 300 (4.1%). Waterfall: 48 to 155 (FX +95, volume +2, tariff cost -54, mix +43, SG&A +18). A regional unit sales table shows wholesale thousands of units.
Top financial table with red outlines, profit waterfall at lower left and a regional unit sales table with trend icons at lower right.
Quarterly revenue (Q1 FY2026 1,707, Q2 1,482) and operating profit (Q1 192 at 11.3%, Q2 -36 at -2.5%) from FY2022 to Q2 FY2026. Seasonality is visible with Q4 revenue peaks.
Single-series revenue bar chart on top, operating profit bars with margin line below.
Regional commentary: US motorcycle retail remains soft and ATV and PWC full-size model sales are strong, tariff risk, European recovery with Chinese competition, and weak Southeast Asia. Initiatives: attractive models such as the Ninja H2 CARBON, strengthening the four-wheel business and a retail finance joint venture established with ITOCHU in April 2025.
Left side lists regional bullets with a supplemental Middle East note; right side has four checkmarked initiatives with a motorcycle photo and progress and plan labels.
Section divider for shareholder returns and other information. No figures.
Centered green parallelogram numbered 4, title, rule and English subtitle.
The FY2026 dividend forecast is unchanged: interim 20.0 yen and year-end 20.0 yen, annual 40.0 yen versus 34.2 yen in FY2025 (+5.8), restated for the 5-for-1 split on April 1, 2026. The policy targets a dividend on equity (DOE) of about 4%, with dividends basically increasing every year.
Left side explains the DOE 4% policy with a large figure; right side has a dividend table with the forecast column outlined, and a bar chart of per-share dividends from FY2016 to FY2026 with a trend arrow.
A prototype multipurpose shipbuilding AI robot that welds, inspects and paints while attached to ship hulls was unveiled in October 2026, with demonstration at the Sakaide works in FY2027 and market launch in FY2028. Japan plans over ¥1 trillion of public-private investment in shipbuilding; Kawasaki plans about ¥100 billion (1,000億円) of growth investment from FY2026 to FY2035 aiming at revenue of ¥200 billion or more and a 15% margin.
Left side has a headline, bullets and a digital shipyard photo with a welding robot inset; right side has opportunity and challenge tags, a strengths diagram and a growth image bar chart to FY2035.
A prototype of Home LEO, a social robot to support elderly people living at home, is presented as the home-care step in a one-stop service chain (hospital, nursing care, home). Four features are listed: understanding users, safe living support, autonomous physical AI support and linkage with medical and care providers. A note says some features are planned.
Headline and bullets at top left, a service-flow diagram, large Home LEO robot render with QR codes at right, and four numbered feature boxes with photos along the bottom.
Three hydrogen items: installation of a 30 MW class hydrogen-only gas turbine completed at RWE's Emsland plant in Germany (September 2026); a memorandum on liquid hydrogen with the Grand Est region and the Port of Strasbourg in France (September 2026); construction started in October 2026 on Japan's largest hydrogen liquefaction plant (50 tons per day) at the Kawasaki LH2 terminal, completion at the end of 2028.
Three equal columns, each with a photo or rendering, a dark caption bar, descriptive text, and a QR code with press release URL at the bottom, on a sky-blue header background.
Kawasaki Heavy Industries reached its 130th anniversary in October 2026. Items: the brand movie, the renewed Kawasaki World museum in Kobe, special sponsorship of the film 'Monet' (scheduled for release in October 2027), a Hyogo Prefectural Museum of Art exhibition related to the Matsukata Collection, and a guidebook from the travel magazine Rurubu.
Intro with the 130 Years Forward logo at top left; five boxed items arranged in two columns with thumbnails, film credits, exhibition poster and guidebook cover.
H1 capex 597 (-5), depreciation 542 (+37), R&D 281 (+8). Full-year forecast: capex 1,700 (+267), depreciation 1,050, R&D 645 (+77), year-end employees 42,740 (domestic 31,110, overseas 11,630; +1,088 YoY). Charts show multi-year capex versus depreciation and revenue ratios.
A top table with a red-outlined revised forecast column and two charts below: a line chart of capex and depreciation FY2019-FY2026 and a revenue bar chart with depreciation and R&D ratio lines.
For the four years FY2027-FY2030, cash-in is about ¥1.3 trillion: operating cash flow before R&D of 11,000 plus 2,000 of equity financing (raised in FY2026). Cash-out: growth investment 5,500 (including R&D), recurring investment 5,500 and shareholder returns 2,000, in ¥100 million units. Growth areas are robots and physical AI, aerospace and aircraft engines, hydrogen and gas turbines and ships.
Left stacked cash-in and cash-out bars with a purple highlight for funding; right donut chart breaking down the 5,500 growth investment by field.
Quarterly orders by segment from FY2024 Q1 to FY2026 Q2. FY2026 Q1 total orders were 5,257 and Q2 5,154 (¥100 million units); Aerospace Q2 1,314, Rolling Stock 144, ES&M 1,020, Precision Machinery and Robot 894, PS&E 1,479.
A wide table with fiscal years as column groups and segment and sub-segment rows (aerospace, engines, hydraulics, robots, energy, marine) plus a total row.
Defense orders in H1 were 746 (-1,304) and revenue 1,812 (+232, 16.7% of company revenue). Full-year forecast orders 4,505 and revenue 5,140 (20.1% of company revenue), in ¥100 million units, split into aircraft and others, aircraft engines, and submarines and ship engines.
A single table with prior year, H1, previous forecast and revised forecast columns (revised in red outline) and sub-rows below orders and revenue.
Bridge from the May initial forecast of 1,700 to 1,850 (+150): FX +124, volume -27, US tariff cost +55, tariff response -15, IEEPA refund +93, Middle East concern easing +48, robot upward revision +100, engine receivable loss -20, equity income +45, mix and SG&A -253. Tables show tariff and Middle East impacts by segment.
Waterfall chart with two tables beneath explaining the annual US tariff impact (-337 to -282) and Middle East impact (-79 to -31) by segment.
Order backlog at the end of Q2 FY2026 was 32,118 (+4,153 YoY): Aerospace 14,613, Rolling Stock 5,573, ES&M 9,838, Precision Machinery and Robot 1,428. Also shows marine backlog history and a table of ships by type (LPG carriers, submarines) by completion year with a total backlog of 11 ships.
Backlog table at top left, marine backlog bar chart at the bottom left and a ship type and completion table at the bottom right.
H1 FY2026 revenue by customer location: Japan 3,792, US 3,746, Europe 1,051, Asia 1,555, other 699, total 10,844 (¥100 million units). A segment-by-region matrix is shown for H1 FY2025 and FY2026, with shares Japan 35.0%, US 34.5%, Europe 9.7%, Asia 14.3%, other 6.4%.
Small regional summary table on the left and two larger segment-by-region matrices stacked on the right.
FX-sensitive foreign currency volumes: total USD 13.8 billion in H1 FY2026 and 15.8 billion forecast for H2 (EUR 2.1 and 2.3 billion). The sales-weighted EUR/JPY was 185.32 versus an assumed 180.00. Adjustments were -99 in H1 and -370 forecast for FY2026. A ROIC formula is also given.
Currency exposure table at upper left, EUR/JPY list and ROIC formula at upper right, and an adjustments breakdown table along the bottom.
Closing slide with the vision statement 世界の人々の豊かな生活と地球環境の未来に貢献する 'Global Kawasaki' and the Kawasaki logo with Powering your potential.
Full-bleed teal background with diagonal translucent shapes, centered white text and logo on a footer band.
Common questions about this slide and the underlying presentation content.
It is a 55-page deck on second-quarter FY2026 results: a highlights page, summary financials, income statement, balance sheet, cash flow, full-year forecasts, five segment sections, shareholder returns, project topics and reference tables. H1 revenue was ¥1,084.4 billion and operating profit ¥73.8 billion.
FY2026 is the fiscal year ending March 31, 2027, so H1 (second quarter, cumulative) is April to September 2026. The cover title is 2026年度第2四半期決算説明資料 and the deck is dated November 10, 2026.
The slides are in Japanese with an English subtitle on the cover and section dividers, and the original was published on TDnet, the Tokyo Stock Exchange timely disclosure system, as the company's 決算説明資料 for the quarter. This gallery page gives an English page-by-page analysis.
Orders 10,412, revenue 10,844 and operating profit 738 (all in ¥100 million units, 億円) for H1 FY2026, with operating profit up 381 year on year. Full-year operating profit guidance was raised by ¥5.0 billion to ¥185.0 billion on revenue of ¥2,560.0 billion.
Energy Solution & Marine rose by 106 to 305, Precision Machinery and Robot by 166 to 208 and Power Sports & Engine by 107 to 155. Aerospace Systems was flat at 100 and Rolling Stock fell by 15 to 34.
The original is the company's announcement on TDnet and on the Kawasaki Heavy Industries investor relations site, which is the authoritative source. This page is an independent summary and the slides remain the property of the company.
The gallery page offers the slides for download in the formats the platform provides, such as PDF or PPTX where available. Check the download options on this page, and use the original filing for official use.
Yes. Its repeating structure of section dividers, highlight banners, results tables with red-outlined forecast columns, waterfall charts and quarterly bar charts is easy to adapt. Replace the figures and keep the page rhythm for a quarterly IR deck.
Company IR site where financial results materials are published

Create Your Own Slides
Turn your ideas into professional presentations in seconds with 2slides AI.
Reference professional designs, choose your style, and generate slides with perfect text rendering. Powered by Nano Banana—start creating your presentation now.
Your AI Agent for slides. Save time, shine faster with intelligent presentation creation.


© 2026 2slides. All rights reserved.